Article
1
Surface Response Methodology-Based Mixture
2
Design to Study the Influence of Polyol Blend
3
Composition on Polyurethanes Properties
4
Said Arévalo-Alquichire1,2, Maria Morales-Gonzalez1, Luis Diaz3 and Manuel Valero1,*
5
1 Energy, materials and environment group, faculty of engineering, Universidad de La Sabana, Chia,
6
Colombia
7
2 Doctoral program of biosciences, Universidad de La Sabana, Chia, Colombia
8
3 Bioprospecting research group, faculty of engineering, Universidad de La Sabana, Chia, Colombia
9
* Correspondence: [email protected]; Tel.: +57 1 8615555 x 25224
10
11
Abstract: Polyurethanes are materials with a strong structure-property relationship. The goal of this
12
research was to study the effect of a polyol blend composition of polyurethanes on its properties
13
using a mixture design and setting mathematic models for each property. Water absorption,
14
hydrolytic degradation, contact angle, tensile stretch, hardness and modulus were studied.
15
Additionally, Thermal stability was studied by thermogravimetric analysis. Area under the curve
16
was used to evaluate the effect of polyol blend composition on thermal stability and kinetics of water
17
absorption and hydrolytic degradation. Least squares were used to calculate the regression
18
coefficients. Models for the properties were significant, and lack of fit was not (P<0.05). Fit statistics
19
suggest both good fitting and prediction. Water absorption, hydrolytic degradation and contact
20
angle were mediated by the hydrophilic nature of the polyols. Tensile strength, modulus and
21
hardness could be regulated by the molecular weight and hydroxyl index of the polyols. Regression
22
of DTG curves from thermal analysis showed improvement of thermal stability with the increase of
23
PCL and PE. An ANOVA test of the model terms demonstrated that three component effects on
24
bulk properties like water absorption, hydrolytic degradation, hardness, tensile strength and
25
modulus, and the PEG*PCL interaction with the contact angle, which is a surface property. Mixture
26
design application allowed for an understanding of the structure-property relationship through
27
mathematic models.
28
Keywords: polyurethane; polyol; Mixture design; Design of experiment; structure-properties
29
relationship
30
31
1. Introduction
32
Polyurethanes (PUs) are a special group of polymers with a wide range of applications in
33
industry, including in adhesives, aircrafts, furniture, isolation, construction and biomedical
34
applications. Versatility is explained by the variety of properties expressed by PUs, which are closely
35
related with its composition[1]. The primary synthesis begins with the reaction of a poly-hydroxyl
36
donor called a polyol and isocyanate to form a urethane bond. The structure depends on the ratios of
37
the compounds. PUs can be obtained in flexible and rigid foams, thermoplastics, coatings, adhesives,
38
sealants, elastomers, waterborne dispersions[2] and hydrogels[3]. The three main components in
39
polyurethane synthesis are the polyol, isocyanate and chain extenders or crosslinkers. Polyols form
40
the soft segment, and isocyanate and a chain extender or crosslinker form the hard segment. The
41
nature of the polyol and the hard segment content in PUs could regulate both bulk and surface
42
properties[1].
43
44
Thus, studies of polyol composition have been carried out. Trzebiatowska et al. (2018) obtained
45
polyurethanes from the glycerolysate of recycled polyurethanes and poly(ethylene-butylene) adipate
46
diol. As the content of the recycled component increased, the swelling ratio decreased, and the
47
crosslink density simultaneously increased, resulting in the rise of glass transition and storage
48
modulus at room temperature. Thermomechanical stability, tensile strength, elastic modulus and
49
hardness of the PUs also increased and elongation at break decreased with the incorporation of
50
glycerolysate. The original polyol used was tri-functional, and as such, it is possible to have more
51
linkages per polyol molecule. Additionally, more networks could be created in this material as its
52
structure is more branched. These properties can result in a reduction in polymer chains
53
movement[2].
54
55
Bil et al. (2010) worked with aliphatic poly(ester-urethanes) from poly(ε-caprolactone) diol having
56
different molecular masses (M = ∼530, 1250 and 2000Da), cycloaliphatic diisocyanate 4,4′
-57
methylenebis (cyclohexyl isocyanate) and ethylene glycol as a chain extender. Changes in the
58
macromolecule order, with increasing hard segment content, were observed via modulated
59
differential scanning calorimetry. Depending on the hard segment content, gradual variations in the
60
polyurethane surface properties were observed. Furthermore, as the content of the hard segments
61
increased, the polyurethane surface exhibited more phase separation, a higher content of urethane
62
moieties and higher hydrophilicity[4]. Moreover, previous work in our lab has been focused on the
63
effect of polyol as well. Uscategui et al. (2017) evaluated the effects of the type of polyols, derived
64
from castor oil by transesterification with pentaerythritol, with the incorporation of low
65
concentrations of chitosan on the mechanical and biological properties of the polymer. The goal of
66
this study was to obtain suitable materials in the design of biomaterials showing that increasing
67
physical crosslinking increased the mechanical and adhesive properties, and bacterial inhibition
68
depended on the polyol and percentage of chitosan[5].
69
70
Additionally, chain extenders and crosslinkers could tune the mechanical properties and hydrolytic
71
stability of PUs. They are low molecular weight compounds that produce elastomeric behavior in
72
PUs. Difunctional molecules are considered chain extenders, and higher functionalities are classified
73
as crosslinkers. Shoaib et al. (2018) studied the effect of amino acid incorporation as chain extenders
74
on the biocompatible and biodegradable properties, and pH responsive drug delivery of
75
polyethylene glycol-based PUs. All PUs showed higher swelling ability (4–13%), hydrolytic
76
degradation (20–38%) and cell viability (>90%). Additionally, arginine had lower values of release at
77
pH 7.4 as a chain extender, which resulted in less toxicity while fulfilling the requirements. However,
78
at lower pH, behavior change due to the presence of free amino groups in arginine, which were
79
protonated in the presence of acidic conditions, resulted in greater swelling and solvent penetration,
80
thus increasing drug release[6].
81
82
Most of those works reported valuable knowledge about the effects of polyols and chain extenders.
83
However, most qualitatively described the interactions between the components of the PUs based on
84
the performance of some properties or, in some cases, just analyzed the behavior of one parameter.
85
To establish the impact of these interactions quantitatively, design of experiment can be used. Design
86
of experiment is a well stablished concept for the planning and execution of informative
87
experiments[7]. Experimental design is a specific set of experiments defined by a matrix composed
88
by the different level combinations of the variables studied[8]. One type of design applications
89
concerns the preparation and modification of mixtures. This involves the use of mixture designs to
90
explore the effect on mixture properties[7]. Experimental design has advantages such as cost and time
91
economy, a reduced number of runs required to analyze the effects and the analysis of more than one
92
factor at a time[9]. In the polymer field, Olivato et al. (2013) proposed a mixture model to evaluate
93
the effect of tartaric acid on the properties of starch/poly(butylene adipate co-terephthalate) blown
94
films plasticized with glycerol. They found that the interaction between the polymer and tartaric acid
95
has a positive effect on the tensile strength and puncture force. Additionally, a greater proportion of
tartaric acid increased Young’s modulus and contributed to the reduction in water vapor
97
permeability[10]. Abolghasemi Fakhri et al. (2018) studied ternary-based nanocomposites based on
98
polystyrene, nanoclay and zinc oxide nanoparticles for food packaging material using a central
99
composite design-based response surface methodology. They found a synergistic effect between
100
nanoclay and zinc oxide, resulting in the improvement of the mechanical and color properties of the
101
mixture[11].
102
103
Specifically, in the polyurethanes field, Li et al. (2017) examined bio-based flexible polyurethane
104
foams using bio-polyol, extracted from the fast pyrolysis oil of wheat straw, foaming processes such
105
as the bio-polyol to petroleum-based polyol ratio, the polymethylene polyphenylene isocyanate to
106
polymeric diphenyl-methane diisocyanate ratio, and the crosslinking agent content was optimized
107
using response surface methodology. Resilience was found to increase with an increasing amount of
108
petroleum-based polyol, while for bio-polyol, resilience was decreased up to a medium dosage after
109
which there was a slight increase. However, increasing the amount of polymethylene polyphenylene
110
isocyanate along with the petroleum-based polyol had a positive influence on the resilience of PUs,
111
though it declined at a high dosage of polymethylene polyphenylene isocyanate[12]. Zhao et al. (2018)
112
fabricated expanded thermoplastic polyurethane bead foams with supercritical CO2 as a blowing
113
agent. They studied the influences of saturation pressure, temperature and soaking time and their
114
interactions on foaming behavior through a response surface methodology based on the
Box-115
Behnken design. This showed that saturation temperature was the most significant parameter
116
affecting the expansion ratio, shrinkage ratio, and cell morphology of PUs foams. There was an
117
interaction effect between saturation temperature and soaking time, wherein the expansion ratio of
118
the foams was more sensitive to changes in soaking time at higher temperatures. As the soaking time
119
increased, the shrinkage of PUs foams increased first and then leveled off , and the cell diameter
120
decreased significantly[13].
121
122
Despite interest in understanding the structure-property relationship of polyurethanes, to the bets of
123
our knowledge there are no reports regarding the application of design of experiments to evaluate
124
the influence of monomer composition on polyurethanes. Thus, the goal of this research is to evaluate
125
the effect of polyol bled composition on the properties of polyurethanes, including water absorption,
126
hydrolytic degradation, contact angle, tensile strength and modulus, through mixture design and
127
data regression, generating mathematic models to better understand the structure-property
128
relationship in PUs.
129
2. Results & Discussion
130
2.1. Polyurethane synthesis and chemical structure
131
In this work, effect of polyol composition and crosslinker concentration was evaluated on different
132
properties like: thermal behavior, hydrophilicity and hydrolytic degradation and mechanical
133
behavior based on tensile test and hardness. Polyethylene glycol (PEG), Polycaprolactone diol (PCL)
134
and pentaerythritol (PE) concentrations were studied. From this point, polyol blend should be
135
understood as the combination of PEG, PCL and PE.
137
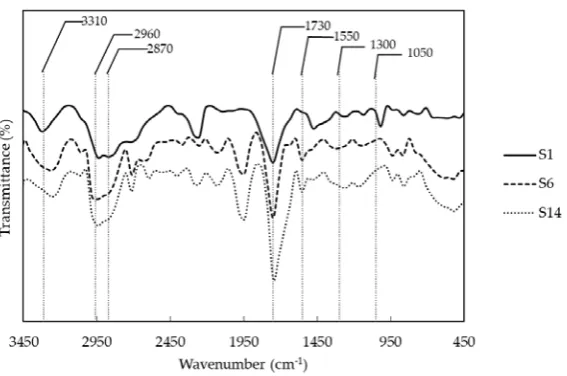
Figure 1.Representative infrared spectra of polyurethanes with different combination of polyols. S1)
138
PCL and PE, S6) PCL, PEG and PE, and S14) PEG and PE
139
140
Successful of polyurethane synthesis was evaluated by FTIR (Fourier transform infrared
141
spectroscopy). Figure 1 shows the functional groups of some synthetized polyurethanes with
142
different polyol combinations. In general, polymers show the following peaks: at approximately 3310
143
cm-1, we observed the overtone related with the stretching of N-H bound from urethane and, near
144
1550 cm-1, the original signal. The asymmetric and symmetric vibration signals of -CH2 from the soft
145
segments of the PCL and PEG and PE, from the hard segment, were observed at 2960 and 2870 cm-1.
146
At 1730 cm-1, we can see the characteristic peak of urethane bound related with -C=O stretching.
147
Additionally, between 1300 and 1050 cm-1, there are two peaks related to the asymmetric and
148
symmetric stretching of -C-O-C- group, which is also part of the urethane bond. Finally, under 1050
149
cm-1,there are peaks related to the vibration of the aliphatic ring from the IPDI. According to the
150
above, polyurethanes were obtained with an integration of polyols, crosslinker and isocyanate
151
structures.
152
2.2. Mixture design
153
In this work, we applied a mixture design to study the influence of polyol blend composition. It
154
had 9 design points with 7 repetitions (See Table 4). Three of the design points were located at the
155
extreme where PCL was the major component represented by S1, S2, S3, S4, S5. Another three points
156
were in the middle of the experimental space (S6, S7, S8, S9, S10, S11). Finally, three points at the
157
opposite extreme where PEG was the major component (S12, S13, S14, S15, S16).
158
159
Reponses were analyzed by box-cox distribution. Transformations were carried out according with
160
box-cox suggestions. Therefore, the inverse square root of water absorption and the square root
161
of hydrolytic degradation and tensile stretch were applied. Non-transformations were made on
162
contact angle, modulus, hardness, kinetics of water absorption and hydrolytic degradation, and
163
thermal responses. Additionally, DFFITS tests was applied to identify influential points. For
164
contact angle, 2 influential points were deleted from the analysis (S15 and S16). Response of S11
165
and S7 were removed for kinetics of water absorption and thermal response, respectively.
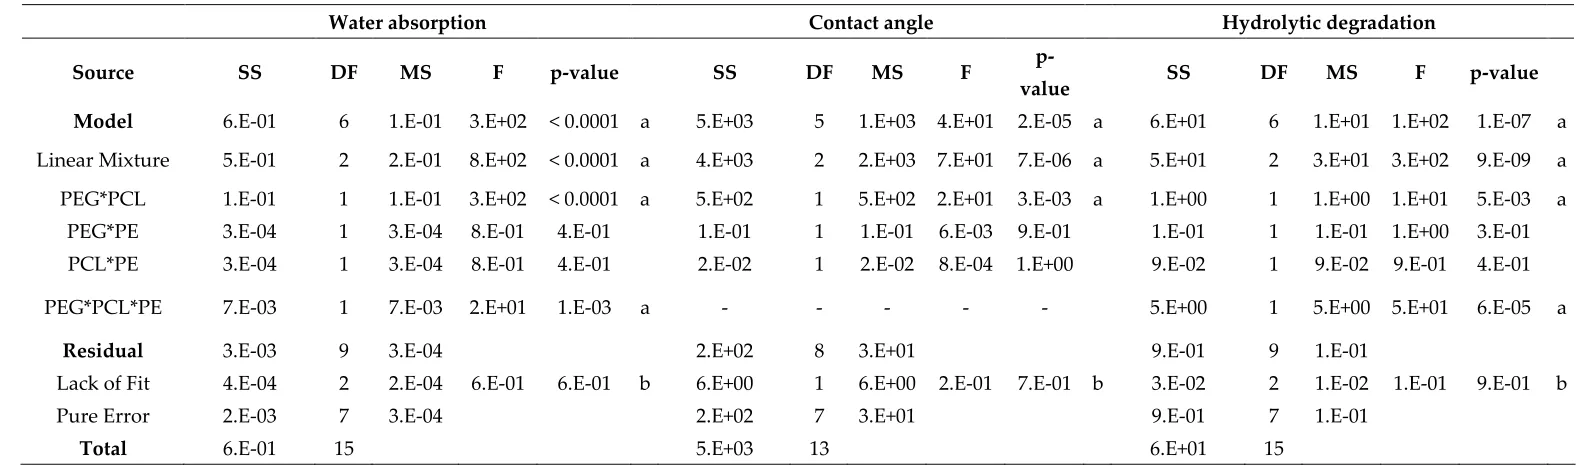
Table 1. ANOVA test of model regression for water absorption, contact angle and hydrolytic degradation
168
Water absorption Contact angle Hydrolytic degradation
Source SS DF MS F p-value SS DF MS F
p-value SS DF MS F p-value
Model 6.E-01 6 1.E-01 3.E+02 < 0.0001 a 5.E+03 5 1.E+03 4.E+01 2.E-05 a 6.E+01 6 1.E+01 1.E+02 1.E-07 a Linear Mixture 5.E-01 2 2.E-01 8.E+02 < 0.0001 a 4.E+03 2 2.E+03 7.E+01 7.E-06 a 5.E+01 2 3.E+01 3.E+02 9.E-09 a PEG*PCL 1.E-01 1 1.E-01 3.E+02 < 0.0001 a 5.E+02 1 5.E+02 2.E+01 3.E-03 a 1.E+00 1 1.E+00 1.E+01 5.E-03 a PEG*PE 3.E-04 1 3.E-04 8.E-01 4.E-01 1.E-01 1 1.E-01 6.E-03 9.E-01 1.E-01 1 1.E-01 1.E+00 3.E-01 PCL*PE 3.E-04 1 3.E-04 8.E-01 4.E-01 2.E-02 1 2.E-02 8.E-04 1.E+00 9.E-02 1 9.E-02 9.E-01 4.E-01 PEG*PCL*PE 7.E-03 1 7.E-03 2.E+01 1.E-03 a - - - 5.E+00 1 5.E+00 5.E+01 6.E-05 a
Residual 3.E-03 9 3.E-04 2.E+02 8 3.E+01 9.E-01 9 1.E-01
Lack of Fit 4.E-04 2 2.E-04 6.E-01 6.E-01 b 6.E+00 1 6.E+00 2.E-01 7.E-01 b 3.E-02 2 1.E-02 1.E-01 9.E-01 b Pure Error 2.E-03 7 3.E-04 2.E+02 7 3.E+01 9.E-01 7 1.E-01
Total 6.E-01 15 5.E+03 13 6.E+01 15
a: Significant at the 95% level; b: Not significant at the 95% level; DF: Degrees of freedom; SS: Sum of squares; MS: Mean square; F: Ratio
169
170
171
Table 2. ANOVA test of model regression for thermal stability, water absorption kinetics and hydrolytic degradation kinetics
172
Thermal Stability Water absorption kinetics Hydrolytic degradation kinetics
Source SS DF MS F p-value SS DF MS F p-value SS DF MS F p-value
Model 6.E-01 2 3.E-01 9.E+01 4.E-08 a 2.E+08 6 3.E+07 2.E+03 5.E-12 a 3.E+07 6 6.E+06 3.E+02 6.E-10 a Linear
PEG*PCL - - - 6.E+06 1 6.E+06 4.E+02 4.E-08 a 3.E+06 1 3.E+06 1.E+02 8.E-07 a PEG*PE - - - 1.E+05 1 1.E+05 8.E+00 2.E-02 4.E+04 1 4.E+04 2.E+00 2.E-01 PCL*PE - - - 2.E+04 1 2.E+04 1.E+00 3.E-01 3.E+04 1 3.E+04 2.E+00 2.E-01 PEG*PCL*PE - - - 1.E+07 1 1.E+07 9.E+02 2.E-09 3.E+06 1 3.E+06 1.E+02 9.E-07 a
Residual 4.E-02 12 3.E-03 1.E+05 8 1.E+04 2.E+05 9 2.E+04
Lack of Fit 2.E-02 6 4.E-03 1.E+00 5.E-01 b 4.E+04 2 2.E+04 1.E+00 3.E-01 b 3.E+04 2 1.E+04 8.E-01 5.E-01 b Pure Error 2.E-02 6 3.E-03 8.E+04 6 1.E+04 1.E+05 7 2.E+04
Total 7.E-01 14 2.E+08 14 3.E+07 15
a: Significant at the 95% level; b: Not significant at the 95% level; DF: Degrees of freedom; SS: Sum of squares; MS: Mean square; F: Ratio
173
174
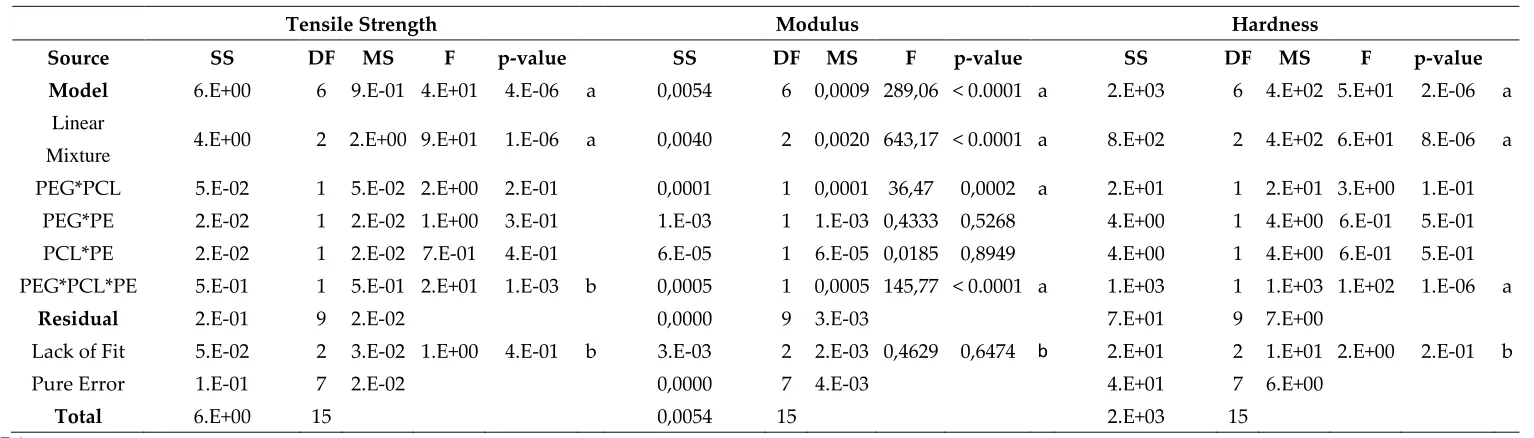
Table 3. ANOVA of model regression of tensile strength, modulus and hardness
175
Tensile Strength Modulus Hardness
Source SS DF MS F p-value SS DF MS F p-value SS DF MS F p-value
Model 6.E+00 6 9.E-01 4.E+01 4.E-06 a 0,0054 6 0,0009 289,06 < 0.0001 a 2.E+03 6 4.E+02 5.E+01 2.E-06 a
Linear
Mixture 4.E+00 2 2.E+00 9.E+01 1.E-06 a 0,0040 2 0,0020 643,17 < 0.0001 a 8.E+02 2 4.E+02 6.E+01 8.E-06 a
PEG*PCL 5.E-02 1 5.E-02 2.E+00 2.E-01 0,0001 1 0,0001 36,47 0,0002 a 2.E+01 1 2.E+01 3.E+00 1.E-01 PEG*PE 2.E-02 1 2.E-02 1.E+00 3.E-01 1.E-03 1 1.E-03 0,4333 0,5268 4.E+00 1 4.E+00 6.E-01 5.E-01 PCL*PE 2.E-02 1 2.E-02 7.E-01 4.E-01 6.E-05 1 6.E-05 0,0185 0,8949 4.E+00 1 4.E+00 6.E-01 5.E-01 PEG*PCL*PE 5.E-01 1 5.E-01 2.E+01 1.E-03 b 0,0005 1 0,0005 145,77 < 0.0001 a 1.E+03 1 1.E+03 1.E+02 1.E-06 a
Residual 2.E-01 9 2.E-02 0,0000 9 3.E-03 7.E+01 9 7.E+00
Lack of Fit 5.E-02 2 3.E-02 1.E+00 4.E-01 b 3.E-03 2 2.E-03 0,4629 0,6474 b 2.E+01 2 1.E+01 2.E+00 2.E-01 b Pure Error 1.E-01 7 2.E-02 0,0000 7 4.E-03 4.E+01 7 6.E+00
Total 6.E+00 15 0,0054 15 2.E+03 15
a: Significant at the 95% level; b: Not significant at the 95% level; DF: Degrees of freedom; SS: Sum of squares; MS: Mean square; F: Ratio
176
177
179
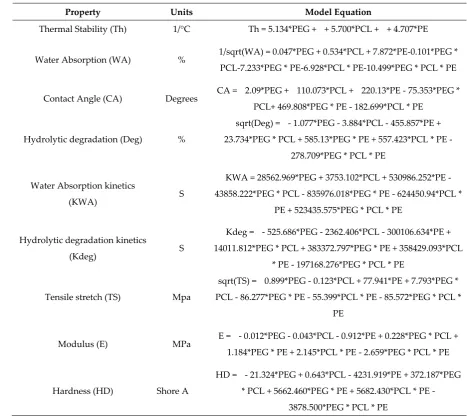
Special cubic models were fit for each response for the regression models. Model regression based on
180
the least square was used to compute the coefficients. The equations are presented in Table 2. Models
181
were evaluated by ANOVA.
182
Table 4. Equations representing the models for the five properties studied
183
Property Units Model Equation
Thermal Stability (Th) 1/°C Th = 5.134*PEG + + 5.700*PCL + + 4.707*PE
Water Absorption (WA) % 1/sqrt(WA) = 0.047*PEG + 0.534*PCL + 7.872*PE-0.101*PEG * PCL-7.233*PEG * PE-6.928*PCL * PE-10.499*PEG * PCL * PE
Contact Angle (CA) Degrees CA = 2.09*PEG + 110.073*PCL + 220.13*PE - 75.353*PEG * PCL+ 469.808*PEG * PE - 182.699*PCL * PE
Hydrolytic degradation (Deg) %
sqrt(Deg) = - 1.077*PEG - 3.884*PCL - 455.857*PE + 23.734*PEG * PCL + 585.13*PEG * PE + 557.423*PCL * PE -
278.709*PEG * PCL * PE
Water Absorption kinetics
(KWA) S
KWA = 28562.969*PEG + 3753.102*PCL + 530986.252*PE - 43858.222*PEG * PCL - 835976.018*PEG * PE - 624450.94*PCL *
PE + 523435.575*PEG * PCL * PE
Hydrolytic degradation kinetics
(Kdeg) S
Kdeg = - 525.686*PEG - 2362.406*PCL - 300106.634*PE + 14011.812*PEG * PCL + 383372.797*PEG * PE + 358429.093*PCL
* PE - 197168.276*PEG * PCL * PE
Tensile stretch (TS) Mpa
sqrt(TS) = 0.899*PEG - 0.123*PCL + 77.941*PE + 7.793*PEG * PCL - 86.277*PEG * PE - 55.399*PCL * PE - 85.572*PEG * PCL *
PE
Modulus (E) MPa E = - 0.012*PEG - 0.043*PCL - 0.912*PE + 0.228*PEG * PCL + 1.184*PEG * PE + 2.145*PCL * PE - 2.659*PEG * PCL * PE
Hardness (HD) Shore A
HD = - 21.324*PEG + 0.643*PCL - 4231.919*PE + 372.187*PEG * PCL + 5662.460*PEG * PE + 5682.430*PCL * PE -
3878.500*PEG * PCL * PE
184
The ANOVA test for the fitted models (see Table 1,Table 2 and Table 3) demonstrated that the model
185
sum of squares was statistically significant at a 95% probability level (P-value < 0.05) for the five
186
properties studied. In addition, lack of fit was not significant at a 95% probability level (P-value >
187
0.05) in all cases. Both, the model sum of square and lack of fit indicated that the models were
188
adequate. Likewise, fit statistics confirmed good fitting for all properties. According with Olivato,
189
J.B. et al. (2013), an R-square value higher than 0.7 suggests a good fit with the experimental data[10].
190
In this study, all R-square values were over 0.96. Additionally, the adjusted R-square value was
191
calculated to be greater than 0.94, demonstrating that the variations in the responses can be explained
192
by the relationships obtained. In the same way, the predicted R-square value determined how well
193
the model predicts response. Here, the values were over 0.8. Therefore, the models obtained herein
194
are promising for the evaluation of the structure-property relationship of polyurethanes.
195
Thermal analysis was carried out by thermogravimetric analysis (TGA). Curves were
197
normalized with respect to initial sample weight. First derivate was calculated for each sample.
198
Figure 2 shows the thermal degradation of some polymers from different mixtures. According with
199
Sui et. al. (2013) polyurethanes degrade in three steps starting with the hard segments between 250
200
to 320 °C, following by two components produced after the cleavage of the urethane linkages. First
201
the smaller molecular weight compounds linked to urethane bond like the crosslinker and second,
202
the soft segment chains [14].
203
204
Figure 2A, compare the behavior of samples from the extremes and middle of the experimental
205
design. S1 seems to describe one degradation stage, while S6 and S14 shows two stages. S16 shows
206
and increase on second stage compared with S6. Studying the curves from the PCL extreme points
207
(Figure 2B), they present a shoulder around 350°C. S1 have the largest amount of PE which produce
208
PUs with large amount of hard segment. This could produce an overlapping of the three stages due
209
to the large amount of PUs pyrolysis. S3 and S4 have lower levels of PE and they show better defined
210
shoulders suggesting that the shoulder is the degradation of the hard segments.
211
212
Figure 2. Derivate thermogravimetric curves for different polyol blend combinations A) Comparison
213
of DTGs from the extremes and middle design points. B) DTGs of PCL extreme design points, C)
214
DTGs of middle design points and D) PEG extreme design points.
215
By other hand, Figure 2C shows the behavior of the samples from the middle design points. Here,
216
two separate stages could be identified. First one associated to the hard segment degradation and the
217
second over the 400°C with the soft segment. Figure 2D showed the behavior of the PEG extreme
218
points. The same two stages could be observed, however second stages had largest area under the
219
curve than curves in Figure 2C, it could suggest that higher amount of hard segment was produced
220
in the middle points than the PEG extreme points. Additionally, related the crosslinking density with
221
the thermal stability and PCL extreme points present the highest content of hard segment.
222
223
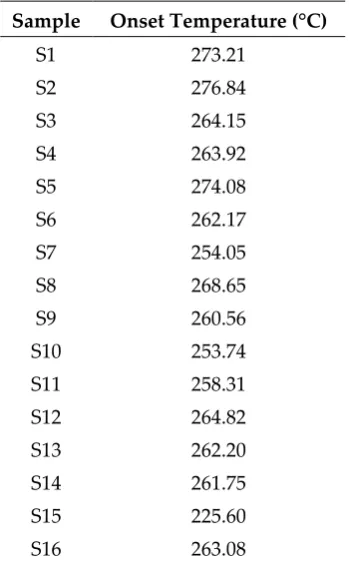
About the onset temperatures (Table 5), PUs were thermally stabled under 220°C. Polymers with
224
higher amount of PE showed higher values. Additionally, polymers with higher concentrations of
225
PCL had higher temperatures. The addition of PEG reduced the onset temperatures. Król et. al. (2007)
226
described that polyesterurethanes are more stable thermally than polyetherurethanes; ester bonds
undergo decomposition within 390 to 440°C while ether decompose between 360-400 °C [15]. Our
228
finding confirms that behavior, PCL is a polyester and the PCL extreme points described the higher
229
values of onset temperature.
230
Table 5. Onset temperatures of PUs synthetized
231
Sample Onset Temperature (°C)
S1 273.21 S2 276.84 S3 264.15 S4 263.92 S5 274.08 S6 262.17 S7 254.05 S8 268.65 S9 260.56 S10 253.74 S11 258.31 S12 264.82 S13 262.20 S14 261.75 S15 225.60 S16 263.08
To study the effect of composition, regression of onset temperatures was carried out. However, poor
232
fitting properties were obtained (R-square = 0.64). So, the absolute normalized area under the curve
233
(nAUC) of the DTG curves were fitted as approach to index the thermal stability in terms of polyol
234
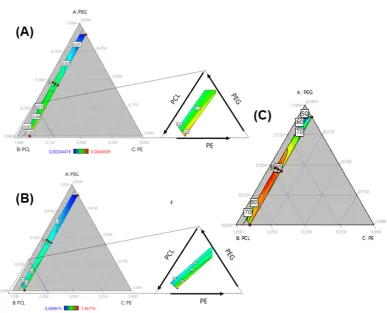
composition. Ternary plot (Figure 4A) showed a red area with the increase of PCL and PE. Addition
235
of PEG to the mixture reduce the nAUC. This is accorded with the behavior of onset temperature
236
suggesting that higher values of nAUC represents higher thermal stability and lower values
237
represents lower thermal stability of polyurethanes. ANOVA (Table 2) showed a linear model where
238
the terms of each component were significant. Standardized coefficients showed that the influence of
239
composition follow PE>PCL>PEG.
240
2.4. Hydrophilicity and hydrolytic degradation
241
To evaluate the hydrophilicity, water absorption and water contact angle were evaluated. Figure
242
2A shows the contour plot of water absorption (non-transformed). There is an increased swelling
243
with an increase in the PEG fraction. Conversely, swelling decreased with the amount of PCL. PEG
244
and PCL are hydrophilic and hydrophobic polyols, respectively. These responses indicated that the
245
nature of the polyols regulated the swelling response. Despite the urethane bonds, polyurethane
246
chains conserve the structure of polyols, influencing the polyurethane response. Here, we observed
247
how the incorporation of PEG increased the water absorption to levels that were approximately 30%
248
due to the hydrophilic nature, and the largest amount of PCL showed the lowest swelling.
249
250
Likewise, an increase in the PE fraction involved a reduction in swelling. PE added to the hard
251
segment and increased the crosslinking of the chains, causing a reduction on chains mobility[2]. In
252
Figure 2A, we observe that increasing PE reduced the red area, or swelling, while a lower amount of
253
PE showed a higher percentage of water absorption. According with Shoaib et al. (2018), a higher
254
value of water absorption indicated an amorphous nature and decreased intermolecular density. In
255
PUs, the hard segments acted as a twisting path for the diffusion of water molecules and the
absorption increased with an increase in chain flexibility, providing more space for water molecules
257
[6].
258
259
Checking the ANOVA results (see Table 1), the triple interaction (PEG*PCL*PE) was significant and
260
confirmed by the standard regression coefficients, in which the triple interaction coefficient was the
261
highest between the significant terms (β = 7.65). That is consistent with the analysis of the ternary plot
262
(Figure 3A), concluding that the bulk composition of polyurethanes regulated the water absorption.
263
264
Figure 3. Ternary contour plots of (A) Water absorption, (B) Hydrolytic degradation, (C) Contact
265
angle. Red dots are design points, arrows indicated the increasing of each component.
266
267
Contact angle measures the affinity between the solvent and material surface. Here, water was used
268
as a solvent; therefore, wettability was evaluated. Lower angles indicate enhanced wettability. The
269
surface is considered hydrophobic when contact angles are over 90° [16]. In Figure 3B, we can observe
270
a decrease in the contact angle with an increase in the PEG content. The hydrophilic nature of PEG
271
improved the interaction between water and PUs. Conversely, a rise in PCL increased the angle due
272
to hydrophobic character of the polyol. PCL concentrations over 75% produced hydrophobic
273
surfaces. However, this property did not change with the PE concentration. According to the ANOVA
274
of regression model (Table 1. ANOVA test of model regression for water absorption, contact angle
275
and hydrolytic degradation), there is a significant effect for PEG*PCL interaction. This interaction
276
had a negative impact on response, agreeing with the standard regression coefficients (β=-61.04)
277
producing polymers with lower contact angle. Water contact angle is a surface property, and the
278
model suggests that the soft segments of PUs regulate this property.
279
280
Hydrolytic degradation occurred after swelling. Water enters the PU matrix. Chain scission takes
281
place through hydrolysis, in which water molecules may facilitate the cleavage of some bonds such
282
as urethane and esters[17]. As mentioned previously, this property is related to the swelling of water
283
and hydrophilicity [18]. Thus, in Figure 3C, the largest amount of PCL had the lowest weight loss.
Yet, increasing PEG content represents an increase in degradation. Hydrophilicity increased with
285
contact angle, and a rise in water uptake resulted in an enhancement of degradation. However, there
286
is a yellow to red area with the growth of PE at highest PEG concentrations. The addition of
287
crosslinkers increased the urethane bond content, which has a hydrolysable ester bond. Furthermore,
288
PEG is hydrolysable and produces carboxylic and hydroxyl groups on its surface, making it highly
289
hydrophilic and increasing the rate of degradation[6]. This suggests that swelling and hard segment
290
content synergistically enhance degradation. As such, the lowest degradation rate occurred with
291
higher concentrations of PCL, where the swelling is reduced. Model regression ANOVA showed that
292
the triple effect (Table 1) was significant. It suggested that three components regulate degradation.
293
As with water absorption, hydrolytic degradation is another bulk property that is directly regulated
294
by its composition.
295
296
To observe the behavior of water absorption and hydrolytic degradation with time. Area under
297
the curve was calculated for each sample. The effect of polyol blend composition on kinetics was
298
studied by a model regression. Our findings confirm the behavior described for water absorption and
299
hydrolytic degradation for 48h. In the first case (See Figure 4B) PUs with large swelling had largest
300
area under the curve. In ternary plot there is a red area at greater values of PEG and lower of PE like
301
Figure (WA). In the case of hydrolytic degradation described behavior like hydrolytic degradation at
302
48h (See Figure 4C). Lowest values of area under the curve relates with lowest weight loss. ANOVA
303
(Table 2) shows that triple interaction is significant for both responses. Triple interaction had a
304
negative influence in water absorption kinetics while have positive effect on degradation kinetics.
305
306
Finally, measurement of area under the curve of those kinetics could be understood as the hydrolytic
307
stability of PUs and. Higher values of area under of water absorption kinetics are related with largest
308
values area under the curve of degradation kinetics indicating that PUs are affected by hydrolytic
309
degradation.
311
Figure 4. Ternary contour plot of (A) thermal stability, (B) Water absorption kinetics and (C)
312
hydrolytic degradation kinetics
313
2.5. Mechanical properties
314
The mechanical performance of PUs can be regulated by hard segment content or polyol
315
characteristics, such as molecular weight and hydroxyl index. In Figure 5A, tensile strength and
316
modulus are presented. In both cases, properties rise with the amount of PCL and PE. As mentioned
317
previously, PE increases the hard segment content in Pus, modulating mechanical response. The hard
318
segment interacts through hydrogen bonds, generating crosslinking[19], and a reduction in chain
319
movement could enhance mechanical performance. Increasing the PE concentration promoted
320
urethane linkage formation. Additionally, PE functionality of 4 allowed for the formation of a
321
branched structure. It can reticulate the structure and increase crosslinking. PE influence can be
322
observed by the standard regression coefficient, β=102.12 and β=0.19 for tensile strength and
323
modulus, respectively. Despite this, the hydroxyl index was higher for PEG, suggesting that the
324
molecular weight of the monomer can regulate mechanical behavior as well. In Figure 5B, modulus
325
is improved by PCL addition. Here, the molecular weight of PCL was greater than that of PEG,
326
creating larger chains and increasing the crosslinking.
327
328
Additionally, model regression ANOVA showed a significant triple interaction (Table 3), suggesting
329
that both mechanical properties are mediated by all three components
331
Figure 5. Ternary contour plots of (A) Tensile stretch and (B) Modulus as function of PEG, PCL and
332
PE mass fraction
333
Hardness of PUs was evaluated too. Increase of PE concentration represent a rise of hardness and
334
largest values was reached at high concentration of PCL (Figure 5C). ANOVA (See Table 3) showed
335
significant triple interaction with a positive influence, according with standardized coefficients. Our
336
results suggest that, in addition to crosslinking, the molecular weight of polyols mediated in
337
mechanical properties.
338
339
Regression of elongation at break was carried out, but it showed low fitting properties (R-square
340
=0.35). This property was not analyzed in this work.
341
2.6. Model Validation
342
Our models were validated by the check point method (See Table 7). The response of check
343
materials in properties like water absorption, hydrolytic degradation, tensile strength and contact
344
angle was carried out in Design Expert 10 based on the confidence intervals at 95%. The response of
345
the materials adjusts to the model’s responses. It suggests that our models can predict the structure
346
properties relationship of polyurethanes based on the composition of the polyol blend and can be
347
used to navigate the design space and optimize desired properties.
348
4. Materials and Methods
349
4.1. Materials
350
The following reagents were used for PUs synthesis: polycaprolactone diol (PCL) with average
351
molecular weight of Mn~2000, isophorone diisocyanate (IPDI), N,N-dimethylformamide (DMF) were
352
purshased from Sigma-Aldrich, USA. Polyethylene glycol (PEG, Mn~1000) was from Merck KGaA,
Germany, and pentaerythritol (PE) was from Alfa Aesar, England. For characteruization analysis,
354
phosphate buffer saline (PBS) was purshased from VWR, USA.
355
4.2. Polyurethane synthesis
356
Polyurethanes were synthetized via a two-step polymerization. PCL and PEG were used as
357
polyols, PE and IPDI as crosslinkers and NCO as a source, respectively.
358
359
Each weighted polyol was preheated at 110°C and mixed with 10 ml of DMF, and then IPDI, in a
360
NCO/OH ratio of 1, was added and allowed to react for 15 min at 70°C with agitation. In parallel, PE
361
was diluted in 10 mL of DMF at 110°C with agitation. Next, the PE solution was added to the
362
prepolymer. A vacuum was applied to remove air. Finally, each polymer was poured in cylindrical
363
molds and cured at 110°C for 12 hours. After the curing period, PUs were washed in a 50% (v/v)
364
ethanol-water solution for 1 hour to remove mold, released and dried at 80°C.
365
4.3. Design of experiment
366
In this work, the effect of the polyol blend composition on several properties of polyurethanes was
367
studied through mixture design. PCL, PEG and PE composition, in mass fraction, was varied in the
368
ranges shown in Table 1
369
Table 6: Variation ranges in experimental design for polyurethanes synthesis
370
Blend Component Lower Limit* Upper Limit*
PEG 0.000 0.900 PCL 0.000 0.900 PE 0.050 0.100
*Mass fraction
371
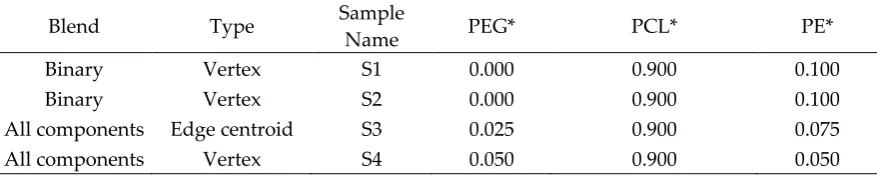
A special cubic model was used to study linear, double and triple effects and the sum of
372
composition must be one. Table 7 describes the blend and point type, as well as the composition of
373
each material. Each property studied was measured three times, and the average value was used for
374
the model regression. Data analysis and model regression were carried out in Design Expert V10.
375
Before regression, outliners and influential point were evaluated by Cook’s distance and DFFITS test.
376
Box-Cox distribution was evaluated, and recommended transformation was applied. Model
377
regression was made by minimum least squares. Analysis of variance (ANOVA) was carried out for
378
model validation and the evaluation of significant terms.
379
380
381
382
383
Table 7. Description of mixture design for the study of polyol blend composition
384
All components Vertex S5 0.050 0.900 0.050 All components Edge centroid S6 0.450 0.450 0.100 All components Edge centroid S7 0.450 0.450 0.100 All components Edge centroid S8 0.450 0.450 0.100 All components Overall centroid S9 0.463 0.463 0.075 All components Edge centroid S10 0.475 0.475 0.050 All components Edge centroid S11 0.475 0.475 0.050 Binary Vertex S12 0.900 0.000 0.100 Binary Vertex S13 0.900 0.000 0.100 Binary Vertex S14 0.900 0.000 0.100 All components Edge centroid S15 0.900 0.025 0.075 All components Vertex S16 0.900 0.050 0.050 Check Point C1 0.571 0.33 0.099 Check Point C2 0.815 0.091 0.094 Check Point C3 0.796 0.107 0.097
*Mass fraction
385
4.4. Polyurethanes characterization
386
The chemical structure of PUs was evaluated by Fourier-transform infrared spectroscopy (FTIR)
387
from a range of 400 cm-1 to 4000 cm-1 in a Nicolet iS10 (Thermo Scientific, USA). The experiment was
388
setup in 32 scans and resolution of 4.
389
390
Thermal behavior was studied by thermogravimetric assay in a TGA/DSC 1 (Mettler Toledo, USA).
391
The method consisted of two steps. The first was at 105°C for 1 hour to remove water and solvent
392
traces. The second a dynamic heating from 105 to 600°C at rate of 10°C/min. Tests were carried out
393
under nitrogen atmosphere with a flow of 180 ml/min. Curve were normalized respect to initial
394
weight of the sample. DTGs, onset temperatures and normalized area under de curve were calculated
395
using the STARe software provided by the TGA/DSC1 supplier.
396
397
Contact angle was determined using a MobileDrop (KRÜSS GmbH, Germany) with distilled water
398
at room temperature and the sessile drop method. At least 3 measurements per polymer were taken,
399
and the average of those was reported.
400
401
Water absorption was evaluated by soaking each sample in triplicate in 1 ml of PBS 1x. Samples were
402
incubated for 48 hours at 37°C. Swelling was calculated with the initial weight (Wo) and the final
403
weight (Ws), according with the following equation:
404
405
%Water absorption=(Ws-Wo)/Wo, (1)
406
Hydrolytic degradation was analyzed by soaking the samples in PBS 1x as before. After 48 hours,
407
samples were dried in an oven at 80°C until a constant weight was reached. The dried weight was
408
recorded (Wi), and degradation was calculated as follows:
409
410
%Degradation=(Wo-Wi)/Wo, (2)
411
Kinetics of water absorption and hydrolytic degradation were carried out, following the method
412
described for each property. At least 5 time points were recorded in interval of 120 hours. Curve were
413
analyzed based on the %Water absorption and %Degradation. Under the curve area was calculated
414
using the trapezoid method.
The mechanical properties of PUs were assessed by uniaxial tensile test with EZ-XL universal test
417
machine (Shimadzu, Japan) at 10 mm/min. Ultimate stress, modulus and elongation at break were
418
recorded. Shore A hardness was measured using a shore A durometer. 10 measurements were
419
recorded for each sample and the average was used for the model regression.
420
5. Conclusions
421
Application of the mixture design allowed for us to set mathematic relationships for the effects
422
of polyol blend composition on properties of polyurethane obtained from PEG and PCL (polyols), PE
423
(crosslinker) and IPDI (isocyanate). An ANOVA test and fit statistics suggested a good fit and
424
predictive potential with those equations.
425
426
Water absorption, hydrolytic degradation and contact angle responses were regulated by the polar
427
nature of polyols and crosslinker concentrations. However, tensile strength, modulus and hardness
428
could be mediated by other characteristics of polyols such as molecular weight and hydroxyl value,
429
together with the crosslinker concentration. From a statistical perspective, a triple interaction
430
(PEG*PCL*PE) with water absorption, hydrolytic degradation, tensile strength, hardness and
431
modulus was significant, but not for contact angle, where the PEG*PCL interaction was significant.
432
This suggests that bulk properties such as those in the first group are regulated by three components
433
composition, but contact angle, as a surface property, is mediated by the polyol nature. Thermal
434
stability was evaluated by area under the curve of the DTGs. It shows that increase of PCL and PE
435
improved stability. Additionally, hydrolytic stability was evaluated by area under the curve from the
436
water absorption and hydrolytic degradation kinetics where similar behavior was observed. Showing
437
that are under the curve could be used to transform curve identifying effects of variables.
438
439
To conclude, this methodology allowed for a better understanding of the structure-property
440
relationship through a mathematic model, identifying the main effects of the polyol blend
441
composition on the final properties. These models look promising for optimization to design a
442
polyurethane with target properties, and the mixture design could extrapolate to other components
443
such as isocyanate and the NCO/OH ratio.
444
Author Contributions: Conceptualization, Said Arévalo-Alquichire, Manuel Valero and Luis Diaz.;
445
Methodology, Said Arévalo-Alquichire and Maria Morales-Gonzalez; Software, Said Arévalo-Alquichire.;
446
Validation, Said Alquichire; Formal Analysis, Said Alquichire; Investigation, Said
Arévalo-447
Alquichire and Maria Morales-Gonzalez.; Resources, Manuel Valero; Writing-Original Draft Preparation, Said
448
Arévalo-Alquichire; Visualization, Said Arévalo-Alquichire; Supervision, Manuel Valero and Luis Diaz; Project
449
Administration, Manuel Valero; Funding Acquisition, Manuel Valero
450
Funding: This research was funded by Universidad de La Sabana under grant ING-176-2016
451
Acknowledgments: The authors would like to thank to Dr. Maria Ximena Quintanilla for access to Design Expert
452
V.10. SAA thanks Dr. Edgar Benitez for advice regarding statistical analysis and experimental design and to the
453
department of science, technology and innovation COLCIENCIAS from Colombia for the funds for doctoral
454
training under the grant, 727-2015.
455
Conflicts of Interest: The authors declare no conflict of interest.
456
457
References
458
[1] S. Arévalo-Alquichire and M. Valero, “Castor Oil Polyurethanes as Biomaterials,” in Elastomers, N.
459
Çankaya, Ed. Rijeka: InTech, 2017, pp. 137–157.
460
[2] P. Jutrzenka Trzebiatowska, A. Santamaria Echart, T. Calvo Correas, A. Eceiza, and J. Datta, “The
461
changes of crosslink density of polyurethanes synthesised with using recycled component. Chemical
462
structure and mechanical properties investigations,” Prog. Org. Coatings, vol. 115, pp. 41–48, Feb. 2018.
463
Gelatin-Sheathed Coaxially Structured Nanofibers,” Langmuir, vol. 31, no. 47, pp. 12993–13002, Dec.
465
2015.
466
[4] M. Bil, J. Ryszkowska, P. Woźniak, K. J. Kurzydłowski, and M. Lewandowska-Szumieł, “Optimization
467
of the structure of polyurethanes for bone tissue engineering applications,” Acta Biomater., vol. 6, no. 7,
468
pp. 2501–2510, Jul. 2010.
469
[5] Y. L. Uscátegui, S. J. Arévalo-Alquichire, J. A. Gómez-Tejedor, A. Vallés-Lluch, L. E. Díaz, and M. F.
470
Valero, “Polyurethane-based bioadhesive synthesized from polyols derived from castor oil (Ricinus
471
communis) and low concentration of chitosan,” J. Mater. Res., vol. 32, no. 19, pp. 3699–3711, Oct. 2017.
472
[6] M. Shoaib, A. Bahadur, A. Saeed, M. S. ur Rahman, and M. M. Naseer, “Biocompatible, pH-responsive,
473
and biodegradable polyurethanes as smart anti-cancer drug delivery carriers,” React. Funct. Polym., vol.
474
127, pp. 153–160, Jun. 2018.
475
[7] L. Eriksson, E. Johansson, and C. Wikström, “Mixture design—design generation, PLS analysis, and
476
model usage,” Chemom. Intell. Lab. Syst., vol. 43, no. 1–2, pp. 1–24, Sep. 1998.
477
[8] M. A. Bezerra, R. E. Santelli, E. P. Oliveira, L. S. Villar, and L. A. Escaleira, “Response surface
478
methodology (RSM) as a tool for optimization in analytical chemistry,” Talanta, vol. 76, no. 5, pp. 965–
479
977, Sep. 2008.
480
[9] A. Khaskhoussi, L. Calabrese, H. Bouhamed, A. Kamoun, E. Proverbio, and J. Bouaziz, “Mixture design
481
approach to optimize the performance of TiO2 modified zirconia/alumina sintered ceramics,” Mater.
482
Des., vol. 137, pp. 1–8, Jan. 2018.
483
[10] J. B. Olivato, M. M. Nobrega, C. M. O. Müller, M. A. Shirai, F. Yamashita, and M. V. E. Grossmann,
484
“Mixture design applied for the study of the tartaric acid effect on starch/polyester films,” Carbohydr.
485
Polym., vol. 92, no. 2, pp. 1705–1710, Feb. 2013.
486
[11] L. Abolghasemi Fakhri, B. Ghanbarzadeh, J. Dehghannya, F. Abbasi, and H. Ranjbar, “Optimization of
487
mechanical and color properties of polystyrene/nanoclay/nano ZnO based nanocomposite packaging
488
sheet using response surface methodology,” Food Packag. Shelf Life, vol. 17, pp. 11–24, Sep. 2018.
489
[12] H. Li et al., “Preparation and characterization of bio-polyol and bio-based flexible polyurethane foams
490
from fast pyrolysis of wheat straw,” Ind. Crops Prod., vol. 103, pp. 64–72, Sep. 2017.
491
[13] D. Zhao, G. Wang, and M. Wang, “Investigation of the effect of foaming process parameters on
492
expanded thermoplastic polyurethane bead foams properties using response surface methodology,” J.
493
Appl. Polym. Sci., vol. 135, no. 25, p. 46327, Jul. 2018.
494
[14] H. L. Sui, X. Y. Liu, F. C. Zhong, X. Y. Li, and X. Ju, “A study of radiation effects on polyester urethane
495
using two-dimensional correlation analysis based on thermogravimetric data,” Polym. Degrad. Stab., vol.
496
98, no. 1, pp. 255–260, Jan. 2013.
497
[15] P. Król and B. Pilch-Pitera, “Phase structure and thermal stability of crosslinked polyurethane
498
elastomers based on well-defined prepolymers,” J. Appl. Polym. Sci., vol. 104, no. 3, pp. 1464–1474, May
499
2007.
500
[16] N. L. Tai, R. Adhikari, R. Shanks, P. Halley, and B. Adhikari, “Flexible starch-polyurethane films: Effect
501
of mixed macrodiol polyurethane ionomers on physicochemical characteristics and hydrophobicity,”
502
Carbohydr. Polym., vol. 197, pp. 312–325, Oct. 2018.
503
[17] S. Arévalo-Alquichire et al., “Polyurethanes from modified castor oil and chitosan,” J. Elastomers Plast.,
504
vol. 0, no. 0, p. 009524431772957, Sep. 2017.
505
[18] L. Romero-Azogil, E. Benito, A. Martínez de Ilarduya, M. G. García-Martín, and J. A. Galbis, “Hydrolytic
506
[19] M. F. Valero Valdivieso, “Degradación In-Vitro de Mezclas de Poliuretano Termoplástico Y Almidón
508
Modificado,” Polímeros Ciência e Tecnol., vol. 23, no. 3, pp. 373–382, 2013.
509
510