Data Descriptor
Data and code for analyzing performance of QHY
CMOS cameras
Hari Nandakumar1,∗and Shailesh Srivastava1*
1 2 3 4 5 6 7 8
1 DepartmentofPhysics,SriSathyaSaiInstituteofHigherLearning,PrasanthiNilayam,AP,515134India
* Correspondence:[email protected]
s
Abstract: Expensive cameras meant for research applications are usually characterized by the manufacturers and detailed specifications [1] are available for them. Suppliers of inexpensive
cameras usually do not provide such detailed information about their cameras. This data set provides the acquisition speed and noise characteristics acquired from a monochrome 1.2 megapixel CMOS camera, the QHY5L-II M [2]. The source code provided along with this data set [3]can also
be used to acquire similar data for other QHY cameras. This enables the use of such cost-effective cameras for other scientific applications in other fields, beyond the designed use in Astronomy.
Keywords: Imaging; CMOS; camera; SNR; noise; performance.
Data Set License: CC0 9
1. Introduction 10
A wide variety of inexpensive imaging devices are currently available. Prices have been driven 11
down by the economies of scale brought about by the proliferation of mass-market devices like 12
smartphones. But imaging devices for scientific purposes remain expensive. In many cases, the key 13
differentiator between mass-market devices and the devices meant for scientific applications are the 14
detailed data-sheets of the latter [1]. The code and data presented here can be used to evaluate an 15
entire range of cameras from a low-cost manufacturer, and use appropriate models for applications 16
beyond Astronomy, for example in biomedical imaging. 17
2. Results 18
Our data was used to circumvent the lack of documentation about the camera and in the software 19
development kit (SDK) [4]. We could evaluate the QHY5L-II M camera’s performance characteristics. 20
This helps us to design parameters like exposure control, binning and averaging for using this camera 21
in biomedical imaging. Our code can be used to similarly evaluate other camera models from the 22
same manufacturer. 23
3. Discussion 24
Data and code is presented for the following measurements: 25
1. Mean and standard deviation of a single pixel of the camera under dark conditions, averaging over 26
10 or 100 frames, and with frame-to-frame subtraction. 27
2. Mean and standard deviation of a single pixel of the camera under illuminated conditions, 28
averaging over 10 or 100 frames, and with frame-to-frame subtraction. 29
3. Mean and standard deviation of all pixels of the camera under dark conditions, with and without 30
averaging and frame-to-frame subtraction. 31
4. Mean and standard deviation of all pixels of the camera under illuminated conditions, with and 32
without averaging and frame-to-frame subtraction. 33
5. Mean and standard deviation of all pixels of the camera under dark conditions, binning 2x2 pixels, 34
with and without averaging over 10 frames, and with frame-to-frame subtraction. 35
6. Mean and standard deviation of all pixels of the camera under illuminated conditions, binning 2x2 36
pixels, with and without averaging over 10 frames, and with frame-to-frame subtraction. 37
Data and code are also presented for miscellaneous other useful demonstration applications which 38
can be used for checking brightness of illumination, measuring the number of frames per second (fps) 39
delivered by the camera for various resolutions, checking for periodic noise in the images delivered 40
by the camera using 2D Fourier transforms, and so on. Documentation is also presented along with 41
the raw data as Supplementary Material, indicating which section of code produced which data. 42
Our data was used to circumvent the lack of documentation in the software development kit 43
(SDK). For example, the CONTROL_GAIN parameter accepts integer values, but our data (data 44
file 058) shows that only values 0-99 are actually used by the SDK to change camera gain. This is 45
illustrated in Figure 1. 46
Figure 1. Camera output pixelvalues as a function of control gain SDK parameter under constant
illumination. We see that negative values and values over 99 do not result in linear gain control.
Similarly, we learnt from the frames per second data (data file 002) that the exposure time 47
parameter is in microseconds. We also find the performance limits of this camera - a maximum of 48
200 fps for smaller resolutions, and a maximum of 29 fps for full resolution captures. This is brought 49
out in Table 1. 50
Table 1.Frames per second (FPS) captured by the QHY5L-II M camera. Complete raw data is available
in data file 002.
Resolution CONTROL_EXPOSURE FPS Comments
32x24 1 200 This is the fastest FPS.
320x240 1 200
320x240 10000 99 Indicates CONTROL_EXPOSURE is inµsec.
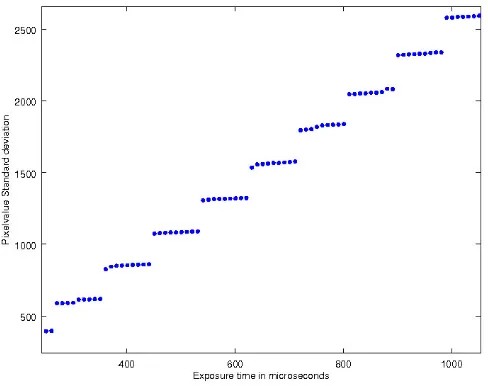
Varying exposure time under constant illumination (data file 022) showed us that the SDK varies 51
exposure only in multiples of around 100 microseconds. This is illustrated in Figure 2, where we see 52
the pixel standard deviation clearly following a step function. 53
Figure 2.Camera output pixel value standard deviation as a function of CONTROL_EXPOSURE SDK
parameter under constant illumination. The step function response indicates that the actual exposure time varies only in steps of around 100 microseconds.
From our data, we could compare the worst case signal to noise ratio (SNR) of unaveraged, 54
averaged and averaged binned frames captured using this camera with gamma and gain set to unity, 55
to the expected SNR of the internal 12-bit analog to digital converter (ADC). The apparent reduction 56
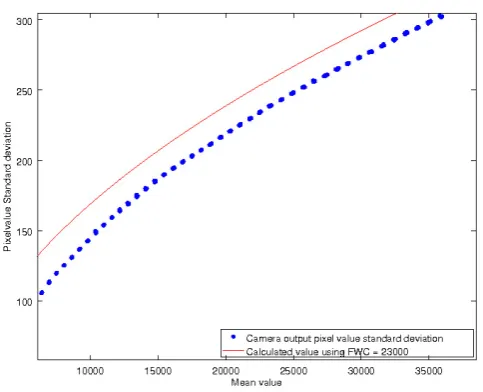
in standard deviations of pixel values for high intensity readings in our data (data file 022) are due to 57
saturation of some parts of the image. The full well capacity (FWC) of the sensor used in this camera 58
is not mentioned in the official specification sheet [4]. Since the noise in images captured varies as 59
(FWC) as for an ideal detector [5], we looked for the scale factor which would make our noise data 60
follow such a square-root curve. We found that a curve corresponding to a FWC of 23000 is a close 61
approximation. This is shown in Figure 3. Averaging images over n frames (data file 022) improves 62
SNR by a factor of (n) as expected. We obtained similar performance figures by testing a second 63
Figure 3. Camera output pixel value standard deviation as a function of mean pixel value under constant illumination. The calculated curve indicates that the equivalent full well capacity (FWC) is close to 23000.
65 4. Materials and Methods
66 Image capture and analysis code was written in C++ using the QHY Linux software
67 development kit (SDK) [4] and the OpenCV library [6]. Natural light was used for the illuminated 68 tests, using the camera without any lens, pointed at a paper diffuser, and dark tests were done by
69 covering the camera with its black nose cap. Our code can be used to test cameras using the EMVA
70 1288 specification [7] also.
71 SupplementaryMaterials:Therawdataacquiredduringthisstudyisavailableonline, and the code is available
72 athttps://github.com/hn-88/QHYCameratests.
73 Acknowledgments: The authors express their gratitude to Bhagawan Sri Sathya Sai Baba, the founder
74 Chancellorof their institution, for help andguidance throughout thiswork. The authors’ department has
75 infrastructurefundingfromDepartmentofScienceandTechnology,GovernmentofIndia(DST)(FIST2012-2017
76 SR/FST/PSI-172/2012).
77 ConflictsofInterest:Theauthorsdeclarenoconflictofinterest.
78 Abbreviations
79 The following abbreviations are used in this manuscript:
80
81 SDK: Software Development Kit
82 CMOS: Complementary Metal-oxide Semiconductor
83 EMVA: European Machine Vision Association
84 Bibliography
1. FLIR Integrated Imaging Solutions, Inc.. Camera Sensors Review. https://www.ptgrey.com/
85
camera-sensor-review, 2018. [Online; accessed 11-February-2018]. 86
2. QHYCCD Corporation. QHY5L-II camera. http://www.qhyccd.com/QHY5L-II.html, 2017. [Online;
87
accessed 3-November-2017]. 88
3. Nandakumar, H. Code to test QHY cameras. Mean, Standard Deviation, Dark Noise, etc. https://github.
89
4. QHYCCD Corporation. SDK for QHYCCD cameras. https://github.com/qhyccd-lzr/QHYCCD_Linux, 91
2017. [Online; accessed 3-November-2017]. 92
5. Gereon Huttmann, P.K.; Birngruber, R. Linear OCT Systems. InOptical Coherence Tomography: Technology
93
and Applications, Second Edition; Drexler, W.; Fujimoto, J.G., Eds.; Springer International Publishing: 94
Switzerland, 2015; p. 395. 95
6. Bradski, G. et al. The OpenCV Library. https://github.com/opencv/opencv, 2017. [Online; accessed
96
3-November-2017]. 97
7. European Machine Vision Association. EMVA 1288 Standard for Measurement and Presentation of
98
Specifications for Machine Vision Sensors and Cameras. http://www.emva.org/standards-technology/
99