Pro
fi
ling ellagic acid content: The importance of form and ascorbic
acid levels
David J. Williams
a,⁎
, David Edwards
a, Sharon Pun
a, Mridusmita Chaliha
a, Yasmina Sultanbawa
b aAgri-Science Queensland, Department of Agriculture, Fisheries and Forestry (DAFF), PO Box 156, Archerfield BC, Queensland, 4108, AustraliabQueensland Alliance for Agriculture and Food Innovation (QAAFI),The University of Queensland, Brisbane, Australia
a b s t r a c t
a r t i c l e i n f o
Article history:
Received 23 May 2014 Accepted 8 September 2014 Available online 16 September 2014
Keywords:
Ellagic acid Ascorbic acid Dehydroascorbic acid Strawberry Boysenberry Kakadu plum fruit
As the importance of plant-based antioxidants to human health becomes clearer there is a rapidly expanding search for rich sources of these compounds. Much attention is currently focussed on the antioxidant potential of ellagic acid (EA). Making assessment difficult is that EA occurs in different forms: free EA, EA glycosides and polymeric ellagitannins. The overall structure of these forms has a pronounced effect on their antioxidant efficiency and is responsible for widely differing reactivity, solubility and hence bioavailability properties. Often associated with EA is vitamin C which also contributes to the plant foods total antioxidant activity. Previous studies have suggested that ascorbic acid may have protective effects on the polyphenol content of plants. With a view to gaining evidence that the bioactive forms of vitamin C influence EA content, several fruits with a range of EA and vitamin C contents were examined. To facilitate a more detailed assessment of the selected fruits antiox-idant potential the relative proportions of EA forms were also determined. In strawberries and boysenberries EA content was predominantly in the polymeric form (21% and 12% free EA plus EA glycoside vs total EA levels for strawberry and boysenberry respectively), while in Kakadu plum it was mainly in the free form (70% of total EA). An increasing percentage of dehydroascorbic acid (9 to 14% of total vitamin C) indicating enhanced transfor-mation of ascorbic acid to its oxidative degradation product together with stable free EA levels (≈950 mg/100 g DW) over the 4 month frozen storage period for the Kakadu plum samples are consistent with a possible protective effect of EA by ascorbic acid.
Crown Copyright © 2014 Published by Elsevier Ltd. All rights reserved.
1. Introduction
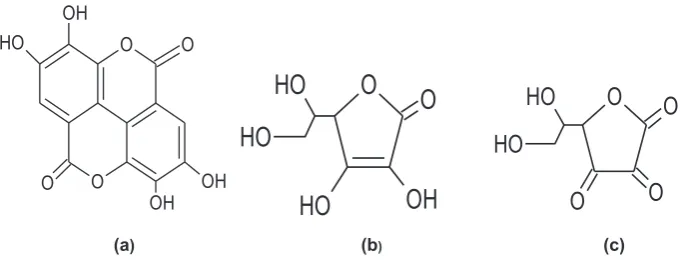
Consumption of fruits and vegetables is known to lower the risk of several diseases, including cardiovascular diseases, cancer and stroke (Willett, 2002). Such health benefits are mainly attributed to the content of antioxidant compounds most notably vitamin C and poly-phenols including gallic and ellagic acids as well as related compounds (reviewed byCrozier, Jaganath, & Clifford, 2009). As the importance of these antioxidants to human health becomes clearer there is a rapidly expanding search for rich plant sources of these compounds with much attention focussing on the antioxidant potential of ellagic acid (EA). Ellagic acid together with the bioactive forms of vitamin C (ascorbic, AA and dehydroascorbic acids, DHAA) (Fig. 1), possess double bonds with an associated electron deficiency which is highly reactive to free radicals from molecular oxygen (Atkinson, Nestby, Ford & Dodds, 2005).
Ellagic acid occurs in plants in different forms: as free EA (Fig. 1a), glycosylated via its hydroxyl groups or, most commonly, as complex polymers esterified with a sugar known as ellagitannins (ETs) (Clifford & Scalbert, 2000). Investigations that focus on identifying EA forms in fruit and other plant materials are made more difficult by the fact that these forms differ widely in solubility and reactivity. Hydrolysis of EA glycosides or water-soluble ETs with acids or bases yields an unstable intermediate which spontaneously rearranges to the water-insoluble EA. This reaction has been utilised for the detection and quantification of total EA, with content being expressed as EA equivalents after acid hydrolysis (Rommel & Wrolstad, 1993). The complete disappearance on acid hydrolysis but not alkaline hydrolysis provides a means of identifying and quantifying EA glycosides (Aaby, Skrede, & Wrolstad, 2005). To determine free EA content separately, the measurement is simply performed before the hydrolysis step. The final analytic for measuring all forms is free EA (Fig. 1a).
Few studies have reported a thorough EA characterisation of fruit with most focussing on total EA content (Atkinson et al., 2005; Maas, Wang, & Galletta, 1991; Rommel & Wrolstad, 1993) or free EA levels (Amakura, Okada, Tsuji, & Tonogai, 2000; Konczak, Maillot, & Dalar, 2014). Data obtained from several studies that investigated more fully the EA forms present led to the conclusion that most plant EA was Abbreviations:AA, ascorbic acid; DHAA, dehydroascorbic acid; DPPH,
2,2-diphenyl-1-picrylhydrazyl; EA, ellagic acid; ET, ellagitannins; FRAP, ferric reducing ability of plasma; ORAC, oxygen radical absorbance capacity.
⁎ Corresponding author. Tel.: +61 7 32766041; fax: +61 7 32166591.
E-mail address:[email protected](D.J. Williams).
http://dx.doi.org/10.1016/j.foodres.2014.09.003
0963-9969/Crown Copyright © 2014 Published by Elsevier Ltd. All rights reserved.
Contents lists available atScienceDirect
Food Research International
present in the ET form with only a small proportion, if any, occurring in the free form or as EA glycosides (Aaby et al., 2005; da Silva Pinto, Lajolo, & Genovese, 2008; Zafrilla, Ferreres, & Tomas-Barberan, 2001) Other re-ports found the proportion of the free form to be highly variable with some fruit exceeding 50% of the total EA content (Rommel & Wrolstad, 1993; Wada & Ou, 2002).
The antioxidant efficiency of the EA forms is believed to be correlat-ed with their degree of hydroxylation (Pfundstein et al., 2010).Zafrilla et al. (2001)reported that in red raspberries EA had the highest antiox-idant activity among isolated EA glycosides, whereas an unidentified polymeric derivative showed an antioxidant capacity double that of EA. The authors stated this was expected as this latter compound possesses a far larger number of phenolic hydroxyls per molecule. Confirmation of the presence of two major ETs (sum represented 81% of the total ETs in raspberries) was provided byGasperotti, Masuero, Vrhovsek, Guella & Mattivi (2010). There are also differences in bio-availability between EA forms, although these differences are the focus of numerous current investigations (reviewed inCrozier et al., 2009). Variations in bioavailability of the EA forms could explain the discrepan-cies observed betweenin vivoandin vitroexperiments, with thein vitro results often failing to match thefindings of thein vivostudies (see Tomás-Barberán & Andrés-Lacueva, 2009; Tomás-Barberán, Somoza, & Finley, 2009). The form in which EA occurs may be as important to its antioxidant activity and bioavailability as the actual content of EA. Accu-rate quantification of free EA, EA glycosides and ETs present in fruit, fruit-based beverages and supplements is a necessary pre-requisite for any study that evaluates their antioxidant properties and their subse-quent effect on human health.
A possible link between EA and AA was recognised byAtkinson et al. (2005)when they increased these natural antioxidants in strawberries by applying enhanced radiation during growth. To date, literature reports that focus on whether the levels of endogenous bioactive forms of vitamin C (AA, and DHAA) may influence EA content in plant foods are very rare. This seems surprising as several studies showed that added AA prevented the oxidation of polyphenols even during al-kaline hydrolysis (Nardini et al., 2002). A recent study byOszmianski, Wojdyło, and Kolniak (2009)demonstrated that AA was a very useful EA oxidation protector during the storage and thawing of frozen straw-berries. As AA is easily oxidisable and is very often considered a terminal oxidant (Halliwell, 1994), EA may well be protected by AA in plants.
Although several studies have measured free EA content and even more have quantified the bioactive forms of vitamin C in plant foods, there are, to the best of our knowledge, no studies have been carried out to gain direct evidence that AA has a protective effect on EA levels. To achieve this aim as well as gaining knowledge about the importance of structure (form) in defining its antioxidant efficiency and bioavail-ability we measured the free, EA glycoside and total EA content together with bioactive vitamin C levels in three fruit types. The determination of pH, titratable acidity and moisture of the fruit extracts completed the necessary characterisation. Samples of Kakadu plum fruit known to
contain high levels of free EA and AA were selected for examination whilst undergoing frozen storage (Konczak et al., 2009, 2014). This ap-proach should add to our understanding of the complex mechanisms associated with the different EA forms and their respective contribution to overall antioxidant properties and bioavailability.
2. Materials and methods
2.1. Reagents
EA, DL-homocysteine, AA and DHAA were purchased from Sigma-Aldrich Inc. (Sydney, NSW, Australia). The HPLC-grade methanol, formic acid, 2-propanol and acetonitrile were purchased from Thermo Fisher Scientific (Melbourne, Victoria, Australia). All other chemicals were of analytical grade and purchased from Thermo Fisher Scientific.
2.2. Plant materials and preparation
Recently harvested (Spring, September 2013) strawberries (Fragaria ananassacv. Camarosa) were obtained from a commercial grower located to the south of Brisbane, Qld, Australia, frozen and stored in polyethylene bags at−20 °C.
Frozen packs (1 kg) of New Zealand grown boysenberries (Rubus ursinus x idaeus) were obtained from Harvestime Qld. (Yatala, Qld, Australia). Samples were kept frozen (−20 °C) until processing and analysis.
Commercially available whole Kakadu plum fruit (Terminalia ferdinandiana) were obtained from Australian Produce Company (Brisbane, Qld,Australia). Individual whole fruit (harvested in late Au-tumn, May 2012) were placed in polyethylene bags, vacuum sealed and blast frozen then stored at−20 °C.
Sub-samples (comprising≈20 individual fruit for all three fruit types) for EA and vitamin C analysis were freeze-dried,finely ground (including the seed for the Kakadu plum whole fruit samples) in a Retsch MM301 cryomill (Retsch GmbH, Haan, Germany) and subse-quently stored at−20 °C.
For the storage trial samples of Kakadu plum were stored whole at−20 °C. After 0, 1, 4, 5 and 8 months storage samples (comprising≈10 individual fruit for each individual sampling date) were manually de-seeded, freeze-dried andfinely ground prior to determining moisture, free EA and vitamin C content.
2.3. Moisture content of the freeze-dried fruit powders
The moisture content of the freeze-dried fruit powders was deter-mined according toAOAC (1995), official method 964.22. Briefly, in triplicate, each sample (1 g) was dried for approximately 16 h to a con-stant weight at 70 °C in a vacuum oven (W. C. Heraeus GmbH, Hanau, Germany). The difference between initial weight and constant weight
(a
)(b
)(c)
O
O
H
OH
O
O
H
O
H
O
O
O
O
O
H
O
H
O
O
OH
OH
O
OH
O
H
O
after drying was taken as moisture lost and hence moisture content of the sample.
2.4. Extraction of free EA
An extracting solution of 100 % methanol was used for these assays. The extraction method adopted was based on that ofAmakura et al. (2000)without the acidified methanol assisted solid-phase extraction (SPE) clean-up.
Triplicate samples (~ 0.2 g for the boysenberry and strawberry freeze-dried powders; ~0.1 g for Kakadu plum powders) were accurate-ly weighed into a 15 ml centrifuge tube and 3 ml or 5 ml (for the Kakadu plum samples) (3 × extractions) of the extracting solvent were added and sonicated for 10 min. The mixture was centrifuged (≈3220×g, 5 min at 20 °C) and the clear supernatant was transferred to a 10 ml or 25 ml (for the Kakadu plum samples) volumetricflask and made to volume with extracting solvent. About 1.5 ml of the diluted supernatant wasfiltered through a 0.45μm syringefilter into a HPLC vial, N2was introduced, capped and stored at−80 °C prior to analysis.
The concentration of the extracted EA was monitored by HPLC-DAD as detailed below (Section 2.6).
2.5. Extraction and hydrolysis of EA glycosides and ETs
Alkaline hydrolysis of the solvent extracts and subsequent quantifi -cation was performed according toAaby et al. (2005). Briefly, an aliquot (2 ml) of the free ellagic–methanol extract was dissolved in 10 ml 10% (w/v) KOH in a 20 ml screw-top test tube with a Teflon-lined cap and allowed to react at room temperature for 90 min. The extracts were adjusted to pH 5.5 with 2 N HCl. After hydrolysis the vial contents were transferred into a 10 ml volumetricflask and made up to the mark with 100 % methanol. About 1.5 ml of this solution wasfiltered through a 0.45μm syringefilter into a HPLC vial, N2was introduced, capped and stored at−80 °C prior to analysis.
Acid hydrolysis of the methanol extracts and subsequent quantifi ca-tion was performed according toda Silva Pinto et al. (2008). Briefly, an aliquot (2 ml) of the free ellagic–methanol extract was pipetted into 5 ml Reacti-Therm (Thermo Fisher Scientific, Bellefonte, PA, USA) vial containing a stirring slug. The methanol was evaporated under nitrogen before 2 ml of 2 N tri-fluoroacetic acid (TFA) was added to the vial which was then capped and mixed to dissolve the residue. The vial was placed into the Reacti-Therm heater/stirrer unit (Thermo Fisher Scientific, Bellefonte, PA, USA) where the contents were hydrolysed at 120 °C for 120 min. After hydrolysis the vial was cooled and the con-tents transferred into a 5 ml volumetricflask with 100 % methanol. About 1.5 ml of this solution wasfiltered through a 0.45μm syringefilter into a HPLC vial, N2was introduced, capped and stored at−80 °C prior to analysis.
2.6. HPLC-DAD analysis
The HPLC conditions used in this study were based on those outlined byGasperotti et al. (2010).
Samples were analysed using a Shimadzu (Shimadzu Co., Kyoto, Japan) HPLC system consisting of a system controller (SCL-10Avp), degasser (DCU-14A), pump (LC-10ATvp), auto-sampler (SIL-20ATHT), column oven (CTO-10Avp) and a photo-diode array detector (SPD-M10Avp) linked to Labsolutions software. Optimal separation of the EA was achieved on a reversed-phase C18Acclaim, 3μm, 4.6 × 150 mm column (Thermo Fisher Scientific) with matching guard col-umn. Both columns were maintained at 30 °C. Optimal separation re-quired gradient elution. The solvents consisted of (A) 0.1% formic acid (v/v) in water and (B) 0.1% formic acid (v/v) in acetonitrile. The gradient began isocratically with 15% solvent B for 1 min, followed by a linear gradient from 15 to 20% B for 20 min, from 20 to 90% B for 2 min and then isocratic for 4 min. Re-equilibration steps over 8 min returned
the system to initial conditions. Aflow rate of 1.5 ml/min was main-tained for each step.
An aliquot of 10μl of sample was injected. Spectra for all wave-lengths between 220 and 600 nm were recorded by the photodiode array detector. The different EA forms were identified by their chro-matographic behaviour, UV spectra and response to acidic and alkaline hydrolysis. Quantification (before and after acid–alkaline hydrolysis) was performed by comparison to EA commercial standards prepared in 100% methanol. An estimation of ET levels was calculated by subtracting the content of the other two forms from the total EA mea-surement. EA content for all three forms was expressed as mg/g DW (dry weight) after moisture determinations.
2.7. Extraction of AA and DHAA
To determine both forms of vitamin C a two-step subtraction ap-proach was employed. Firstly, the content of AA was determined by HPLC with UV-detection of the original sample to obtain the initial con-centration. Reduction of DHAA to AA was performed by the addition of DL-homocysteine. After this conversion the samples were analysed for total vitamin C again by HPLC with UV-detection. The methods for sam-ple preparation and HPLC analysis adopted in this study were based on those outlined byDennison, Brawley, and Hunter (1981),Gökmen, Kahraman, Demir, and Acar (2000)andHoare, Jones, and Lindsay (1993).
AA was determined by weighing 100 mg of the freeze-dried fruit sample into a 15 ml centrifuge tube followed by 10 ml of extracting solution consisting of 1% (m/v) citric acid containing 0.05% (m/v) ethylenediamine tetra-acetic acid (EDTA) as the disodium salt in 50% (v/v) methanol. After being shaken by hand the tubes were centrifuged at≈3220×gfor 5 min and 1 ml of clear supernatant was added to a 50 ml volumetricflask and made to volume with extracting solution. An aliquot of this solution wasfiltered through a 0.45μm syringefilter prior to HPLC analysis.
Total vitamin C was determined by weighing 100 mg of sample followed by adding 4 ml of 0.8% DL-homocysteine (m/v) to a 15 ml cen-trifuge tube and adjusting the pH to 7 with 45% K2HPO4(m/v) solution. After 15 min the solution was made to approximately 10 ml with extracting solution. Again the tubes were mixed and centrifuged at
≈3220 ×gfor 5 min and 1 ml of clear supernatant was added to a 50 ml volumetricflask and made to volume with extracting solution. An aliquot of this solution wasfiltered through a 0.45μm syringefilter prior to HPLC analysis.
2.8. Determination of ascorbic and dehydroascorbic acid content
Separation of AA was achieved with a Waters (Waters Associates, Rydalmere, NSW, Australia) HPLC system consisting of a pump (LC-515), auto-sampler (Plus 717), UV-visible detector (model 481) linked to Varian Star software (Version 6.41). A 5μm Supelcosil LC-NH2, 4.6 × 250 mm column (Supelco, Sigma Aldrich, Sydney, NSW, Australia) efficiently separated ascorbic acid isocratically by using a solution of 40:60 (v/v) methanol: 0.25% K2HPO4(m/v) buffer (adjusted to pH 3.5 with phosphoric acid) as mobile phase. Theflow rate was 1.0 ml/min. An aliquot of 10μL of sample was injected and the AA peak was detected at 245 nm and identified and quantified by comparison to a commercial standard.
2.9. Determination of pH and titratable acidity
The pH and titratable acidity (TA) of the fruit purees were measured according to the method outlined byFredrich (2005). After defrosting the frozen sample in a microwave (as recommended byOszmianski et al., 2009to reduce drip loss and the possibility of chemical deteriora-tion) the fruit was macerated in a Black & Decker BMC 100 blender (Black & Decker, Mooroolbark, Vic, Australia) at 100 rpm for 2 min. A TPS labCHEM-pH meter (TPS Pty Ltd, Springwood, Qld, Australia) was used for the determination of pH values of these macerated fruit sam-ples. Following centrifugation (≈3220×g, 5 min) 5 ml of supernatant was pipetted into a beaker with 50 ml of distilled water. A stirrer bar was added and the solution was titrated with 0.01 N NaOH solution to an end-point of pH 8.2. The titratable acidity in terms of standard acid was calculated using the equation given below:
TA gð =100mlÞ ¼ð ÞVð ÞNððmeq1000:Þwtð Þv:Þð100Þ
V–volume of NaOH used (ml); N - normality of NaOH used; meq. wt.– milliequivalent weight of the standard; and v–sample volume (ml). Citric acid was selected as the standard acid for these calculations after consulting Table G2.1.1 inFredrich (2005).
2.10. Statistical analysis
All analyses were run in triplicate and were expressed as means ± standard deviation (SD). Statistical analysis was performed by using the XLSTAT-Pro software package version 7.0 (XLSTAT Addinsoft, Paris, France). Differences between means werefirst analysed by the ANOVA test and then least significant differences (LSD) test (pb0.05).
3. Results and discussion
3.1. Free, EA glycoside and total EA content
The level of free EA was 4.8 ± 0.1 mg/100 g DW in strawberries, 5.5 ± 0.6 mg/100 g DW in boysenberries and 620.6 ± 2.2 mg/100 g DW in the Kakadu plum (Table 2). Our result for the free EA content of strawberries (cv. Camarosa) is lower than the value reported by da Silva Pinto et al. (2008)who also analysed the same cultivar (22 mg/100 g DW). Similarly the value of 14.7 mg/100 g DW for fresh strawberry (cultivar not stated) as given byAmakura et al. (2000)was also higher than our result. On the other hand our result was slightly higher than those reported byAaby et al. (2005)of 2.2 and 3.3 mg/100 g DW for the strawberry cultivars Puget Reliance and Totem, respectively. Note for ease of comparison the fresh weight of some of these results were converted to dry weight on the application of the water content of 90.95% obtained after consultation of the USDA National Nutrient Database (2013).
Until recently there had been limited information on EA content of Kakadu plum.Cunningham, Garnett, Gorman, Courtney, and Boehme (2009)stated that the fruit ofT. ferdinandianais a good source of EA without providing values. However, a comprehensive recent investiga-tion measured the levels of free EA in 567 samples of Kakadu plum fruit obtained from 45 growth sites across northern Australia (Konczak et al., 2014). They reported levels from 3050 to 14020 mg/100 g DW, much higher than the content shown in our extracts. In characterising the phenolic compounds present in the fruit of relatedTerminaliaspecies, Pfundstein et al. (2010)reported a range of 228–410 mg/100 g DW for the free EA content, only slightly lower than our values for T. ferdinandiana. Discrepancies between research groups in measuring EA are not entirely unexpected as most have noted that EA values (even for the same plant material) vary markedly, the differences being attributed to the type and pH of the extracting solvents used (da Silva Pinto et al., 2008;Häkkinen & Törrönen, 2000). Irrespective
of these differences, values presented prove that Kakadu plum fruit is a very rich source of this important phytochemical.
The lack of commercially available standards makes the differentia-tion of EA glycosides from the more complex form, ETs, problematic. Possible glycoside compounds in the fruit extracts were identified from their chromatographic behaviour, UV spectra and response to acidic and alkaline hydrolysis and then quantified as EA (Aaby et al., 2005; Zafrilla et al., 2001). This probably accounts for there being only limited data on the levels of EA glycosides present in fruit. For the straw-berry and boysenstraw-berry extracts the glycoside contents were two to three times order of magnitude higher than the free EA (Table 2). This agrees closely with thefindings ofAaby et al. (2005)in their study of strawberries particularly so for the glycoside level shown by the cultivar Puget. To date there seems to be no reports outlining the levels of EA glycosides in boysenberries. In the 2002 investigation, Wada and Ou did not individually quantify EA glycosides or ETs but combined them as total EA. We failed to detect any EA glycosides in the Kakadu plum fruit which seems at variance with the values reported on related Terminaliaspecies fruit byPfundstein et al. (2010). The EA glycoside levels measured in their study ranged between 20–232 mg/100 g DW although it was substantially lower than that of the free form.
The value of 420 mg/100 g DW reported byda Silva Pinto et al. (2008)for total EA content of the strawberry cultivar Camarosa is far higher than the value for the same cultivar found in our study (64.3 ± 2.0 mg/100 g DW;Table 2). However, it falls within the range (43–464 mg/100 g DW) previously reported byMaas et al. (1991)for the total EA content of strawberry fruit samples taken from 36 cultivars. Again the moisture conversion factor obtained from theUSDA National Nutrient Database (2013)was applied.
A literature value of total EA content of boysenberries (496 mg/100 g DW) reported byWada and Ou (2002)is a lot higher than that measured in our study (168.4 ± 3.0 mg/100 g DW) but there seems to be confusion with the actual units expressed in their report.
In the current study the total EA content of the Kakadu plum extracts was a very high 879.6 ± 15.6 mg/100 g DW (Table 2).
Although all EA forms are believed to function as bothin vitroand in vivoantioxidants their efficiency depends on their chemical structure, most notably the number of available hydroxyl groups (Pfundstein et al., 2010).Zafrilla et al. (2001)showed that free EA had the highest antioxidant activity (measured by its ability to neutralize the free radical 2,2-diphenyl-1-picrylhydrazyl, DPPH) of all the EA glycosides isolated from red raspberry. They attributed this to the fact that free EA has two dihydroxyl groups (Fig. 1a) compared to the isolated EA glycosides which have only one. An unidentified polymeric derivative (possibly an ET) showed double the activity of the free EA, probably due to a larger number of hydroxyls per molecule. ThePfundstein et al. (2010)study intoTerminaliafruit phenolics (not includingT. ferdinandiana) con-firmed that the molar antioxidant capacity of the identified EA and ETs depended in part, on the number of hydroxyl groups per molecule. ETs (several containing up to 16 hydroxyl groups per molecule) possessed the highest activities as judged by the ORAC (Oxygen Radical Absorbance Capacity) and FRAP (Ferric Reducing Ability of Plasma) as-says but interestingly, EA itself was ranked highly on a molar basis by the DPPH assay. The authors speculated this was due to the compara-tively higher density of hydroxyls within the smaller EA molecule. This observation prompted the authors to state that a precise prediction of antioxidant activity based on the number of hydroxyls alone is not feasible.
As well as acting as an antioxidant, the absorption of EA formsin vivo is also influenced by their chemical structure. The degree of hydroxyl-ation, glycosylation and polymerisation and hence solubility are consid-ered to be the major factors (Karakaya, 2004). In a 2000 review, Clifford and Scalbert suggested that EA monomers were probably better absorbed than the high molecular weight ETs. However, several recent studies have indicated that the mechanisms of absorption of EA and ETs are more complex (Borges et al., 2007; Mertens-Talcott, Jilma-Stohlawetz, Rios, Hingorani, & Derendorf, 2006). To date there are no definitive studies on the absorption of free EA, EA glycosides and ETs in humans. Not even the absorption of the free form has been demonstrated unequivocally (Landete, 2011). Recent research has sug-gested that some ETs are hydrolysedin vivoto yield EA which can then be absorbed and metabolised (reviewed byCrozier et al., 2009). Other studies (Espin et al., 2007; Seeram et al., 2006) have indicated that ETs are metabolised in the colon by the gutflora to produce urolithins which are subsequently absorbed. Although studies on the bioavailabil-ity of EA and ETs gained from these studies have increased our under-standing, there is a vital need for further animal and human trials to demonstrate the operating mechanisms of this complex process. Regardless of this paucity of data, it is clear that EA structure will have a significant effect on its bioavailability.
3.2. AA and DHAA content
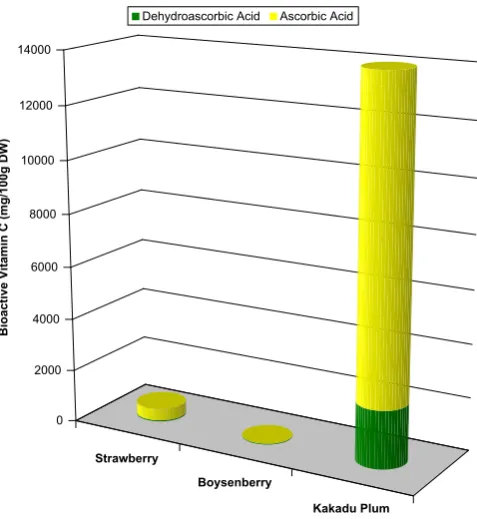
The AA contents were 459 ± 21, 6 ± 2 and 11863 ± 1895 mg/100 g DW in strawberries, boysenberries and the Kakadu plum, respectively. Our values for strawberries were lower than those reported by Chebrolu, Jayaprakasha, Yoo, Jifon, and Patil (2012). Odriozola-Serrano, Hernández-Jover, and Martín-Belloso (2007)and the USDA National Nutrient Database quote 540, 586 and 650 mg/100 g DW, re-spectively, butGökmen et al. (2000)found only 320 mg/100 g DW. We used 90.95% from theUSDA National Nutrient Database (2013)for the water content of strawberries to convert results to a dry weight basis. The strawberry cultivar was not specified in the above mentioned investigations. Our value for the frozen boysenberries was much lower than the 21 mg/100 g DW given in the USDA National Nutrient Database (2013), converted to a dry weight basis by the use of a water content of 85.95%. Our Kakadu plum AA content was higher than that published earlier (Konczak et al., 2009) of 7252 mg/100 g DW, but was in the range of 50–32220 mg/100 g DW (average value of 15190) reported in a more recent study of 567 samples of Kakadu plum (Konczak et al., 2014).
The DHAA values were 44 ± 14, 31 ± 3 and 2175 ± 598 mg/100 g DW for the strawberry, boysenberry and Kakadu plum extracts, respec-tively. DHAA usually represents about 10–20% of the total vitamin C content in fruit (Borowski, Szajdek, Borowska, Ciska, & Zielinski, 2008) and is considered to be thefirst compound produced in the oxidative deg-radation of AA (Chang, Lin, Chang, & Liu, 2006). In the present study, DHAA represented 9.5, 83 and 23.2% of the vitamin C (AA + DHAA) content in strawberries, boysenberries and Kakadu plum (Table 1; Fig. 2). The contribution of DHAA reported in the literature (Gökmen et al., 2000; Odriozola-Serrano et al., 2007) for fresh strawberries (cultivars not specified) of 16.0 and 15.9%, respectively, is similar to our result. The value for boysenberries suggests protracted processing and storage leading to a high transformation of AA to DHAA. On the basis of the high levels of DHAA in Kakadu plum, i.e.N20%, and the elevated levels of AA and EA, further examination was warranted.
3.3. Storage trial of whole Kakadu plum fruit
The results of free EA content and the bioactive vitamin C levels of frozen whole Kakadu plum fruit are shown inTable 3. The initial con-centrations of both phytochemicals in this storage trial are consistent with values for the unstored samples (Tables 1 and 2). The values in the stored samples were marginally higher possibly because the seed was removed prior to analysis in the storage trial.
There were only minor changes in free EA content during frozen storage–in fact storage for nearlyfive months was necessary before there was a significant increase (Table 3). This was a surprising result because most researchers have reported almost immediate increases due to hydrolysis of the fruit ETs (Aaby, Wrolstad, Ekeberg, & Skrede, 2007; Oszmianski et al., 2009). The latter study reported higher free EA levels in frozen strawberries than those present in the fresh sample. A similar effect was noted byAaby et al. (2007)during the frozen stor-age of strawberry puree and room temperature storstor-age of raspberry jam byZafrilla et al. (2001). InterestinglyOszmianski et al. (2009)observed no significant increase in free EA content for 6 month frozen stored strawberries if a pre-freezing treatment that included AA was applied. Also it should be remembered that the high total acid content in con-junction with the low pH exhibited by the Kakadu plum fruit extracts would provide an environment conducive to the hydrolysis of the ETs even under frozen storage conditions (Table 1).
A significant immediate increase (pb0.05) in DHAA indicates con-siderable oxidation of AA to DHAA with storage. AA has often been added to fruit preserves mainly for its pronounced antioxidant proper-ties but not to products where its reaction with anthocyanins leads to a loss of colour and quality (Oszmianski et al., 2009). As well, its addition has been shown to be useful as a polyphenol oxidation protector during the freezing, storage and thawing processes of a variety of food products (Oszmianski et al., 2009). Several investigations measuring polyphenol content have suggested that added AA prevented the oxidation of these compounds even during alkaline hydrolysis (Nardini et al., 2002). Ourfindings and the knowledge that AA is easily oxidisable and is often considered a terminal oxidant (Halliwell, 1994), suggest a protective effect of Kakadu plum EA by its elevated AA levels. It would also appear that this effect may even reduce the rate of hydrolysis of the ETs to free EA during frozen storage.
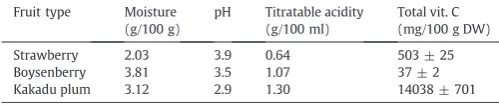
Table 1
Moisture (g/100 g), pH, titratable acidity (g/100 ml) and total vitamin C (mg/100 g DW) content of freeze-dried fruit powders. Values are means ± SD of triplicate analyses.
Fruit type Moisture (g/100 g)
pH Titratable acidity (g/100 ml)
Total vit. C (mg/100 g DW)
4. Conclusions
The overall structural diversity of the different forms of EA has a pronounced effect on its antioxidant efficiency, solubility and hence its bioavailability. In this study the profile of these EA forms were determined obtaining much needed data that enables a more reliable interpretation of the plants’antioxidant capacity. Consistent with previ-ous results the strawberry cultivar Camarosa contained mostly water soluble ETs. In frozen boysenberries we detected also mainly ETs with only minor amounts of free EA and EA glycosides. In Kakadu plum the major form was free EA and the levels were very high with no EA glyco-sides being detected. Based on studies to date and our results, fruit containing elevated levels of ETs and perhaps to a lesser extent free EA should possess high antioxidant activity. This would apply to straw-berries and boysenstraw-berries and even though it possesses a smaller pro-portion of ETs than the other tested fruit, the very high free EA levels should bestow on the fruit of this plant exceptional antioxidant proper-ties. Afinding already noted in the investigations ofKonczak et al. (2009)andNetzel, Netzel, Tian, Schwartz, and Konczak (2007). Howev-er it should be emphasised before claiming any antioxidant-related benefit of dietary EA a more in-depth understanding of the bioavailabil-ity of the different forms is critical.
Kakadu plum fruit also has far higher concentrations of AA and DHAA than the other fruits tested. Ourfindings for the frozen stored Kakadu plum samples are consistent with a possible protective effect of EA by ascorbic acid. This is one of thefirst studies that offers evidence of this effect by the plants’endogenous ascorbic acid on its EA based compounds. Further research on other fruit or vegetables with high free EA and vitamin C contents may strengthen this argument.
Acknowledgements
This work was supported by the Rural Industries Research and Development Corporation (RIRDC, Australia).
The authors wish to thank the following people for providing informed comments and suggestions: Emeritus Professor Christa Critchley, Dr. Izabela Konczak of Food & Nutritional Sciences, CSIRO, Dr. Heather Smyth, Queensland Alliance for Agriculture and Food Innovation (QAAFI), The University of Queensland, as well as a large contribution to proof-reading the manuscript.
References
Aaby, K., Skrede, G., & Wrolstad, R. E. (2005).Phenolic composition and antioxidant activ-ities inflesh and achenes of strawberries (Fragaria anananassa).Journal of Agricultural and Food Chemistry,53, 4032–4040.
Aaby, K., Wrolstad, R. E., Ekeberg, D., & Skrede, G. (2007).Polyphenol composition and antioxidant activity in strawberry purees: impact of achene level and storage. Journal of Agricultural and Food Chemistry,55, 5156–5166.
Amakura, Y., Okada, M., Tsuji, S., & Tonogai, Y. (2000).High-performance liquid chro-matographic determination with photodiode array detection of ellagic acid in fresh and processed fruits.Journal of Chromatography A,896, 87–93.
Association of Official Analytical Chemists (1995).Official Methods of AOAC International Official Method 964.22 (14th ed.). Arlington, VA: Association of Official Analytical Chemists International.
Atkinson, C. J., Nestby, R., Ford, Y. Y., & Dodds, P. A. A. (2005).Enhancing beneficial anti-oxidants in fruits: A plant physiological perspective.BioFactors,23, 229–234.
Borges, G., Roowi, S., Rouanet, J. M., Duthie, G. G., Lean, M. E. J., & Crozier, A. (2007).The bioavailability of raspberry anthocyanins and ellagitannins in rats.Molecular Nutrition & Food Research,51, 714–725.
Borowski, J., Szajdek, A., Borowska, E. J., Ciska, E., & Zielinski, H. (2008).Content of selected bioactive components and antioxidant properties of broccoli (Brassica oleracea L.). European Food Research and Technology,226, 459–465.
Chang, C. H., Lin, H. Y., Chang, C. Y., & Liu, Y. C. (2006).Comparisons on the antioxidant properties of fresh, freeze-dried and hot-air-dried tomatoes.Journal of Food Engineering,77, 478–485.
Chebrolu, K. K., Jayaprakasha, G. K., Yoo, K. S., Jifon, J. L., & Patil, B.S. (2012).An improved sample preparation method for quantification of ascorbic acid and dehydroascorbic acid by HPLC.Food Science and Technology,47, 443–449.
Clifford, M. N., & Scalbert, A. (2000).Ellagitannins–native, occurrence and dietary burden.Journal of the Science of Food and Agriculture,80, 1118–1125.
Crozier, A., Jaganath, I. B., & Clifford, M. N. (2009).Dietary phenolics: chemistry, bioavail-ability and effects on health.Natural Product Reports,26, 1001–1043.
Cunningham, A. B., Garnett, S., Gorman, J., Courtney, K., & Boehme, D. (2009). Eco-enterprises andTerminalia ferdinandiana:“Best laid plans”and Australian policy lessons.Economic Botany,63, 16–28.
da Silva Pinto, M., Lajolo, F. M., & Genovese, M. I. (2008).Bioactive compounds and quantification of total ellagic acid in strawberries.Food Chemistry,107, 1629–1635.
Dennison, D. B., Brawley, T. G., & Hunter, G. L. K. (1981).Rapid high-performance liquid chromatographic determination of ascorbic acid and combined ascorbic-dehydroascorbic acid in beverages.Journal of Agricultural and Food Chemistry,29, 927–929.
Espin, J. C., González-Barrio, R., Cerdá, B., López-Bote, C., Rey, A. I., & Tomás-Barberán, F. A. (2007).Iberian pig as a model to clarify obscure points in the bioavailability and Strawberry
Boysenberry
Kakadu Plum 0
2000 4000 6000 8000 10000 12000 14000
Bioactive Vitamin C (mg/100g DW)
Dehydroascorbic Acid Ascorbic Acid
Fig. 2.Total vitamin C (ascorbic, AA + dehydroascorbic acid, DHAA) content in straw-berries, boysenberries and whole Kakadu plum fruit. Values used are means of triplicate analyses.
Table 2
Concentration of EA forms (mg/100 g DW) in freeze-dried fruit powders. Values are means ± SD of triplicate analyses.
Fruit type Free EA (mg/100 g DW)
EA glycosides (mg/100 g DW)
Ellagitannins* (mg/100 g DW)
Free EA/Total EA (%)
Strawberry 4.8 ± 0.1 8.8 ± 0.7 50.7 ± 1.7 7.4 Boysenberry 5.5 ± 0.6 15.3 ± 0.3 147.6 ± 3.2 3.2 Kakadu plum
fruit
620.7 ± 2.2 N.D. 259.1 ± 12.9 70.6
N.D.–not detected.
*Calculated by subtracting the free and EA glycoside levels from the total EA content measured after acid hydrolysis.
Table 3
The free EA content (mg/100 g DW) and the % contribution of DHAA to total vitamin C levels of freezer stored whole (without seed) Kakadu plum fruit. Values are means ± SD of triplicate analyses.
Storage (months) Free EA content (mg/100 g DW)
DHAA/Total vitamin C (%)
0 980 ± 10a 9.4 ± 0.5a
1 972 ± 11a 12.8 ± 0.6b
4 922 ± 12b
13.8 ± 0.5b
5 1048 ± 17c
17.2 ± 0.6c
8 1069 ± 12c
17.0 ± 0.2c
metabolism of ellagitannins in humans.Journal of Agricultural and Food Chemistry,55, 10476–10485.
Fredrich, J. E. (2005).Titratable activity of acid tastants. In R. E. Wrolstad (Eds.),Handbook of food analytical chemistry(pp. 343–349). New Jersey: John Wiley & Sons.
Furuuchi, R., Yokoyama, T., Watanabe, Y., & Hirayama, M. (2011).Identification and quantification of short oligomeric proanthocyandins and other polyphenols in boy-senberry seeds and juice.Journal of Agricultural and Food Chemistry,59, 3738–3746.
Gasperotti, M., Masuero, D., Vrhovsek, U., Guella, G., & Mattivi, F. (2010).Profiling and accurate quantification ofRubus ellagitanninsand ellagic acid conjugates using direct UPLC-Q-TOF HDMS and HPLC-DAD analysis.Journal of Agricultural and Food Chemistry,58, 4602–4616.
Gökmen, V., Kahraman, N., Demir, N., & Acar, J. (2000).Enzymatically validated liquid chromatographic method for the determination of ascorbic and dehydroascorbic acids in fruit and vegetables.Journal of Chromatography A,881, 309–316.
Häkkinen, S. H., & Törrönen, A.R. (2000).Content offlavonols and selected phenolic acids in strawberries andVaccinuimspecies: Influence of cultivar, cultivation site and technique.Food Research International,33, 517–524.
Halliwell, B. (1994).Free radicals and antioxidants: a personal view.Nutrition Reviews,52, 253–265.
Hoare, M., Jones, S., & Lindsay, J. (1993).Total vitamin C analysis of orange juice.Food Australia,45, 341–345.
Karakaya, S. (2004).Bioavailability of phenolic compounds.Critical Reviews in Food Science and Nutrition,44, 453–464.
Konczak, I., Maillot, F., & Dalar, A. (2014).Phytochemical divergence in 45 accessions of Terminalia ferninandiana(Kakadu plum).Food Chemistry,151, 248–256.
Konczak, I., Zabaras, D., Dunstan, M., Aguas, P., Roulfe, P., & Pavan, A. (2009).Health benefits of Australian native foods: an evaluation of health-enhancing compounds. Australian Government, RIRDC, Pub. No.09/133, 20.
Kool, M. M., Comeskey, D. J., Cooney, J. M., & McGhie, T. K. (2010).Structural identification of the main ellagitannins of a boysenberry (Rubus loganbaccus x baileyanusBritt.) extract by LC-ESI-MS/MS, MALDI-TOF-MS and NMR spectroscopy.Food Chemistry, 119, 1535–1543.
Landete, J. M. (2011).Ellagitannins, ellagic acid and their derived metabolites: A review about source, metabolism, function and health.Food Research International,44, 1150–1160.
Maas, J. L., Wang, S. Y., & Galletta, G. J. (1991).Evaluation of strawberry cultivars for ellagic acid content.HortScience,26, 66–68.
Mertens-Talcott, S., Jilma-Stohlawetz, P., Rios, J., Hingorani, L., & Derendorf, H. (2006).
Absorption, metabolism and antioxidant effects of pomegranate polyphenols after in-gestion of a standardized extract in healthy human volunteers.Journal of Agricultural and Food Chemistry,54, 8956–8961.
Nardini, M., Cirillo, E., Natella, F., Mencarelli, D., Comisso, A., & Scaccini, C. (2002).
Detection of bound phenolic acids: prevention by ascorbic acid and ethylenediamine-tetraacetic acid of degradation of phenolic acids during alkaline hydrolysis.Food Chemistry,79, 119–124.
Netzel, M., Netzel, G., Tian, Q., Schwartz, S., & Konczak, I. (2007).Native Australian fruits– a novel source of antioxidants for food.Innovative Food Science and Emerging Technologies,8, 339–346.
Odriozola-Serrano, I., Hernández-Jover, T., & Martín-Belloso, O. (2007).Comparative evaluation of UV-HPLC methods and reducing agents to determine vitamin C in fruits. Food Chemistry,105, 1151–1158.
Okuda, T., Yoshida, T., & Hatano, T. (1989).New methods of analyzing tannins.Journal of Natural Products,52, 1–31.
Oszmianski, J., Wojdyło, A., & Kolniak, J. (2009).Effect of L-ascorbic acid, sugar, pectin and freeze-thaw treatment on polyphenol content of frozen strawberries.Food Science and Technology,42, 581–586.
Pfundstein, B., El Desouky, S. K., Hull, W. E., Haubner, R., Erben, G., & Owen, R. W. (2010).
Polyphenolic compounds in the fruits of Egyptian medicinal plants (Terminalia ballerica, Terminalia chebulaandTerminalia horrida): Characterisation, quantitation and determination of antioxidant capacities.Phytochemistry,71, 1132–1148.
Rommel, A., & Wrolstad, R. E. (1993).Influence of acid and base hydrolysis on the phenolic composition of red raspberry juice.Journal of Agricultural and Food Chemistry,41, 1237–1241.
Seeram, N.P., Henning, S. M., Zhang, Y., Suchard, M., Li, Z., & Heber, D. (2006).
Promegranate juice ellagitannin metabolites are present in human plasma and some persist in urine for up to 48 hours.The Journal of Nutrition,136, 2481–2485.
Tomás-Barberán, F. A., & Andrés-Lacueva, C. (2009).Polyphenols and health: Current state and progress.Journal of Agricultural and Food Chemistry,60, 8773–8775.
Tomás-Barberán, F. A., Somoza, V., & Finley, J. (2009).Food bioactives research and the Journal of Agricultural and Food Chemistry. Symposium Introduction.Journal of Agricultural and Food Chemistry,60, 6641–6643.
U.S. Department of Agriculture, Agricultural Research Service (2013).USDA National Nutrient Database for Standard Reference, Release 26.Nutrient Data Laboratory Home Page (http://www.ars.usda.gov/ba/bhnrc/ndl).
Wada, L., & Ou, B. (2002).Antioxidant activity and phenolic content of Oregon caneberries.Journal of Agricultural and Food Chemistry,50, 3495–3500.
Willett, W. C. (2002).Balancing life-style and genomics research for disease prevention. Science,296, 695–698.