1
Stock assessment of whaler and
hammerhead sharks (Carcharhinidae and
Sphyrnidae) in Queensland
George M. Leigh
Agri-Science Queensland; Department of Agriculture and Fisheries
2
This publication provides an assessment of the state of populations of tropical and subtropical sharks, some of Australia’s most important marine predators, with recommendations for management, future research and data collection.
While every care has been taken in preparing this publication, the State of Queensland accepts no responsibility for decisions or actions taken as a result of any data, information, statement or advice, expressed or implied, contained in this report.
© The State of Queensland 2015
Copyright protects this publication. The State of Queensland has no objection to this material being reproduced but asserts its right to be recognised as author of its original material and the right to have its material remain unaltered.
Cover photo: The common blacktip shark, Carcharhinus limbatus (source: Albert Kok, public domain licence)
Inquiries should be addressed to: Manager, DAF Publications
Department of Agriculture and Fisheries GPO Box 46
1
Executive summary
The majority of commercial shark product caught in Queensland comes from the East Coast Inshore Fin Fish Fishery (ECIFFF) and the Gulf of Carpentaria Inshore Fin Fish Fishery (GOCIFFF). The take of shark is managed through a variety of input and output controls such as maximum legal size limits, in possession limits and, in the case of the Queensland east coast, a total allowable commercial catch (TACC) limit. Data on shark catch sizes and catch rates are principally obtained through the commercial logbook system which has operated from 1988 to present, while data on the shark species composition have come mainly from the Fishery Observer Program (FOP) which operated only from 2006 to 2012. The logbook information has been built upon by ancillary projects such as the National Status of Australian Fish Stocks (SAFS) and Queensland Stock Status assessment processes. Shark species that interact with Queensland commercial and recreational fisheries have not been the subject of a formal stock assessment until now.
This stock assessment provides detailed results for the most common sharks encountered by Queensland commercial fishers. These sharks come from the whaler (Carcharhinidae) and hammerhead (Sphyrnidae) families and comprise sharpnose sharks (Rhizoprionodon taylori
and R. oligolinx), the milk shark (R. acutus), the creek whaler (Carcharhinus fitzroyensis), the hardnose shark (C. macloti), the spot-tail shark (C. sorrah), the Australian blacktip shark (C. tilstoni), the common blacktip shark (C. limbatus), the spinner shark (C. brevipinna), bull and pigeye sharks (C. leucas and C. amboinensis), the winghead shark (Eusphyra blochii), the scalloped hammerhead (Sphyrna lewini) and the great hammerhead (S. mokarran). Reef sharks were excluded because fishery observer data indicated that they were largely spatially segregated from sharks caught in the inshore net fisheries. The three common species of reef sharks in Queensland, which are all whaler sharks, are the grey reef shark Carcharhinus amblyrhynchos, the blacktip reef shark C. melanopterus and the whitetip reef shark
Triaenodon obesus.
The assessment includes a new demographic analysis to estimate shark populations’ natural mortality rates and productivity parameters. Compared to previously published demographic analyses of sharks, the new one offers consistent methodology over all the species assessed, uses up-to-date data specific to Australia where possible, corrects some errors and converts the demographic parameters into parameters commonly used in fishery stock assessment models (most notably in the stock–recruitment relationship).
The population dynamic model used in the assessment was tailored to the quality of the available data, especially the lack of shark species identification by fishers in the logbook data. The model analysed all shark species simultaneously and used population parameters from the new demographic analysis which in turn made use of the wealth of biological data available for sharks. Input data on species composition came only from the Fishery Observer Program. Species compositions before and after the time of the FOP were inferred indirectly by the model.
The model divided Queensland waters into three broad “Management regions”: the Gulf of Carpentaria, the northern east coast and the southern east coast. As shark populations can display strong regional differences, the Management regions were further divided into a total of ten Subregions, based on sampling regions used in the Queensland Long Term Monitoring Program (LTMP). Population parameter estimates were calculated for each species present in each Subregion.
2
tagging program recorded more sharpnose sharks while the FOP recorded more of other species of small sharks.
Fishery logbook data were not used for species composition due to the inaccuracy of shark species identification by fishers. Logbook data were used only to calculate annual harvest sizes and standardised catch rates for the aggregate of all shark species. These model inputs were still subject to substantial statistical error and potentially to biases from sources including frequent catches of sharks by fishers targeting various species of bony fish such as mackerel and barramundi, consequent discarding of sharks, market preference for small sharks, and political sensitivities that may affect fishers’ reporting of shark catches. Discards usually were not recorded in logbooks. Other sources of error include possible inconsistencies in how characteristics such as net length are reported in the logbooks, absence of data on net depth, and absence of detail on precise locations in which nets were set, e.g., distance from shore and depth of water.
Fishery catch rates were considered reliable enough to use in the assessment only from the year 1991 onwards, i.e., three years after the beginning of the logbook system. Standardised catch rates, due to the difficulty of species identification by fishers, could be defined only for all shark species combined and were not species-specific. The catch rates showed no meaningful trends in most Subregions but trended downward in the Whitsunday (covering Bowen and Mackay) and Stanage Subregions, and upward in the Rockhampton, Sunshine Coast and Moreton Subregions.
Biological data, in contrast to fisheries data, are of high quality for some species of sharks. Growth parameters, life cycles and reproductive rates are known with some precision. These data supported the stock assessment by providing reliable estimates of length at age, age at maturity, litter size and maximum age attained.
Use of data from the Shark Control Program (SCP) protecting popular Queensland east coast bathing beaches was explored. On the advice of the assessment’s Project Team, these data were not used in the assessment, mainly due to concerns about numerous changes in both gear and gear-setting techniques over time. SCP data were available from the beginning of the SCP in 1962. A major feature was a long (roughly 15-year) initial period of depletion of local shark populations after shark control gear was introduced, followed by much lower catch rates after this period. As with fishery data, SCP data suffered from lack of reliable species identification.
Estimates of population parameters in the assessment are presented from model simulations by Markov chain Monte Carlo (MCMC). The study ran a total of 500,000 MCMC iterations with every 50th simulation being saved. The limitations of the input data were reflected in the population model outputs with population size estimates subject to large statistical errors. The input data failed to provide realistic upper limits for the population size estimates, due to standardised catch-rates remaining stable or increasing in the majority of Subregions. However, minimum values of population size were determined with greater certainty. The primary reasons for this were that (a) values had to be consistent with the catch-size history and (b) none of the catch-rate time series for the different Subregions displayed large declines.
3
termed the Minimum-MSY Estimate and represented one of the lowest MSY values produced by the population model. The Minimum-MSY Estimate, by design, is highly conservative and is situated within the lowest 0.5% of the total-MSY values. The use of these two vectors, although nominally conservative, still carries an implication that the input data, especially the catch rate time series, are not heavily biased and that upward trends in catch rates in some Subregions are not due to large increases in fishing efficiency.
The Substitute Maximum Likelihood Estimate indicates MSY of 4903 tonnes per year (all regions and species combined), comprising 1111t in the Gulf of Carpentaria, 2121t in the northern east coast management region and 1670t in the southern east coast management region. The breakdown of the indicative MSY in tonnes by species groups was as follows:
Species Gulf Northern Southern Total
Sharpnose and milk sharks, Rhizoprionodon spp. 34.7 117.2 266.6 418.5
Creek whaler, Carcharhinus fitzroyensis 9.1 29.6 – 38.6
Hardnose shark, C. macloti – 62.0 – 62.0
Spot-tail shark, C. sorrah 121.5 280.7 47.2 449.5
Australian blacktip shark, C. tilstoni 512.5 670.4 – 1183.0
Common blacktip shark, C. limbatus – 117.5 789.6 907.1
Spinner shark, C. brevipinna – 68.0 329.5 397.5
Bull & pigeye sharks, C. leucas & C. amboinensis 258.8 438.2 191.6 888.7
Winghead shark, Eusphyra blochii 26.0 – – 26.0
Scalloped hammerhead, Sphyrna lewini 69.0 163.0 45.8 277.8
Great hammerhead, S. mokarran 79.8 174.6 – 254.4
Total 1111.4 2121.4 1670.3 4903.0
Sharpnose sharks and the milk shark have been grouped together in this table because of the discrepancy in species identification between by the FOP and the JCU–FRDC tagging project mentioned above.
The Minimum-MSY Estimate vector produced a much lower total-MSY of 1273 t per year consisting of ≥ 196 t from the Gulf of Carpentaria, ≥ 563 t in the northern east coast management region and ≥ 513 t in the southern east coast management region. The species-specific breakdown was the following (in tonnes):
Species Gulf Northern Southern Total
Sharpnose and milk sharks 9.2 31.7 24.3 65.2
Creek whaler 5.0 9.7 – 14.8
Hardnose shark – 14.1 – 14.1
Spot-tail shark 29.4 80.2 28.4 138.0
Australian blacktip shark 95.0 143.6 – 238.5
Common blacktip shark – 34.0 213.3 247.3
Spinner shark – 5.9 116.0 121.9
Bull & pigeye sharks 17.2 159.9 117.7 294.8
Winghead shark 4.3 – – 4.3
Scalloped hammerhead 25.7 52.4 13.7 91.8
Great hammerhead 10.4 31.6 – 42.0
Total ≥196.2 ≥563.1 ≥513.4 ≥1272.8
This simulation was less likely than the Substitute Maximum Likelihood Estimate: the negative log-likelihood was 13.0 units higher, corresponding to a value 2 × 13.0 = 26.0 units higher in an approximate χ2
statistic with 86 degrees of freedom (the number of parameters in the model).
4
about data quality, availability of data on discard rates of sharks, and lack of species composition data outside of the short period (2006–2012) over which the FOP operated. Reducing these uncertainties in future should increase confidence around MSY estimates, supporting the finding that catch levels for shark species covered by this assessment are currently sustainable.
5
Acknowledgements
Many people other than the nominal author have contributed to this stock assessment. The assessment was overseen by a Project Team which met several times and provided very valuable advice. The Project Team comprised the following members:
• Dr Peter Baxter of the Centre for Applications in Natural Resource Mathematics (CARM), University of Queensland, mathematical ecologist
• Nadia Engstrom and Anna Garland, data coordinators for Fisheries Queensland (FQ, a Division of the Department of Agriculture and Fisheries, DAF) who provided the commercial logbook data and Fishery Observer Program data. Nadia also proved extremely knowledgeable about the observer data and the history and management of the fishery, and provided expert answers to many questions about these aspects.
• Dr Colin Simpfendorfer of James Cook University, expert on shark biology and shark fisheries
• Dr Andrew Tobin of James Cook University, expert on the Queensland shark fishery and on shark biology
• Dr Wayne Sumpton of Agri-Science Queensland (ASQ, another branch of DAF), expert on the Queensland Shark Control Program which protects swimmers from sharks at Queensland’s popular bathing beaches, and more widely on shark biology
• Anthony Roelofs of FQ who initiated the Project Team and was the first chairman
• Dr Ian Jacobsen of FQ who took over as chairman after the first meeting and acted as the public contact for information about the shark stock assessment
• Michael Mikitis of FQ, contact for FQ’s stock assessment requirements
• Dr Jonathan Staunton-Smith of FQ, leader of the southern Queensland Long Term Monitoring Program which undertakes scientific sampling and analysis of important species in Queensland’s fisheries
• Tony Ham of FQ, fishery manager
• Andrew Thwaites of FQ, Director of regulatory reform
• Michael O’Neill of ASQ, leader of the fishery resource assessment group, who also provided valuable comments on drafts of this report.
The internal DAF members are especially grateful to Colin Simpfendorfer and Andrew Tobin for travelling from Townsville to provide their inputs to Project Team meetings.
Dr Peter Baxter made a substantial contribution to the assessment. He undertook the exploratory analysis of the Shark Control Program data presented in Appendix 1. It was later decided not to use this data source in the assessment, but it could be revisited in future assessments and could be used in ways other than provision of time series of catch rates which are assumed proportional to abundance. He advised on the demographic model in chapter 2 from his previous experience of demographic models which were a new field for me. He also made very beneficial comments on a previous draft of this report.
Dr Andrew Tobin, and all the staff involved in the shark tagging project that he led, generously provided data from that project, which was funded by the Australian Government’s Fisheries Research and Development Corporation (FRDC project no. 2010/006). These data contributed valuable information on the species composition of the fishery and the mortality rates of sharks.
6
The ADMB source code for the Cabezon stock assessment model, on which the model for this assessment was built, was kindly provided by Dr André Punt of CSIRO and the University of Washington.
Susan Theiss from FQ acted as data coordinator for the logbook and Fishery Observer Program data while Nadia Engstrom was on maternity leave.
7
Contents
Executive summary ... 1
Acknowledgements ... 5
Contents ... 7
Tables ... 8
Figures ... 9
Introduction ... 10
1. 1.1 Overview and data sources ... 10
1.2 Shark taxonomy and biology ... 12
1.3 Regional structure of the assessment ... 24
1.4 The fishery ... 25
1.4.1 Historical commercial fisheries in Northern Australia ... 25
1.4.2 Historical fishery on the Queensland East Coast ... 26
1.4.3 The current commercial fishery ... 26
1.4.4 Fishery Observer Program ... 30
1.4.5 Retention rates for the commercial fishery ... 35
1.4.6 Recreational fishery ... 36
1.4.7 Commercial fishery management ... 37
1.5 The Shark Control Program ... 37
1.6 Data used in the assessment ... 39
Demographic analysis ... 40
2. 2.1 Background ... 40
2.2 Demographic model and assumptions ... 40
2.3 Results ... 44
2.4 Data used in the assessment ... 45
Estimation of historical commercial harvests ... 46
3. 3.1 The Taiwanese fishery, 1974–1990 ... 46
3.2 The Australian fishery prior to 1988 ... 48
3.3 Harvest estimates input to the population dynamic model ... 48
Commercial catch-rate analysis ... 50
4. 4.1 Aims ... 50
4.2 Methods ... 50
4.2.1 Data limitations ... 50
4.2.2 Pre-processing of logbook data to produce fisher–day records ... 51
4.2.3 Formulation of generalised linear models ... 52
4.3 Results and discussion ... 53
4.3.1 Apparent retention rates ... 53
4.3.2 Annual catch rates ... 54
4.4 Diagnostics ... 63
Population dynamic model ... 68
5. 5.1 Overview ... 68
5.2 Basic population dynamics ... 69
5.3 Vulnerability functions ... 72
5.4 Recruitment ... 73
5.5 Habitat sizes ... 74
5.6 List of model parameters ... 75
5.7 Data and likelihoods ... 75
5.7.1 Data ... 75
5.7.2 Likelihood for relative abundance measures ... 76
5.7.3 Likelihood for length frequencies ... 77
5.7.4 Likelihood for length frequencies and species frequencies ... 79
5.7.5 Likelihood for recruitment parameters ... 79
8
5.8.1 Statement of the problem ... 80
5.8.2 Calculation of yield per recruit ... 81
5.8.3 Calculation of recruitment ratio ... 81
5.8.4 Maximum sustainable yield for multiple species ... 82
5.8.5 Software ... 82
Results from the population dynamic model ... 83
6. 6.1 Overview ... 83
6.2 Maximum sustainable yield and biomass ... 84
6.2.1 Representative Parameter Vector 1: Substitute maximum-likelihood ... 86
6.2.2 Representative Parameter Vector 2: Approximate minimum-MSY ... 91
6.3 Vulnerability estimates ... 95
6.4 Diagnostics ... 103
6.4.1 Serial plots of MCMC simulations ... 103
6.4.2 Fits to species composition ... 103
6.4.3 Fits to standardised catch rates ... 103
Discussion ... 114
7. 7.1 Implications for fishery management ... 114
7.2 Data limitations ... 115
7.3 Potential improvements to the assessment methodology ... 116
7.3.1 Potential improvements to the population dynamic model ... 116
7.3.2 Other potential improvements ... 116
7.4 Potential improvements to input data for the assessment ... 117
References ... 118
Appendix 1 Shark Control Program data ... 124
A1.1 Overview ... 124
A1.2 Catches and catch rates in the Shark Control Program ... 124
Appendix 2: R code for demographic analysis ... 132
Tables
Table 1: Original target species for assessment... 11Table 2: The augmented list of shark species groups used in the assessment ... 11
Table 3: Shark species recorded by the Fishery Observer Program ... 20
Table 4: Linking of shark species to major species with similar biology ... 21
Table 5: Sources of biological information used for the species groups ... 22
Table 6: Growth parameters of the shark species included in the assessment ... 23
Table 7: Reproductive parameters of the shark species included in the assessment ... 23
Table 8: Regional structure of the stock assessment ... 25
Table 9: Classification of Queensland Fish Board receiving stations into LTMP Regions .... 27
Table 10: Queensland Fish Board landings of sharks, classified into LTMP Regions ... 27
Table 11: Gear used to capture sharks for the JCU–FRDC tagging experiment. ... 32
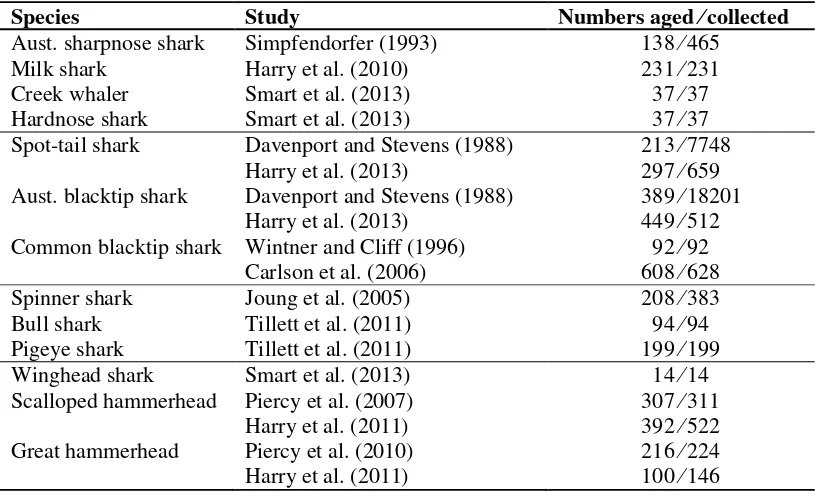
Table 12: Numbers of sharks aged in published biological studies... 43
Table 13: Assumptions of the demographic analysis. ... 44
Table 14: Population parameter estimates from the demographic model ... 45
Table 15: Harvest sizes of the Taiwanese fishery in northern Australia ... 47
Table 16: Harvest sizes of the Taiwanese fishery from Taiwanese fishers’ logbook data ... 47
Table 17: Logbook harvest sizes of sharks in the Taiwanese fishery ... 47
Table 18: Best estimates of harvest sizes of sharks in the Taiwanese fishery ... 48
Table 19: Explanatory variables included in the generalised linear model for catch rates ... 53
Table 20: Analysis of deviance tables for the Poisson GLMs used for catch-rate analysis .... 64
Table 21: Populations in the model ... 70
Table 22: Habitat coastline length used in the model, for each Subregion ... 75
Table 23: Parameters estimated in the model ... 75
9
Table 25: Estimated MSY values for Representative Parameter Vector 1 ... 87
Table 26: MSY estimates for Representative Parameter Vector 1 ... 88
Table 27: Estimated virgin and current biomass for Representative Parameter Vector 1 ... 89
Table 28: Virgin vulnerable biomass estimates for Representative Parameter Vector 1 ... 90
Table 29: Estimated MSY values for Representative Parameter Vector 2 ... 91
Table 30: MSY estimates for Representative Parameter Vector 2 ... 92
Table 31: Estimated virgin and current biomass for Representative Parameter Vector 2 ... 94
Table 32: Virgin vulnerable biomass estimates for Representative Parameter Vector 2 ... 95
Figures
Figure 1: Some sharks from orders other than Carcharhiniformes... 14Figure 2: Some sharks from family Carcharhinidae ... 15
Figure 3: Some sharks from family Carcharhinidae excluded from the stock assessment ... 16
Figure 4: Two sharks from family Sphyrnidae commonly encountered ... 17
Figure 5: Commercial harvest of sharks and grey mackerel from Queensland logbooks ... 29
Figure 6: Reported harvest of sharks from Queensland commercial logbooks ... 29
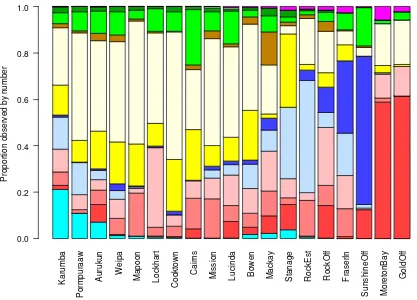
Figure 7: Species proportion by number from the Fishery Observer Program ... 31
Figure 8: Species proportion by number from tag releases ... 31
Figure 9: Reported commercial harvest of sharks by LTMP Region ... 33
Figure 10: Total weight of sharks recorded by observers, by taxon and LTMP Region ... 33
Figure 11: Average weight of sharks encountered in the commercial fishery ... 34
Figure 12: Length distribution of sharks encountered in the commercial fishery ... 34
Figure 13: Retention of sharks encountered in the commercial gillnet fishery ... 36
Figure 14: Final harvest estimates by Subregion, input to the population dynamic model ... 49
Figure 15: Proportion of nonzero catches of sharks by S-licensed fishers only ... 55
Figure 16: Proportion of nonzero catches of sharks by year in each Subregion ... 56
Figure 17: Standardised catch rates of sharks, used as input to the population model ... 58
Figure 18: Plots of deviance residuals against fitted values for the Poisson GLMs ... 65
Figure 19: Histogram of the lowest 25% of total-MSY estimates... 85
Figure 20: Scatter plot of the lowest 50% of total-MSY estimates ... 85
Figure 21: Vulnerability to gillnetting for each species of shark in the model ... 97
Figure 22: Serial plot of retained total-MSY values from the model’s MCMC ... 104
Figure 23: Serial plot of retained negative-log-likelihood values from MCMC ... 104
Figure 24: Serial plot of retained values of the L50 parameter for hardnose sharks ... 105
Figure 25: Serial plot of retained values of the L_diff parameter for hardnose sharks ... 105
Figure 26: Fits to species composition data by number, Fishery Observer Program ... 106
Figure 27: Model fits to standardised catch rates ... 111
Figure 28: Shark Control Program catches of all taxa by gear type ... 126
Figure 29: Spatial coverage of the SCP ... 126
Figure 30: Catch, effort and catch per unit effort (CPUE) for all taxa caught by the SCP. .. 127
Figure 31: Breakdown of the SCP catch by taxon ... 127
Figure 32: Seasonality of SCP catches of sharks ... 128
Figure 33: Catch and CPUE of sharks by the SCP, by year and region ... 128
Figure 34: Comparison of SCP catches of tiger sharks and whaler sharks ... 129
Figure 35: SCP net catches and effort from the Sunshine Coast North region ... 129
Figure 36: Catch and CPUE of whaler sharks in the SCP ... 130
Figure 37: Catch and CPUE of tiger sharks in the SCP ... 130
Figure 38: Catch and CPUE of hammerhead sharks in the SCP ... 131
10
Introduction
1.
1.1
Overview and data sources
Sharks are important members of marine ecosystems, often top-level predators, and are common in Queensland coastal waters. The concept of “fishing down the food web” (Pauly
et al. 1998; Pauly and Palomares 2005), the low reproductive rate of sharks compared to most bony fish (see, e.g., Au et al. 2008) and the demand for shark products in Asia have all caused concerns about the sustainability of shark populations worldwide. Five species of sharks, including the scalloped hammerhead Sphyrna lewini and great hammerhead S. mokarran, were added to the Convention on International Trade in Endangered Species of Wild Fauna and Flora (CITES) in 2013 (Carrington 2013; CITES 1979, 2014) and this has affected the Australian Government’s obligations for accreditation of the Queensland shark fishery as a Wildlife Trade Operation under the Environment Protection and Biodiversity Conservation (EPBC) Act 1999. The validity of the concept of fishing down the food web, whereby a fishery begins by fishing down top-level predators and then proceeds to successively fish down species at lower levels in the food web, is disputed (Hilborn 2007) but is still widely believed in both scientific circles and the wider community.
This stock assessment has been undertaken to assess the status of exploitable shark populations in Queensland. It concentrates on the most common families of sharks encountered by Queensland commercial fishers: whaler sharks (family Carcharhinidae, known in many countries as “requiem sharks”) and hammerhead sharks (family Sphyrnidae). The tiger shark Galeocerdo cuvier is a member of Carcharhinidae and is very common in Queensland but was excluded from this assessment because it is caught in only very small numbers by fishers and adequate fishery data on it were not available.
The original target species for assessment are listed in Table 1. The “category” descriptor was defined for convenience in the stock assessment, but has no definite biological meaning. Roughly, a “small whaler” is a whaler species that grows to around one metre in length and is completely selected by the commercial gillnet fishery. A “medium whaler” is one that grows to a maximum length around 1.5–2.5m and in which large adults are generally not caught by gillnets. A “large whaler” is a whaler species that grows over 2.5m in which juveniles are caught by gillnets and most adults are not. The “hammerhead” category covers all the hammerhead sharks, which have very different net-selectivity characteristics to whalers. Six additional species groups were added to the assessment due to lack of reliable species identification in the fishery data. The final twelve species groups used in the assessment are listed in Table 2. Many shark species are very difficult to distinguish, even for experts, especially during the juvenile stages of their life history. Consequently, much of the data available for stock assessment relates to multi-species aggregates. The twelve species groups cover the species commonly caught in the fisheries, and less common species were also allocated to these groups on the basis of similarity in biology (see section 1.2 and Tables 3 and 4).
The species of sharks encountered in Queensland are described in the next section “Shark taxonomy and biology”, but we draw attention here to the small whalers which are caught in substantial numbers in Queensland. The small whalers generally grow to a maximum total length of around one metre, and are themselves preyed upon by larger species of sharks. Their presence and position within broader food chains demonstrates that not all shark species can be considered top-level predators in their ecosystems.
non-11
reporting of species considered to be of conservation interest, and the high proportion of shark harvest reported in generic categories such as “unidentified whaler” or “unspecified shark”.
Table 1: Original target species for assessment: “Category” is a convenient descriptor developed for use in this assessment of Queensland shark species, but has no biological meaning. Six other major species had to be added due to lack of species identification in the available data (see Table 5 in section 1.2).
Scientific name Common name Family Category
Rhizoprionodon acutus Milk shark Carcharhinidae Small whaler
Carcharhinus sorrah Spot-tail shark Carcharhinidae Medium whaler
Carcharhinus tilstoni Australian blacktip shark Carcharhinidae Medium whaler
Carcharhinus limbatus Common blacktip shark Carcharhinidae Medium whaler
Carcharhinus brevipinna Spinner shark Carcharhinidae Large whaler
Sphyrna lewini Scalloped hammerhead Sphyrnidae Hammerhead
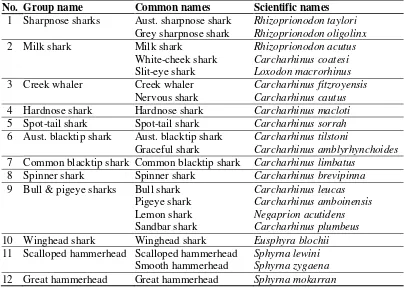
Table 2: The augmented list of shark species groups used in the assessment. Species from each family (whaler or hammerhead) are listed in roughly increasing order of size. Less common species are listed under the main species in each group and were allocated into the groups on the basis of similar biology.
No. Group name Common names Scientific names
01 Sharpnose sharks Aust. sharpnose shark Rhizoprionodon taylori
Grey sharpnose shark Rhizoprionodon oligolinx
02 Milk shark Milk shark Rhizoprionodon acutus
White-cheek shark Carcharhinus coatesi
Slit-eye shark Loxodon macrorhinus 03 Creek whaler Creek whaler Carcharhinus fitzroyensis
Nervous shark Carcharhinus cautus 04 Hardnose shark Hardnose shark Carcharhinus macloti 05 Spot-tail shark Spot-tail shark Carcharhinus sorrah 06 Aust. blacktip shark Aust. blacktip shark Carcharhinus tilstoni
Graceful shark Carcharhinus amblyrhynchoides 07 Common blacktip shark Common blacktip shark Carcharhinus limbatus
08 Spinner shark Spinner shark Carcharhinus brevipinna 09 Bull & pigeye sharks Bull shark Carcharhinus leucas
Pigeye shark Carcharhinus amboinensis
Lemon shark Negaprion acutidens
Sandbar shark Carcharhinus plumbeus
10 Winghead shark Winghead shark Eusphyra blochii
11 Scalloped hammerhead Scalloped hammerhead Sphyrna lewini
Smooth hammerhead Sphyrna zygaena
12 Great hammerhead Great hammerhead Sphyrna mokarran
12
amblyrhynchoides from the blacktip sharks C. limbatus and C. tilstoni, and the bull shark C. leucas from the pigeye shark C. amboinensis.
An additional problem to errors in species identification is that some species were known to be impossible to distinguish in the field, most notably the common blacktip shark
Carcharhinus limbatus and the Australian blacktip C. tilstoni. Distinction of these species requires either dissection or genetic analysis, which field observers were not tasked to undertake. They were recorded as simply “blacktip sharks” in the FOP data. Scientific genetic studies, however, indicated that these two species could be fairly reliably separated by the latitudes at which they were caught, with C. tilstoni predominating in the north and C. limbatus in the south (Welch et al. 2011; J. R. Ovenden and J. A. T. Morgan, personal communication, 2013), and this is what was done for the stock assessment.
In contrast to fishery data, biological data for the species included in this assessment were of much higher quality. There is a dedicated community of biologists who study sharks, which has provided detail of life cycles and reproductive rates for many species. Biological data on ageing, age at maturity, pupping frequency and litter size allow demographic analysis of shark populations from which rates of natural mortality and recruitment compensation can be estimated.
Demographic analysis, in particular the “Leslie matrix” approach (called the Bernardelli-Lewis-Leslie matrix by Liu and Cohen 1987), uses biological data to examine the ability of a population to sustain itself, and can estimate a maximal annual rate of increase of the population (Bernadelli 1941; Lewis 1942; Leslie 1945). The first practical applications of this approach to fisheries science appear to be Vaughan and Saila (1976) for tuna, and Hoenig and Gruber (1990) and Hoff (1990) for sharks. The demographic analysis used for sharks in Queensland is covered in chapter 2 and improves on past analysis by using consistent methodology over all species and correcting some errors in methodology. The demographic analysis uses up-to-date information from Australian studies where possible, and converts the results into standard population productivity measures that are used in stock assessments of bony fish. To the best of our knowledge the last of these contributions has not previously been accomplished for sharks.
The Shark Control Program (SCP), which aims to protect swimmers from shark attack at popular Queensland East Coast bathing beaches, provided supplementary data, although these were not used in the assessment. Data on catch sizes and catch rates were available from the beginning of the SCP in 1962, twenty-six years before the start of the commercial logbook database. In common with the shark fishery data, the SCP data suffer from lack of reliable species identification.
Finally, tag release and recovery data on sharks were available from a tagging experiment funded by the Australian Government’s Fisheries Research and Development Corporation (FRDC, project no. 2010/006) and carried out by scientists from James Cook University. These data were kindly provided by Dr Andrew Tobin of James Cook University. That project recorded the species of each shark tagged, although it did not claim to be fully representative of commercial fishing operations. It was available as a check on which shark species were commonly encountered.
The tag-return data could also provide checks on the shark mortality rates estimated by demographic analysis in chapter 2. We were not able to devote the necessary time to undertake that in this assessment, but we hope to in future.
1.2
Shark taxonomy and biology
13
fish” which technically includes lobe-finned fish, from which land vertebrates descend. Well-known lobe-finned fish include coelacanths (order Coelacanthiformes) and lungfish (orders Ceratodontiformes and Lepidosireniformes), but nearly all living bony fish are ray-finned. The term “bony fish” also avoids confusion with the animals called rays which are close relatives of sharks and are not ray-finned fish.
A few diverse examples of sharks encountered in Queensland are the white shark (or great white shark) Carcharodon carcharias (order Lamniformes, mackerel sharks), the crested horn shark Heterodontus galeatus (order Heterodontiformes, bullhead sharks), and the tasselled wobbegong Eucrossorhinus dasypogon (order Orectolobiformes, carpet sharks) (Figure 1). The other six orders of sharks are Carcharhiniformes (ground sharks), Squaliformes (a diverse order including dogfish and gulper sharks), Squatiniformes (angel sharks), Echinorhiniformes (bramble sharks), Pristiophoriformes (sawsharks) and Hexanchiformes (frilled sharks and cow sharks).
The sharks of interest for stock assessment in Queensland all belong to the diverse order Carcharhiniformes and come from the families Carcharhinidae (whaler sharks) and Sphyrnidae (hammerhead sharks). Whaler sharks have a streamlined shape (Figures 2 and 3) and the different whaler species can be extremely difficult to distinguish. Also juveniles of one species can resemble adults of a different (smaller) species. Hammerheads are distinguished by their wide, hammer-shaped heads, called cephalofoils (Figure 4). Cephalofoils are not only visually striking but may greatly alter hammerheads’ vulnerability to fishing, as large hammerheads often get their heads entangled in gillnets designed for smaller animals (Sumpton et al. 2011). It is possible that cephalofoils may also reduce the vulnerability of juvenile hammerheads to fishing when the water flow is high, because when travelling front-on their heads may bounce off gillnets that would otherwise catch them around the body (W. D. Sumpton, personal communication, 2015).
Changes to the taxonomy of sharks are proposed frequently. Some current opinion places hammerhead sharks inside Carcharhinidae (Heinicke et al. 2009). Naylor et al. (2012) found that Carcharhinidae and Sphyrnidae were indeed very similar, but left them as separate families as they found that each of these groups was monophyletic, i.e., all members of Sphyrnidae descended from one single ancestral species and all members of Carcharhinidae descended from a different single ancestral species. They found, however, that the tiger shark
Galeocerdo cuvier was more different from Carcharhinidae than Sphyrnidae was, and they proposed removing it from Carcharhinidae.
Most species of whaler shark can be distinguished visually by skilled observers, but two important species that cannot are the two blacktip species Carcharhinus tilstoni (the Australian blacktip) and C. limbatus (the common blacktip). For stock assessment these two species were separated on the basis of latitude, with C. tilstoni being more common north of about 24°S and C. limbatus being more common south of this latitude (Welch et al. 2011; J. R. Ovenden and J. A. T. Morgan, personal communication, 2013). The exact latitude at which this change takes place is subject to high uncertainty, as samples were collected only from widely separated locations.
14
Terry Goss
Creative Commons by Attribution licence
Figure 1: Some sharks from orders other than Carcharhiniformes that are encountered in Queensland; data on such sharks are insufficient to allow stock assessment.
Lakshmi Sawitri Creative Commons by Attribution licence
Ian Shaw, Reef Life Survey Creative Commons by Attribution licence
White shark
Carcharodon carcharias
order Lamniformes
Crested horn shark
Heterodontus galeatus
order Heterodontiformes
Tasselled wobbegong
Eucrossorhinus dasypogon
15
Rob Harcourt Used with permission
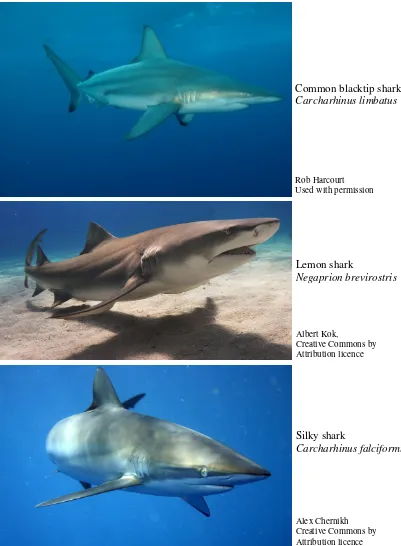
Figure 2: Some sharks from family Carcharhinidae commonly encountered in Queensland coastal waters, with which the stock assessment deals.
Alex Chernikh Creative Commons by Attribution licence Albert Kok,
Creative Commons by Attribution licence
Common blacktip shark
Carcharhinus limbatus
Lemon shark
Negaprion brevirostris
Silky shark
16
Klaus Stiefel
Creative Commons by
Attribution for Non-commercial Use licence
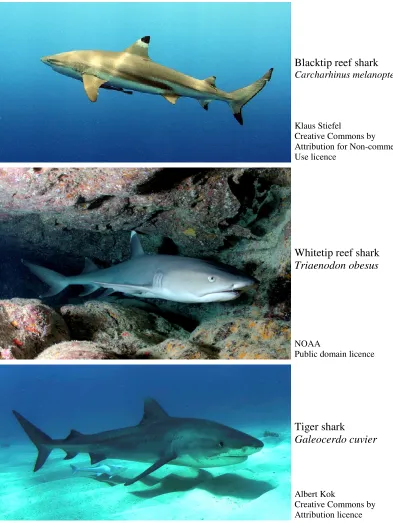
Figure 3: Some sharks from family Carcharhinidae that are encountered in Queensland waters but can be largely excluded from the stock assessment due to their location, behaviour or body shape.
Albert Kok
Creative Commons by Attribution licence NOAA
Public domain licence
Blacktip reef shark
Carcharhinus melanopterus
Whitetip reef shark
Triaenodon obesus
Tiger shark
17
Sharks are particularly interesting for stock assessment because their reproductive processes can be quantified to a much greater degree than those of ray-finned fish. Many sharks, including all those in the families Carcharhinidae and Sphyrnidae, give birth to live young (pups), either with or without (in the case of the tiger shark) a placental connection during gestation. This characteristic enables the pupping frequency and litter size to be measured from captured female sharks. Such information, combined with ageing from counts of rings on shark vertebrae, allows demographic analyses of shark populations to be conducted (see previous section).
Pups have a definite length at birth (age zero) which can be measured. Use of the birth length can reduce the number of parameters that need to be estimated in a growth function, from three to two in the case of the von Bertalanffy function (see, e.g., Harry et al. 2010, 2011). The von Bertalanffy growth function is (Bertalanffy 1938)
{
1 e K(t t0)}
L
L= ∞ − − − ,
where L is the expected length of an animal at age t, and L∞, K and t0 are model parameters. The parameter t0 is the theoretical age at which the expected length is zero, which for sharks will be negative, i.e., well before birth, due to growth in utero before they are born. If the
Klaus Stiefel
Creative Commons by Attribution licence for non-commercial use
Figure 4: Two sharks from family Sphyrnidae commonly encountered in Queensland coastal waters, with which the stock assessment deals. The scalloped hammerhead is the most common hammerhead species and is distinguished from other hammerhead species found in Queensland by the marked scalloping on the front of its cephalofoil.
Josh Hallett
Creative Commons by Attribution licence
Scalloped hammerhead
Sphyrna lewini
Great hammerhead
18
length at birth, L0 , is known, the growth function can be reparameterised to remove the parameter t0 :
. )
( 0 Kt
e L L L
L= ∞− ∞− − (1.1)
For sharks, separate growth functions usually have to be fitted to male and female sharks, as females usually grow bigger (see references in Table 5 and results in Table 6 below). Females are also often said to live longer than males (see, e.g., Harry et al. 2010); for reasons of complexity and lack of quantitative data for some species, this effect has not been included in the stock assessment. The resulting estimates of natural mortality rates are a rough average of male and female sharks, and so this simplification should have little effect on the results of the assessment.
In addition to having sex-specific growth functions, many shark populations segregate by sex (Sims 2005). Females of some species, notably hammerheads, are more inclined to move offshore than males. For example, Harry et al. (2011) found plenty of mature males but only one mature female out of 93 female scalloped hammerheads collected off the Australian east coast. On the other hand, females of many species, including the scalloped hammerhead, migrate into inshore nursery areas to give birth in locations in which pups will be relatively safe from predation (Castro 1993, 1996; Feldheim et al. 2002; Capapé et al. 2003; Hueter et al. 2005; Sims 2005; Harry et al. 2011). It does not seem to have been completely explained how female scalloped hammerheads move back inshore without being caught by fishers, but this is a worldwide phenomenon which has resulted in paucity of data on reproduction of the scalloped hammerhead (Stevens and Lyle 1989), and it is evident that the females’ behaviour must be different during this period. The effect of this on stock assessment results is generally to make them err on the side of caution: the assessment will assume that roughly equal numbers of male and female sharks are caught by fishers. In reality it is likely that more males will be caught and females will be afforded partial protection from fishing activities. This factor is considered to be of particular importance to the ongoing health of regional shark populations.
While larger females tend to have larger litters, this could not be accounted for in the demographic analysis (chapter 2) due to a lack of quantitative data. The stock assessment population model, however, assumed that fecundity was proportional to weight, which is a fairly standard practice in stock assessment. We believe that the assumption in the population model is more accurate, but the assumption of constant litter size in the demographic model will roughly average the results over females of all sizes, so should have little effect on the results of the demographic analysis.
Many other subtle features of the biology of sharks were noted but were not feasible to take into account in this stock assessment due to the complexity of modelling that would be required. Examples include the following:
• Harry et al. (2011) found that scalloped hammerheads grow faster, but to a smaller maximum length, in north Queensland waters than in southern Queensland.
• Harry et al. (2011) also hypothesised split life cycles for male scalloped hammerheads, whereby some males stay inshore all their lives to better their chances of mating and consequently end up smaller than other males which travel offshore for a better diet.
• Some sharks, notably the milk shark, breed throughout the year (Stevens and McLoughlin 1991; Harry et al. 2010), whereas most sharks reproduce seasonally. This assessment assumes that all sharks reproduce seasonally. The effect on results should be negligible because the productivity of the whole population is much the same.
• Some sharks, notably the Australian blacktip, may mature earlier in the Gulf of Carpentaria than on the Queensland East Coast (Davenport and Stevens 1988; Harry
19
Queensland or the Northern Territory, irrespective of the exact location from which samples were collected.
• Sex ratios of sharks in the population are an open question, and are difficult to measure due to segregation of the sexes. The assessment assumed a 1:1 sex ratio at birth for all species and the same natural mortality rate for both sexes.
The forty shark species recorded by the Queensland Fishery Observer Program are listed in Table 3. They show that the catch is dominated by only a few major species, with the top four species by number making up 57% of the total. However, many other species needed to be taken into account to deal with deficiencies in fishery logbook data. Although species-specific harvests were required only for the species in Table 1 above, their estimation required all observed species to be considered. To produce a manageable list of major species to include in the population model, each observed species was, on the basis of similarity in biology, linked to one of the twelve species groups listed in Table 2: these links are shown in Table 4. Some minor non-hammerhead species did not have similar biology to any major species. These species were split between all nine whaler species groups, in the same proportions as those whaler groups were observed in that location and sector, in order to clearly separate non-hammerhead sharks from hammerheads whose fishery catchability characteristics were very different.
Key sources of biological information for the species groups are listed in Table 5. Parameter values for growth and lifespan derived from those sources and used in the assessment are listed in Table 6, and those for reproduction are listed in Table 7. When one or more values in Tables 6 and 7 were unavailable from the scientific literature, they were inferred from available data, e.g., age at maturity was derived from length at maturity in combination with the growth function. Von Bertalanffy growth functions were used for all species and both sexes. The length at birth, parameter L0 in equation (1.1), was set to the mean observed birth length; the L0 value from fitting the growth function was not used. The length used was total length, or more precisely “stretched total length” (STL) (see, e.g., Harry et al. 2011) which is the length measurement generally used for sharks in Australia. For reference, Stevens and McLoughlin (1991) provide the following equation relating fork length (FL) to STL, both measured in cm, for the pigeye shark:
FL = 0.79 × STL – 0.68.
Similar equations for the Australian blacktip shark from Stevens and Wiley (1986) are FL = 0.803 × STL – 0.075
and
STL = 1.235 × FL + 0.913.
For the common blacktip shark, Wintner and Cliff (1996) provide an equation relating STL to pre-caudal length (PCL):
STL = 1.334 × PCL + 4.27.
For the spot-tail shark Carcharhinus sorrah the asymptotic length parameter, L∞ in equation
(1.1), from Australian biological studies was much less than the reported maximum length of this species worldwide. The species is widely claimed to reach a length of 160 cm (Pillans et al. 2009; see, e.g., Last and Stevens 2009). For northern Australia, however, Stevens and Wiley (1986) state, “few females above 130 cm, and few males above 110 cm were caught”. The maximum lengths observed by Stevens and Wiley were 152 cm (female) and 131 cm (male), but both of these were on sharks that came from the Arafura and Timor Seas. The largest individuals observed by Harry et al. (2013) on the Queensland East Coast were 131 cm (female) and 114 cm (male). It seems likely that the few much larger sharks observed by Stevens and Wiley (1986) were migrants from Indonesia, and that the L∞ values of 127cm for
20
Table 3: Shark species recorded by the Fishery Observer Program. Some of these species were not retained by fishers, and were returned to the water alive where possible.
Common name Scientific name Frequency
Blacktip shark Carcharhinus limbatus & C. tilstoni 4394
Spot-tail shark Carcharhinus sorrah 2080
Scalloped hammerhead Sphyrna lewini 1654
Milk shark Rhizoprionodon acutus 1231
Spinner shark Carcharhinus brevipinna 989
Bull shark Carcharhinus leucas 809
Australian sharpnose shark Rhizoprionodon taylori 767
Winghead shark Eusphyra blochii 710
White-cheek shark Carcharhinus coatesi 662
Hardnose shark Carcharhinus macloti 597
Weasel sharks Family Hemigaleidae 373
Slit-eye shark Loxodon macrorhinus 369
Creek whaler Carcharhinus fitzroyensis 352
Pigeye shark Carcharhinus amboinensis 266
Great hammerhead Sphyrna mokarran 232
Grey sharpnose shark Rhizoprionodon oligolinx 184
Carpet sharks Order Orectolobiformes 157
Gummy sharks Family Triakidae 108
Cat sharks Family Scyliorhinidae 65
Nervous shark Carcharhinus cautus 52
Grey reef shark Carcharhinus amblyrhynchos 51
Dogfish & gulper sharks Order Squaliformes 51
Lemon shark Negaprion acutidens 49
Blacktip reef shark Carcharhinus melanopterus 47
Silky shark Carcharhinus falciformis 43
Graceful shark Carcharhinus amblyrhynchoides 36
Sandbar shark Carcharhinus plumbeus 36
Whitetip reef shark Triaenodon obesus 35
Tiger shark Galeocerdo cuvier 24
Wobbegongs Eucrossorhinus, Orectolobus, Sutorectus 23
Silvertip shark Carcharhinus albimarginatus 17
Crested hornshark Heterodontus galeatus 8
Bronze whaler Carcharhinus brachyurus 7
Tawny shark Nebrius ferrugineus 5
Angel sharks Family Squatinidae 5
Dusky whaler Carcharhinus obscurus 4
Speartooth shark Glyphis glyphis 4
Smooth hammerhead Sphyrna zygaena 2
Galapagos shark Carcharhinus galapagensis 2
21
Table 4: Linking of shark species to major species that were modelled in the stock assessment and had similar biology. “Category” was defined for convenience, and has little biological meaning. The linked major species were intended to have similar biological parameters to the original species. Blacktip sharks were assigned to the Australian blacktip in the Gulf of Carpentaria and the northern east coast, and to the common blacktip in the southern east coast. “Whaler unspecified” signifies that no major species had similar biology, e.g., carpet sharks and cat sharks. In these cases the catch was divided between the whaler species in the proportions in which those whaler species were recorded, on the basis that they were much more similar to whaler sharks than hammerheads with regard to vulnerability to fishing.
Common name Category Linked major species
Blacktip shark Medium whaler Aust. blacktip GoC & NEC Common blacktip SEC Spot-tail shark Medium whaler Spot-tail shark
Scalloped hammerhead Hammerhead Scalloped hammerhead
Milk shark Small whaler Milk shark
Spinner shark Large whaler Spinner shark
Bull shark Large whaler Bull shark
Australian sharpnose shark Small whaler Aust. sharpnose shark
Winghead shark Hammerhead Winghead shark
White-cheek shark Small whaler Milk shark Hardnose shark Small whaler Hardnose shark Weasel sharks Weasel shark Whaler unspecified Slit-eye shark Small whaler Milk shark
Creek whaler Small whaler Creek whaler
Pigeye shark Large whaler Bull shark
Great hammerhead Hammerhead Great hammerhead Grey sharpnose shark Small whaler Aust. sharpnose shark Carpet sharks Carpet shark Whaler unspecified
Gummy sharks Hound shark Whaler unspecified
Cat sharks Cat shark Whaler unspecified
Nervous shark Small whaler Creek whaler
Grey reef shark Medium whaler Whaler unspecified Dogfish & gulper sharks Squaliformes Whaler unspecified
Lemon shark Large whaler Bull shark
Blacktip reef shark Medium whaler Whaler unspecified
Silky shark Large whaler Whaler unspecified
Graceful shark Medium whaler Aust. blacktip shark
Sandbar shark Large whaler Bull shark
Whitetip reef shark Medium whaler Whaler unspecified
Tiger shark Large whaler Whaler unspecified
Wobbegongs Carpet shark Whaler unspecified
Silvertip shark Large whaler Whaler unspecified Crested hornshark Bullhead shark Whaler unspecified Bronze whaler Large whaler Whaler unspecified
Tawny shark Carpet shark Whaler unspecified
Angel sharks Angel shark Whaler unspecified
Dusky whaler Large whaler Whaler unspecified Speartooth shark Large whaler Whaler unspecified Smooth hammerhead Hammerhead Scalloped hammerhead Galapagos shark Large whaler Whaler unspecified
22
Table 5: Sources of biological information used for the species groups in the assessment. Parameter values for the pigeye shark were used when those for the bull shark in Australia were not available. In all other cases the biological parameter values used were those of the most common species in each group; the groups were not treated as multi-species complexes. Other species were linked to these groups to reduce the number of species in the population model (see Table 4).
Group Common name Scientific name Sources
01 Aust. sharpnose shark Rhizoprionodon taylori Stevens and McLoughlin (1991) Simpfendorfer (1992)
Simpfendorfer (1993)
02 Milk shark Rhizoprionodon acutus Stevens and McLoughlin (1991) Harry et al. (2010)
03 Creek whaler Carcharhinus fitzroyensis Lyle (1987) Smart et al. (2013)
04 Hardnose shark Carcharhinus macloti Stevens and McLoughlin (1991) Smart et al. (2013)
05 Spot-tail shark Carcharhinus sorrah Stevens and Wiley (1986) Davenport and Stevens (1988) Harry et al. (2013)
06 Aust. blacktip shark Carcharhinus tilstoni Stevens and Wiley (1986) Davenport and Stevens (1988) Harry et al. (2012)
Harry et al. (2013)
07 Common blacktip shark Carcharhinus limbatus Stevens (1984)
Wintner and Cliff (1996) Capapé et al. (2004) Carlson et al. (2006) Macbeth et al. (2009) Harry et al. (2012)
08 Spinner shark Carcharhinus brevipinna Branstetter (1981) Stevens (1984)
Stevens and McLoughlin (1991) Joung et al. (2005)
Macbeth et al. (2009)
09 Bull shark Carcharhinus leucas Tillett et al. (2011)
Pigeye shark Carcharhinus amboinensis Stevens and McLoughlin (1991) Tillett et al. (2011)
10 Winghead shark Eusphyra blochii Stevens and Lyle (1989) Smart et al. (2013) 11 Scalloped hammerhead Sphyrna lewini Stevens and Lyle (1989)
Piercy et al. (2007) Harry et al. (2011) 12 Great hammerhead Sphyrna mokarran Stevens and Lyle (1989)
23
Table 6: Growth parameters of the shark species included in the assessment. Parameters α
and β are for the length-weight relationship W = αLβ where W is the weight of a shark (kg) and L is its stretched total length (cm); L0 is the average length at birth (cm); L∞ (cm) and K
(yr –1) are von Bertalanffy growth parameters from equation (1.1); and amax is the maximum
age observed (yr). Maximum attainable lifespans are almost certainly greater than amax .
Dashed lines separate the different categories of sharks (small, medium and large whalers, and hammerheads), but have no other meaning.
Female Male
Common name α β L0 L∞ K L∞ K amax
Aust. sharpnose shark 2.17×10⁻⁷ 3.750 24 73.2 1.01 65.2 1.34 6 Milk shark 3.74×10⁻⁶ 3.010 36 86.1 0.63 82.1 0.94 8 Creek whaler 1.42×10⁻⁶ 3.292 51.5 125.8 0.21 99.6 0.37 13 Hardnose shark 3.91×10⁻⁷ 3.550 42.5 87.9 0.26 87.9 0.26 12 Spot-tail shark 5.45×10⁻⁷ 3.510 52 126.6 0.336 107.4 0.632 14 Aust. blacktip shark 4.75×10⁻⁶ 3.060 61 194.2 0.14 165.4 0.19 15 Common blacktip shark Use Aust. blacktip 72 262.0 0.21 262.0 0.21 16 Spinner shark 1.13×10⁻⁶ 3.330 71 288.2 0.151 257.4 0.203 21
Bull shark Use pigeye 68.5 340.0 0.09 340.0 0.09 29
Pigeye shark 1.94×10⁻⁶ 3.270 62.5 288.0 0.088 282.0 0.087 26 Winghead shark 2.71×10⁻⁷ 3.560 46 171.0 0.12 171.0 0.12 21 Scalloped hammerhead 3.99×10⁻⁶ 3.030 47.5 330.5 0.077 319.9 0.093 31 Great hammerhead 1.23×10⁻⁶ 3.240 65 402.7 0.079 402.7 0.079 39
Table 7: Reproductive parameters of the shark species included in the assessment. Parameters a50 and a95 are the ages at 50% and 95% maturity of females (yr); pupping
interval is the average time interval between litters for an individual female shark (yr); and litter size is the average litter size to which a female shark gives birth. The age a95 in most
cases was not available and was set equal to a50 when a50≤2, a50 + 1 when a50 > 2 and a50 < 10, and a50 + 2 when a50 ≥ 10; when a95 was set equal to a50 , both were rounded up to the
next whole year because the population model was annual. Ages a50 and a95 were inferred
from published values of length at maturity when that was the only information available.
Common name a50 a95 Pupping interval Litter size
Aust. sharpnose shark 1.00 1.00 1 04.5
Milk shark 2.00 2.00 1 03.0
Creek whaler 4.00 5.00 1 03.7
Hardnose shark 3.00 4.00 2 02.0
Spot-tail shark 3.00 4.00 1 03.1
Aust. blacktip shark 5.65 6.65 1 03.0
Common blacktip shark 7.00 8.00 2 08.0
Spinner shark 8.00 9.00 2 10.9
Bull shark 9.50 10.50 2 Use pigeye
Pigeye shark 13.50 15.50 2 09.0
Winghead shark 7.00 8.00 1 11.8
Scalloped hammerhead 10.00 12.00 1 16.5
24
Data for the bull shark were taken where needed from the corresponding data for the pigeye shark, which has similar biology; e.g., length-weight relationship and mean litter size. The pigeye shark is less common in Queensland but has been studied more intensively than the bull shark. We believed that using data from the pigeye shark was more accurate than using foreign data on the bull shark. The bull shark in the Gulf of Mexico (Cruz-Martínez et al.
2005; Neer et al. 2005) and South Africa (Wintner et al. 2002) appears to grow to smaller lengths than in Australia, even after allowing for the use of length measurements other than STL (fork length in North America and pre-caudal length in South Africa).
Pupping intervals (time interval between litters for a female shark) for large whalers appear not to have been studied in Australia and were set to two years on the basis of foreign studies (see list of studies in Table 5).
The pupping interval for the scalloped hammerhead Sphyrna lewini is unknown, because very few mature females of this species have been caught and the proportion that are gravid (pregnant) at any one time is impossible to estimate. It was set to one year, the same as the winghead shark Eusphyra blochii but different to the great hammerhead Sphyrna mokarran. We considered that the lack of observation of mature female scalloped hammerheads was probably due to their lifestyle during gravidity, and hence that they were likely to be gravid most of the time. Also the male life-cycle strategy hypothesised by Harry et al. (2011), whereby some males live inshore in order to mate with females that have just given birth (see above), is not likely to be successful if females have a year of rest before becoming gravid again. For the demographic model in Chapter 2, female scalloped hammerheads were assumed to give birth every year. Because so few mature females of this species have been caught, it was not possible to verify this assumption from any published studies.
Due to absence of Australian studies, foreign data had to be used for some population parameters of the common blacktip shark (Senegal, South Africa and south-eastern USA), spinner shark (Taiwan) and scalloped hammerhead (maximum observed age from south-eastern USA) (see list of studies in Table 5). Growth parameters for the common blacktip shark come from Wintner and Cliff (1996) with PCL converted to STL. In eastern Australia this species as recorded by Macbeth et al. (2009) obviously grows larger than indicated by the ageing study by Carlson et al. (2006) in south-eastern USA.
1.3
Regional structure of the assessment
This stock assessment of sharks is structured regionally, because the apparent abundance of sharks can change dramatically over quite a small area. The evidence from fishery data is that, for the shark species being assessed, individuals tend to cluster into particular preferred habitats (see, for example, the regional contrasts of species composition in Figure 10 on page 33 and the regional contrasts in catch rates in chapter 4). We note that the true spatial extent of regional populations may be even smaller than the Subregions defined below (Yates et al.
2012, 2015), but these Subregions are the smallest units on which standardised catch rates can be defined with reasonable accuracy from the available logbook data.
Apparent regional differences in species composition may be magnified by variation in the types of locations in which gillnets can profitably be set. Perceived differences in species composition between regions may be due partly to differences in fishing technique, but this does not remove the need to analyse the different regions separately. A clue to this phenomenon is that in many regions a shorter net has a higher average catch than a longer net, presumably because it can be set in a more suitable location (see chapter 4 below).
25
To reduce the statistical error in the standardised catch rates, we merged some LTMP regions into the final Subregions that were used in the population dynamic model in chapter 5 (see final column of Table 8). The regional structure of the assessment is listed in Table 8.
Table 8: Regional structure of the stock assessment: LTMP Regions are listed clockwise around the coast from the southern Gulf of Carpentaria, north to Cape York and then south to the New South Wales border. LTMP Regions that fall within the Great Barrier Reef Marine Park are marked *. The Torres Strait, Fraser Offshore and Brisbane Offshore Subregions were excluded from the assessment due to small catches, and are bracketed. Final Subregions which resulted from mergers of LTMP Regions are printed sideways in italics; the remaining Subregions comprised single LTMP Regions and retained their names.
Region Region abbr. LTMP Region LTMP Region abbr.
Gulf of Carpentaria Gulf Karumba Karumba
Pormpuraaw Pormpuraaw
Aurukun Aurukun
Weipa Weipa
Mapoon Mapoon
(Torres Strait) (TorresStrait)
North East Coast North Lockhart* Lockhart
Cooktown* Cooktown
Cairns* Cairns
Mission Beach* Mission
Lucinda* Lucinda
Bowen* Bowen
Mackay* Mackay
Stanage Bay* Stanage
Rockhampton Estuarine* RockEst Rockhampton Offshore* RockOff
South East Coast South Fraser Inshore FraserIn
(Fraser Offshore) (FraserOff) Sunshine Coast Offshore SunshineOff
Moreton Bay MoretonBay
(Brisbane Offshore) (Brisbane) Gold Coast Offshore GoldOff
1.4
The fishery
1.4.1 Historical commercial fisheries in Northern Australia
Soviet and Taiwanese trawl and gillnet fisheries previously operated off Northern Australia, comprising the Gulf of Carpentaria, the Northern Territory and northern Western Australia. Records of Soviet trawl catches of tropical red snappers exist for the years 1966–1977, in a database maintained by CSIRO, but we are not aware of any records of Soviet shark catches. More is known about the Taiwanese fish-trawl and gillnet fishery, which operated from 1974 to 1990 (Harwood et al. 1984; O’Neill et al. 2011).
Data on red snapper catches indicate that most of the Soviet fishing took place in Western Australian and Northern Territory waters, and very little in Queensland. The Soviet fishery has not been included in this stock assessment.
Estimation of the size of the Taiwanese harvest of sharks is undertaken in chapter 3 (section 3.1). The main point made there is that the harvests of sharks taken in Queensland waters
F
ar
N
or
th
W
hi
ts
unday
M
or
et
on
G
ul
26
appear to have been smaller than the levels that might be inferred from published literature, and may not have exceeded 1000 tonnes in any year.
A small Australian commercial gillnet fishery in Northern Australia began with the declaration of the Australian Fishing Zone in 1979, and by 1985 was catching 408t of sharks per year over the whole of Northern Australia (Davenport and Stevens 1988, quoting an Australian Bureau of Statistics report).
Data from Queensland Fish Board reports (Halliday and Robins 2007) show a landing of 3t of sharks from the GoC in financial year 1980–81, the final year before the Fish Board was disbanded, and no shark landings in any year prior to that.
1.4.2 Historical fishery on the Queensland East Coast
On the Queensland East Coast, the Queensland Fish Board (QFB) first recorded landings of sharks in 1974–75. The QFB was the government agency through which the harvest by law had to be marketed until 1981. It had various receiving stations along the Queensland coast, and data from its annual reports were collated by Halliday and Robins (2007). Some of the shark harvest levels were already stable by 1974–75 (i.e., did not increase much in the following years), especially from the reporting stations in the Fraser Inshore Subregion (Bundaberg and Tin Can Bay) and the Moreton Bay Subregion (Scarborough, Sandgate, Brisbane, Cleveland and Woongoolba). It is clear that the shark fishery had already been operating for some years on some parts of the East Coast, but the shark harvest was recorded as a separate category only from 1974–75 onwards.
Although marketing of fishery catches through the QFB was compulsory until 1980–81, it is probable that some of the shark catch was sold direct to local fish and chip shops without going through the Board, as fish and chips constituted a major use for shark meat at that time. Therefore the actual shark catch on the Queensland East Coast until 1980–81 was probably higher than the QFB data show.
There was also a major change in net technology in the 1970s, with the take-up of lightweight untarred nylon nets which allowed gillnet fishers to fish further from shore on the Queensland East Coast and actively target sharks. Therefore the catches of sharks may indeed have been very small prior to the mid-1970s, when many gillnet fishers using heavy nets were practically able to fish only rivers and estuaries (Dr Andrew Tobin, James Cook University, 2015, personal communication).
The classification of QFB data into the LTMP Regions from Table 8 is listed in Table 9, and the resulting annual catches of sharks are listed in Table 10. The QFB records used financial years (July to June). The largest QFB total recorded catch was 45 tonnes in 1980–81.
1.4.3 The current commercial fishery