final
re
port
p
Project code: B.NBP.0624
Prepared by:
Gavin Peck, Stuart Buck, Alex Hoffman, Chris Holloway, Brian Johnson, David Lawrence, Col Paton
Department of Employment, Economic Development and Innovation
Date published: October 2011
ISBN: 9781741916416
PUBLISHED BY
Meat & Livestock Australia Limited Locked Bag 991
NORTH SYDNEY NSW 2059
Review of productivity decline in
sown grass pastures
Improved Pastures
Abstract
Executive Summary
Productivity decline in sown grass pastures is widespread in northern Australia and reduces production by approximately 50%. The economic impact of the decline is estimated at over $17B over the next 30 years. Graziers, the seed industry and researchers are all concerned that this ‘rundown’ is continuing. This report recommends that Meat and Livestock Australia (and other agencies) invest in targeted research, development and extension (R,D&E) to mitigate the effects of pasture rundown. The returns from effectively reducing the impact of pasture productivity decline are significant.
Project objectives
Graziers in southern and central Queensland have become increasingly concerned about the continuing decline in productivity of their sown grass pastures, especially in the large areas dominated by buffel grass. This concern is shared by researchers and the red meat industry through Meat & Livestock Australia (MLA). Key research in the 1980s and early 1990s documented the decline in productivity as grass pastures age, and identified the underlying cause to be reduced available soil nitrogen for pasture growth. However, concern about the continuing decline in productivity suggests that current mitigation strategies and/or the way they are used on farms must be improved.
The review builds on this early research with more recent findings and commercial experiences to provide a contemporary overview of the primary causes, extent and impacts of sown grass pasture ‘rundown’, and to review the mode-of-action and cost-effectiveness of options for mitigating its impact. Extensive consultations with graziers, the seed industry, agronomists and pasture researchers provided data and experience to review these options and their economic impacts. Ultimately, the findings and recommendations of the review have been developed to inform R,D&E investment, that is, whether to invest and to identify the best ‘value propositions’ for mitigating the effects of rundown and lifting long-term pasture production and animal performance.
Significant results
Consultations confirmed that productivity decline in sown grass pastures remains a major issue across southern and central Queensland. This ‘rundown’ is most severe with buffel grass, northern Australia’s dominant sown species. Carrying capacity in older buffel pastures (>10-20 years since establishment) has declined by up to 50% in all districts. Many graziers believed this decline was continuing. The large reduction in animal production provides major incentive for future R,D&E investment to develop reliable solutions.
The decline in pasture productivity with age is directly attributable to a lack of available nitrogen in the soil as the nitrogen and other nutrients become ‘tied-up’ in soil organic matter, roots and crowns of old grass plants. This lack of available nitrogen limits dry matter production and may be exacerbated by overgrazing that leads to reduced pasture condition and land degradation.
economic returns for the beef industry and individual graziers is to establish a range of adapted legumes into the existing grass-only pastures. Establishing legumes into a grass pasture can reclaim 30-50% of the lost production from pasture rundown and improve economic returns.
There are clear opportunities for targeted RD&E programs to improve the reliability of establishment and productivity of legumes. Whole farm returns of up to $1,300/ha over 30 years, and benefit:cost ratios of 4 -10 provide a serious incentive to invest in RD&E. Key priorities for targeting future RD&E include:
1. Development and extension - Poor agronomy and variable results mean that establishing legumes into existing pastures is considered risky. Good agronomy using current technology may help ‘claw-back’ up to 30-50% of the productivity decline. However, significant D&E investment is needed to support graziers to:
Understand the process of rundown and ways to supply available N for better grass production;
Build knowledge and skills to apply economically feasible options using existing technology, and;
Assess and demonstrate the impacts of legumes and more available nitrogen on grass production, animal performance and the profitability of commercial properties.
A key part of any extension program will be to develop and support clear management packages for the best adapted and emerging legumes, such as desmanthus, caatinga stylo, Shrubby/Caribbean stylos, and medics with tropical grasses
2. Research – Existing technology and practices can improve legume establishment. However, several key areas of research are needed to ensure legumes reach their full potential:
Develop new ‘agronomically-sound’ techniques and adapt current technologies used in other agricultural systems to establish legumes in existing pastures. For example, cultivate or use herbicide to maintain fallow strips before sowing legumes into grass pastures.
Assess the nutritional requirements of pastures. The phosphorus nutrition of legumes and its effects on legume establishment, on-going growth & nitrogen fixation, and contribution to increased pasture production/animal performance is a clear priority.
Assess and compare the productivity of emerging and best-adapted legumes (including leucaena, desmanthus, caatinga stylo) across the range of soils and locations in Queensland.
3. Market adjustment – Legumes present the major opportunity to address pasture rundown. However, seed of key species (namely, caatinga and desmanthus) is often unavailable. The beef industry must address this ‘market failure’ in the short term to overcome rundown and sustain productivity into the future
Contents
Page
1
Background – Pasture Productivity Decline ...12
1.1 Introduction ...12
1.2 Grazing land condition ...13
1.3 The impacts of productivity decline in sown grass pastures ...13
1.3.3 Environmental impacts ...16
1.3.4 Economic impact...17
1.4 Process of pasture productivity decline ...17
1.4.1 Nitrogen losses in grass pastures ...17
1.4.2 Nitrogen cycle ...18
1.4.3 Grass species differences ...22
1.4.5 Phosphorus and other nutrients ...23
1.5 Conclusion...24
2
Project Objectives ...25
3
Methodology...26
3.1 Consultation ...26
3.1.1 Graziers...26
3.1.2 Seed industry ...27
3.1.3 Researchers and extensionists ...27
3.2 Spatial analysis ...27
3.2.1 Geographic extent of buffel grass pastures...27
3.2.2 Area suited to mitigation strategies ...28
3.3 Economic analysis ...30
3.3.1 Pasture production, stocking rates and animal performance...30
3.3.2 Property scale economic analysis ...31
3.3.3 Industry scale economic analysis ...34
3.4 Research, Development and Extension priorities ...35
4
Results and Discussion ...36
4.1 Grazier consultation...36
4.1.2 Symptoms of rundown...36
4.1.3 Causes of rundown ...38
4.1.4 Mitigation strategies used by graziers ...38
4.1.5 Limitations to addressing productivity decline ...39
4.2 Seed industry consultation ...39
4.2.1 Effect on the pasture seed industry...39
4.2.2 Legumes ...40
4.2.3 Inoculation...40
4.2.4 Seed coatings ...40
4.2.5 Investment in R,D & E ...41
4.3 Researcher consultation ...41
4.4 Overview of mitigation strategies ...43
4.4.1 Accept pasture rundown and manage with lower production ...43
4.4.2 Fertiliser ...44
4.4.3 Legumes ...45
4.4.4 Mechanical renovation ...46
4.4.5 Crop/pasture rotations...48
4.4.6 Herbicide renovation ...49
4.4.7 Grazing management...49
4.4.8 Fire ...49
4.4.9 Other grasses...50
4.4.10 Other options...50
4.5 Pasture and animal production responses to mitigation ... strategies ...51
4.5.1 Pasture production ...51
4.5.2 Animal production...55
4.6 Property scale economics of mitigation strategies...57
4.6.1 Economic returns for case study properties ...57
4.6.2 Mechanical renovation, fertiliser and herbicides...59
4.6.3 Legumes ...62
4.6.4 Mechanical renovation with and without legumes ...64
4.6.5 Land type impact on economic returns...65
4.7 Limitations to addressing pasture productivity decline ...69
4.7.1 Limitations of legumes for addressing pasture rundown ...72
4.7.1.1 Legume establishment in sown grass pastures ... 73
4.7.1.2 Legume persistence... 76
4.7.1.3 Legume adaptation ... 76
4.7.1.4 Nitrogen fixation ... 77
4.7.1.5 Rhizobium establishment... 77
4.7.1.6 Production ... 77
4.8 Research, development and extension needs identified... during consultation...77
4.8.1 Improved understanding of the impact of productivity decline...78
4.8.2 Develop sown pasture management packages and extension mechanisms ...78
4.8.3 Legumes ...78
4.8.4 Establishment of legumes ...78
4.8.5 Rhizobia establishment and survival ...79
4.8.6 Legume adaptation...79
4.8.7 Comparative productivity of legumes ...79
4.8.8 Impacts of grazing management on legumes...79
4.8.9 Ecology of buffel and adaptability of alternative grasses...79
4.8.10 Nutrition of pastures ...80
4.8.11 Impact of renovation strategies ...80
4.9 Research, development & extension priorities ...80
4.9.1 Improved use of existing mitigation technologies ...81
4.9.2 Reliable establishment of legumes...81
4.9.3 Improved production from legumes ...82
4.9.4 Adaptation of commercially available legumes...82
4.9.5 Legume seed supply ...82
4.9.6 Buffel grass physiology ...83
5
Success in Achieving Objectives...84
6
Impact on Meat and Livestock Industry ...86
6.1 Spatial Analysis...86
6.1.2 Potential area suited to mitigation strategies...89
6.1.3 Current area treated. ...91
6.2 Economic impact...91
6.2.1 Economic cost of rundown ...92
7
Conclusions and Recommendations...94
7.1 Pasture productivity decline ...94
7.2 Improving production ...94
7.3 R,D&E priorities...95
7.4 Value to industry ...96
7.5 Recommendations ...96
8
Bibliography ...98
9
Appendices...106
9.1 Appendix 1: Grazier consultation ...106
9.2 Appendix 2: Seed industry consultation...136
9.3 Appendix 3: Economic returns from mitigation strategies ...147
9.4 Appendix 4: Spatial data set descriptions. ...148
List of Figures:
Figure 1: Pasture dry matter on offer during 22 years since clearing. Measurements taken in October – December at the start of the growing season R2 =0.71, P<0.01, n=8. Y=8.21 – 2.83 ln (T)
where Y is dry matter and T is time after clearing. Measurements taken in May – July at the end of the growing season R2 =0.41, P<0.05, n=10. Y=7.19 – 1.62 ln (T) where Y is dry matter and T is
time after clearing. (Radford et al. 2007)... 14
Figure 2: Annual live weight gain per hectare subsequent to buffel grass establishment at a constant stocking rate of 0.59 head/ha. R2 =0.60, P<0.05, n=7. Y=122.8 – 4.23T where Y is LWG and T is
time after clearing.(Radford et al. 2007)... 15
Figure 3: Stocking rate and average daily live weight gain for cattle grazing buffel grass pastures during 21 years since clearing brigalow scrub (Radford et al. 2007). ... 15
Figure 4: Flow of nitrogen in the soil from organic to mineral (inorganic) forms. Only mineral forms can be taken up by plant roots. ... 19 Figure 5: Phosphorus availability (bicarbonate P) over time (Thornton et al. 2010). ... 23
List of Tables:
Table 1 : Average commercial steer performance from a range of pasture systems in central
Queensland (Middleton 2001). ... 16
Table 2: Changes in soil chemical attributes with clearing and burning of brigalow scrubs (Lawrence et al. 1994b). ... 20
Table 3: Nitrogen content of soil (0-30cm) and plant pools in a 14 year old buffel grass pasture in central Queensland (Graham et al. 1985)... 21
Table 4: Phosphorus requirements for maximum growth and persistence (Ahern et al. 1994)... 24
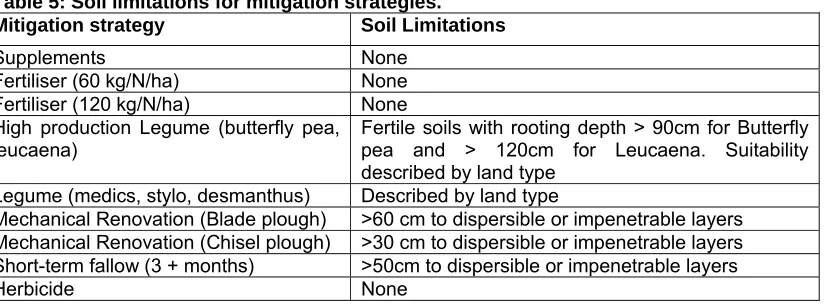
Table 5: Soil limitations for mitigation strategies... 28
Table 6: Rainfall requirements for legumes in different regions of Queensland. ... 29
Table 7: Utilisation and spoilage rates used for forage budgeting. The utilisation rate was applied to rundown buffel grass DM production to calculate a benchmark residual biomass for use with mitigation strategies (adapted from Whish 2010). ... 31
Table 8: Land type mix and size of case study properties which approximate a typical property for the respective district. Adapted from local consensus data (Clarke et al. 1992; Lawrence et al. 1994a) ... 31
Table 9: Stocking rate (SR) and gross margins for native pastures for the case study properties (Best 2009)... 32
Table 10: Mitigation strategy costs... 33
Table 11: Case study locations and the grazing land management (GLM) regions to which their economic returns were applied... 34
Table 12: Estimates of the carrying capacity since sown pastures were established (where current carrying capacity is described as a percentage of the carrying capacity when pastures are first established)... 37
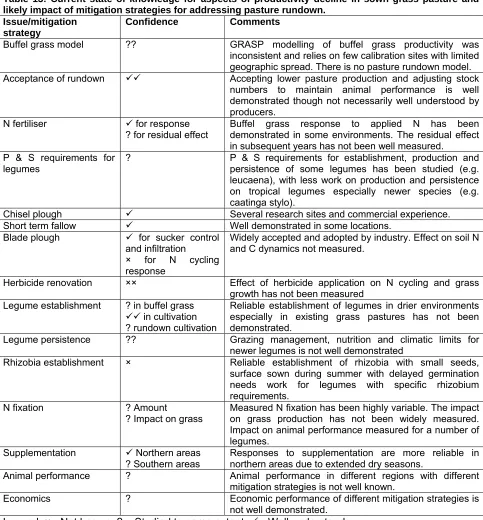
Table 13: Current state of knowledge for aspects of productivity decline in sown grass pasture and likely impact of mitigation strategies for addressing pasture rundown. ... 42
Table 14: Broad relative rating of pasture grasses nitrogen requirements for persistence, reproduction and growth based on qualitative observations (Peck and Chamberlain 2001). This table attempts to give a relative rating for plants growing on soils and climates they are adapted to.50 Table 15: Average annual pasture production for ‘rundown’ buffel grass pastures at four locations in Queensland. Utilisation rates were used to calculate stocking rates and end of dry season residual biomass. Spoilage was estimated at 20% for high fertility soils and 15% for medium and low fertility.52 Table 16: Assumed rates of average annual pasture production, as a percentage of that for rundown buffel grass pasture, for environments at Moura, Glenmorgan, Clermont and Tambo. (Confidence ratings H – high, M – medium, L – low)... 53
Table 17: Legume establishment periods, spelling requirements and production levels for different establishment techniques used in production and economic modelling... 54
Table 18: Average annual cattle live weight gains for ‘rundown’ buffel grass and for each mitigation strategy. Animal performance for mitigation strategies is expressed as kg live weight gain benefit compared to rundown buffel. Leucaena and legume figures are for fully established pasture... 56
Table 19: Glenmorgan economic returns for selected mitigation strategies assuming the whole property was one soil fertility. These values approximate returns that could be expect for individual paddocks of uniform land type... 65
Table 20: Clermont economic returns for selected mitigation strategies assuming the whole property was one soil fertility. These values approximate returns that could be expect for individual paddocks of uniform land type. ... 66
1 Background – Pasture Productivity Decline
1.1 Introduction
Sown pastures have been very successful in northern Australia. Well adapted sown pastures enable higher productivity and profitability in grazing enterprises because they can produce more feed, of a better quality, for a longer period of the year than native pastures (Quirk and McIvor 2005). They have been widely sown and continue to improve production and economic returns from grazing, especially the beef industry (Chudleigh and Bramwell 1996; Walker et al. 1997).
The precise area of sown pastures across northern Australian is unclear. Initial estimates were optimistic, with over 41M ha of land in Queensland and a further 6M ha across the rest of northern Australia considered suitable for sown pastures (Walker et al. 1997; Walker and Weston 1990;
Weston et al. 1984). This was subsequently reduced to 22.1M ha of “easily attainable” sown
pastures in Queensland, and a further 0.5M ha across northern Australia (Walker et al. 1997;
Walker and Weston 1990). Over 5M ha of sown pastures had been developed across Queensland and northern Australia by 1997, with these species naturalising onto a further 5M ha. The net annual increase of 210,000 ha (Walker and Weston 1990) is now estimated to be 150,000 ha/year due to restrictions on tree clearing and land development. If sown pasture areas have increased by 150,000 ha/year since 1997, the current area of sown pastures in northern Australia is approximately 12M ha.
Most sown pasture development in inland Queensland has occurred on fertile soils that have been cleared of brigalow and gidgee woodlands. It is estimated that up to 70% of the total area planted have been sown to “grass-only” pastures (Walker et al. 1997; Walker and Weston 1990). Buffel
grass is the main species, comprising over 75% of the area sown to tropical grasses. There are significant areas of other grasses such as Bambatsi panic, purple pigeon grass, green and Gatton panic, Rhodes grass, signal grass and creeping blue grass; with lesser areas of digit grasses, setaria and sabi grass.
The productivity of native and sown pastures in northern Australia has been widely observed to have declined over time. This decline results from changes in land condition that can affect both native and sown pastures, and changes in available soil nitrogen (N) that mainly affects sown grasses and leads to “pasture rundown” (Myers and Robbins 1991; Pressland and Graham 1989; Tothill and Gillies 1992).
1.2 Grazing land condition
Grazing land condition is defined as “the capacity of land and pasture to respond to rain and produce useful forage” and has three components (Quirk and McIvor 2005):
Soil condition – the capacity of the soil to absorb and store rainfall, to store and cycle nutrients, to provide habitat for seed germination and plant growth, and to resist erosion. It is measured by the amount of ground cover, and the condition of the soil surface;
Pasture condition – the capacity of the pasture to capture solar energy into green leaf, to use rainfall efficiently, to conserve soil condition and to cycle nutrients. It is measured by the types of perennial grasses present, their density and vigour; and
Woodland condition – the capacity of the woodland to grow pasture, to cycle nutrients and to regulate groundwater. It is measured by the balance of woody plants and pasture.
Grazing land condition directly affects rainfall use efficiency, and therefore, pasture growth of a managed parcel of land. Pasture condition is primarily determined by the presence or absence of perennial, productive and palatable (3P) grasses. Other determinants are the presence or absence of annual grasses and weeds.
The definition of land condition theoretically includes pasture rundown as reduced nutrient availability reduces rainfall use efficiency. However, in practice land condition does not measure nutrient availability and land condition can change independently of nutrient availability.
The major management factor to influence land condition over time is grazing management. Excessive grazing pressure, particularly in times of stress and when pastures are regrowing (e.g. when young growing tillers emerge at the beginning of the growing season), can cause land condition to decline. Land condition can change independently of the amount of nitrogen (and other nutrients) cycling at any point in time and nutrient rundown occurs even when land condition is maintained at a high level.
Land condition and pasture rundown clearly interact and a reduction in land condition will exacerbate the rundown process. However, it is important to separate the two processes to understand their impacts. Most of the remainder of this review will deal with nutrient rundown independent of land condition.
1.3 The impacts of productivity decline in sown grass pastures
Sown pasture grasses are very productive when they are planted after clearing or into fertile cropping soils. However, the productivity of these pastures typically declines with time, a phenomenon often described as “pasture rundown”.
The large quantities of dry matter produced in this initial pasture phase is a response to the high levels of available N and water that accumulate on fertile soils during a fallow prior to planting. However, dry matter production and subsequent animal performance decline as the available N reserves decline and become less available to pasture grasses (Graham et al. 1985; Jones et al.
1995; Myers and Robbins 1991). Some authors suggest that the “rundown” state indicates the ecological limits of productivity and should be considered the “normal” or unamended level of production for the rainfall and soil fertility of the location (Burrows 1991; Dubeux et al. 2007; Myers
Researchers, graziers and their advisers in the wider grazing industry recognise the symptoms of pasture “rundown” and its impacts on:
Pasture and animal production through reduced pasture growth, reduced carrying capacities and lower weight gains that make it difficult to reach market specifications;
Pasture composition with more native grasses and exotic grasses that are tolerant of lower nitrogen levels (e.g. sabi grass, Indian couch);
Pasture density with smaller and / or fewer tussocks of sown grasses;
Land degradation from reduced ground cover and higher erosion risk; and ultimately
Economics and long-term profitability.
This report focuses on the “pasture rundown” effect, its impacts and the options to address pasture productivity decline in grass pastures. The processes involved in pasture rundown are described in more detail below.
1.3.1 Pasture and animal production impacts
The annual dry matter production from sown grass pastures can decline by 50 – 60% within five to ten years of establishment across a range of soil and seasons (Figure 1) (Graham et al. 1981;
Jones et al. 1995; Myers and Robbins 1991; Radford et al. 2007; Robbins 1984; Robbins et al.
1987; Robbins et al. 1986).
Animal production shows a similar trend with a linear decline of 20-70% in live weight gains over the first five years of pastures when stocking rates are held constant (Figure 2) (Jones et al. 1995;
Radford et al. 2007; Robbins et al. 1987; Rudder et al. 1982). However, individual animal
performance can be maintained if stocking rates are reduced (Figure 3) (Burrows 1991; Radford et al. 2007). Graziers consulted in this review confirm that carrying capacities decline by up to 50% as
their sown grass pastures age. These declines in both pasture and animal production are clearly reflected in the lower live weight gains and reduced stocking rates commonly experienced as buffel grass pastures ‘rundown’ on commercial properties (Table 1).
Figure 1: Pasture dry matter on offer during 22 years since clearing. Measurements taken in October – December at the start of the growing season R2 =0.71, P<0.01, n=8. Y=8.21 – 2.83 ln (T) where Y is dry matter and T is time after clearing. Measurements taken in May – July at the end of the growing season R2 =0.41, P<0.05, n=10. Y=7.19 – 1.62 ln (T) where Y is dry matter and T is time after clearing. (Radford et al. 2007)
Pasture dry matter over time (Oct - Dec)
0 2 4 6 8 10
0 2 4 6 8 10
Time after clearing (years)
D ry m a tte r (t/ h a ) .
Pasture dry matter over time (May - July)
0 2 4 6 8 10
0 5 10 15 20 25
Time after clearing (years)
Figure 2: Annual live weight gain per hectare subsequent to buffel grass establishment at a constant stocking rate of 0.59 head/ha. R2 =0.60, P<0.05, n=7. Y=122.8 – 4.23T where Y is LWG and T is time after clearing.(Radford et al. 2007)
Figure 3: Stocking rate and average daily live weight gain for cattle grazing buffel grass pastures during 21 years since clearing brigalow scrub (Radford et al. 2007).
Livew eight productivity - constant stocking y = -4.2323x + 122.8
R2 = 0.6025
0 20 40 60 80 100 120
0 2 4 6 8 10 12
Time after clearing (years)
LW G ( k g /h a /y ear ) . . 0 0.2 0.4 0.6 0.8
0 5 10 15 20 25
Time after clearing (years)
Table 1 : Average commercial steer performance from a range of pasture systems in central Queensland (Middleton 2001).
Kg live weight gain per year Forage system Av stocking rate
(ha/Beast) Per steer Per ha
Native pasture 4 100-140 25-35
Native pasture - stylo 4 140-170 35-45
Buffel grass – new 2 170-190 85-95
Buffel grass – rundown 3 140-150 45-50
Leucaena – buffel 1.5 250-280 165-185
1.3.2 Pasture composition changes
Pasture composition changes in response to rundown and a lack of available mineral N (Burrows 2001; Jones et al. 1995; Myers and Robbins 1991). Indeed, soil nitrogen status may determine
competitive advantage of different sown grass species. Over large areas of Queensland, Rhodes grass and green panic were sown, initially dominated pastures but have since commonly been replaced by buffel grass (Appendix 1). Drought, grazing management and N availability have all contributed to this change in composition, however Rhodes grass and green panic initially tolerated drought and high grazing pressure but are less resilient to stresses after N availability declines (Jones et al. 1995). As N availability has declined further there has been an increase in native
grasses and exotic grasses that are more tolerant of low fertility (e.g. Sabi grass, creeping blue grass, Indian couch) in buffel grass pastures.
All pasture grasses will produce more dry matter with increasing levels of available N. Some species, including many of the early introduced pasture grasses from the Panicoid genera (e.g. green panic) are very responsive to additional nitrogen and become more competitive in soils with high available nitrogen. Conversely, some of the more recently introduced pasture grasses (e.g. creeping bluegrass, floren bluegrass) can tolerate lower levels of available N and will become more competitive in rundown pastures (Burrows 2001).
These changes may exacerbate the effects of rundown on pasture condition, but they do not cause rundown per-se.
1.3.3 Environmental impacts
Silburn et al. 2009; Silburn et al. 2007). Australia’s grazing industries have long struggled to balance
grazier’s and the community’s expectations of high production and the need to maintain natural resources (McKeon et al. 2004; Pressland and Graham 1989). “Rundown” pastures contribute to
over-utilisation of pastures, erosion and subsequent land degradation through:
High expectations of long-term production. Very high initial production from sown grass pastures after planting can lead to un-realistically high expectations of their long-term productivity and attempts to maintain unsustainable stocking rates.
Reduced pasture vigour and density leading to low ground cover and increased risk of erosion. Land degradation will occur unless grazing pressures are reduced in line with the reduction in forage production.
Reduced resilience of pasture grasses. When N availability declines many sown grass species (e.g. Rhodes grass, green panic) become less competitive, less resilient to drought, less tolerant of grazing and subsequently die out (Jones et al. 1995). Ground cover is
generally maintained when this change is gradual. However, if rundown pasture swards die out during drought conditions, the soil may be left with little ground cover and an increased risk of erosion until the paddock is recolonised by perennial grasses.
1.3.4 Economic impact
Reduced carrying capacities and reduced animal performance combine to dramatically reduce the economic returns from sown pastures as they age. Reductions in animal production per hectare of 50% undoubtedly have a severe impact on economic returns at the property and industry scale. Graziers consulted during this project suggested that:
Returns are tight. There is a need to improve productivity to counter increasing input costs. Some graziers feel compelled by poor economic returns to increase stock numbers to unsustainable levels.
Many of the current options to address productivity decline have marginal returns. However, these graziers recognised that doing nothing may be more expensive. For example, “There’s gotta be an answer…. We can’t keep going down and down and down”.
Cash flow is important and returns from mitigating rundown may take several years to recoup costs.
Increasing land values are intensifying agricultural production.
1.4 Process of pasture productivity decline
Productivity decline in well established sown grass pastures can be directly attributed to a reduction in the supply of available N in the soil. There is no measurable net loss of total soil N associated with rundown in extensive pastures, rather there is uptake of the available N by the pasture grasses and a reduced rate at which N is released from organic forms in the soil (Graham et al. 1981;
Robertson et al. 1997). In these systems, the net loss of nutrients, including nitrogen, is very small.
1.4.1 Nitrogen losses in grass pastures
The amount of nitrogen exported through removal of animal products is small in extensive grazing situations (Radford et al. 2007). However, nitrogen can be lost from the pasture sward through:
Nutrient redistribution (Dubeux et al. 2007). Grazing animals influence nutrient cycling
through ingestion of pasture and excretion to soil, and therefore availability through redistribution within the pasture system. In warm climates, nutrients accumulate near shade areas and to a lesser extent around watering points. While total nitrogen levels of the pastures remain the same, N availability to pasture grasses is changed with higher levels of N in relatively small proportions of total land area; and
Nutrient removal in harvested grain, hay and silage can be high in mixed farming systems. Each tonne of cereal grain contains approximately 20 kg of N and 3-4 kg of Phosphorus (P) which can lead to nutrient deficiencies and lost production in subsequent pastures (Bell et al.
2010).
Farming system studies have confirmed that nitrogen export through product removal under grazing is low relative to other agricultural land uses. Over 22 years “The Brigalow Catchment Study” in central Queensland reported N removal rates of 1.6 kg N/ha/yr for cattle grazing buffel grass pasture compared to 36.1 kg N/ha/yr in grain (Radford et al. 2007). Indeed, more nitrogen was lost in runoff
from the catchments. In the first 5 years after clearing brigalow scrub, N removed in runoff water was 11.4 kg N/ha/yr for the cropping catchment and 3.4 kg N/ha/yr for the grazing catchment (Cowie 1993). The cleared grazing catchment recorded double the annual runoff measured in the remnant brigalow catchment, increasing the risk of erosion and transport of nutrients (Thornton et al. 2007).
These losses of approximately 5 kg N/ha/yr under grazing did not contribute to a significant decline in measured Total Soil N. However, there was a dramatic decline in pasture productivity which was attributed to reduced N availability (Radford et al. 2007).
In summary, N availability has a much greater impact on pasture production than nutrient removal (Graham et al. 1981; Jones et al. 1995; Myers and Robbins 1991; Robertson et al. 1997). Graziers
will ultimately need to replace the nutrients removed through beef production. However, the amounts are small and can be replaced through currently available practices. For example, P supplementation of stock is sufficient to replace the amount of P removed in animal products and legumes are capable of fixing many times the amount of N removed in animal products (Burrows 1991; Cameron 1996; Clarkson et al. 1987; Jones et al. 1996; Radford et al. 2007).
1.4.2 Nitrogen cycle
The largest pool of nitrogen (N) is the earth’s atmosphere which is nearly 80% nitrogen. Nitrogen is often the first nutrient to limit pasture growth because atmospheric nitrogen is not directly available to plants, it is however available to nitrogen-fixing bacteria. Nitrogen cycles through organic and inorganic forms almost entirely through living organisms and soil organic matter (Figure 4).
Plants can only use the mineral forms of nitrogen in soil, mostly nitrate-N and to a lesser degree ammonium-N, that typically comprise up to 2% of the total N reserves in the soil (Harmsen and Kolenbrander 1965).The majority of soil nitrogen is in organic matter, which accumulates primarily from plant and animal materials falling on the soil surface and being incorporated by the soil fauna and flora. The large pool of organic matter is made available to plants when it is mineralised, firstly to ammonium and then nitrate, by soil microbes with some nitrogen being lost from the soil as gas in the form of nitrous oxides (Rosswall 1976).
Pastures legumes can fix significant amounts of N in the right circumstances (Section 4.4.3) in a range from zero (with no legume present) to >100kg N/ha/yr with good legume growth (Peoples et al. 2001).
Other symbiotic N fixation (e.g. lichens and rhizosphere endophytes) is capable of fixing small amounts (<10 kg N/ha/yr) (Nelson and Roth 2004; Unkovich and Baldock 2008).
Asymbiotic fixation contributions of N is likely to be <10kg N/ha/yr and generally not of agronomic significance across most of Australia with higher rates possible in tropical high rainfall regions (Unkovich and Baldock 2008).
Rainfall. Small amounts of mineral nitrogen can be added to the soil through rainfall with estimates in the range of <1 to <10 kg N/ha/yr(Ladd and Russell 1983; Nelson and Roth 2004).
Figure 4: Flow of nitrogen in the soil from organic to mineral (inorganic) forms. Only mineral forms can be taken up by plant roots.
levels of available soil nitrate-N depend on concurrent processes that mineralise further organic matter to replenish available nitrogen, and immobilise available nitrogen when low quality organic matter (i.e. high in carbon and low in N) is added to the soil (Lawrence et al. 2009). The rate of N
cycling and mineralisation are favoured by high soil organic matter levels, low C:N litter, large microbial populations and conditions that support greater microbial activity, namely warm and moist conditions (Jacobsen et al. 1992).
Clearing, burning and fallowing brigalow scrubs before establishing sown pastures dramatically accelerated the physical, chemical and microbial breakdown of vegetation and organic matter that had accumulated over millennia releasing large amounts of plant available nutrients (Table 2). Consequently, sown pastures were widely developed on soils with very high levels of available plant nutrients, for example nitrate-N levels of up to 300 kg/ha and total organic carbon levels up to 3.5% (D. Lawrence, unpublished soil test data). These soils can sustain a high level of available nitrogen and a massive initial ‘flush’ of production that lasts for many years. However, even on these fertile soils, pasture productivity will ‘rundown’ over time (Radford et al. 2007; Robbins et al. 1987; Robbins et al. 1986).
Table 2: Changes in soil chemical attributes with clearing and burning of brigalow scrubs (Lawrence
et al. 1994b).
Quantity (kg/ha) Organic
Carbon
Total N Available N
Available P
Exchangeable K
Pre-clearing 23200 2280 9 13 200
Post-clearing 20450 2020 67 40 340
Change % -12 -11 +690 +230 +75
Pasture productivity subsequently declines as there is a progressive reduction in the amount of N mineralised each year until an equilibrium is reached (Graham et al. 1981; Myers and Robbins
1991; Robbins et al. 1986). The clay soils of southern and central Queensland typically mineralise
over 100 kg N/ha/yr when they are first fallowed (Dalal and Mayer 1987). However, as sown pasture grasses mature and become denser there are large amounts of litter from the pasture added to the soil and available nitrogen declines (Dalal et al. 2005). Increasing competition between the
developing pasture and microbes means that net mineralisation and available soil nitrogen levels continue to decline. Comparative field measures of mineralisation in the top 10 cm of a red kandosol at St George from January to May 2004 increased from 12.5 kg N/ha under native mulga to 20.2 kg N/ha in a new buffel grass pasture, but decreased to 5.6 kg N/ha in a 20-year old buffel grass pasture (Mathers and Dalal 2004). These low soil nitrate-N levels have also been observed in older central Queensland buffel pastures (Graham et al. 1985) (Table 3), and soil testing in southern
Table 3: Nitrogen content of soil (0-30cm) and plant pools in a 14 year old buffel grass pasture in central Queensland (Graham et al. 1985).
Component Kg N/ha Percent of
total.
Grass tops 21 0.63
Grass litter 4 0.12
Grass root 207 6.17
Microbial biomass 152 4.53
Soil Mineral N 10 0.30
Soil Organic N 2960 88.25
Total 3354
Several mechanisms contribute to reduced N cycling and subsequently lower available N for on-going production in sown grass pastures:
i. Stabilisation of N in soil organic matter and clay (Robertson et al. 1997). Soil organic matter levels increase if organic carbon is added to the soil at a faster rate than microbes break it down. Microbial activity will break down this coarse ‘labile’ organic material and mineralise any N excess to their needs. However, some N will also be ‘locked away’ or immobilised in humic carbon fractions that must be later mineralised over decades for the contained N to become available to plants. After repeated decomposition, a nutrient rich but ‘resistant’ carbon fraction develops that may take hundreds of years to decompose and mineralise N (Bell and Lawrence 2009).
ii. Immobilisation of N in plant litter (Robbins et al. 1989). Tropical C4 grasses have higher
Carbon:Nitrogen (C:N) ratios than C3 grasses and produce large amounts of biomass resistant to decomposition. The amount of N in litter increases with pasture age which reduces the amount of N available for plant uptake. In a 16 year old green panic pasture, approximately 50% of plant N occurred in dead tissues (Robertson et al. 1993).
iii. Competition for available N between the pasture plant and soil microorganisms (Myers et al.
1986). Accumulation of root and litter residues with high C:N ratios results in a large microbial biomass which has a high demand for N and can compete with pasture plants for available N. For example, significant amounts of N are immobilised as dry grass and crop stubbles (with C:N ratios of up to 100:1) are decomposed and carbon respired. As organic matter decomposes it eventually forms nutrient rich, stable (resistant to decomposition) humic carbon complexes with C:N rations of approximately 12:1 (Bell and Lawrence 2009). Microbes may out-compete pasture grasses for available N in the short-term. However, the microbial biomass is dynamic and by the end of growing season the grass can accumulate dramatically more N than the microbial biomass (Graham et al. 1985; Robertson et al. 1997).
Experiments using 15N labelled ammonium sulphate on green panic pastures have shown that the
reduction in N availability and hence pasture productivity is due primarily to immobilisation of N in soil organic matter and clay; plant material; and to a lesser extent soil microbial biomass (Robertson
1.4.3 Grass species differences
While grass species differ in the response to available N, they also affect N cycling through the amount and quality of the litter they produce (Jones et al. 1995; Robbins et al. 1989; Wedin and
Tilman 1990). For example, C4 grasses produce large amounts of poor quality, high C:N ratio litter, that is resistant to decomposition (Dubeux et al. 2007). This effect is more severe as the pastures
age, and their N content and quality decline to further reduce N cycling (Robbins et al. 1989).
In Minnesota (USA), monocultures of five locally abundant perennial grass species (both C3 and C4 species) established on initially identical soils resulted in a 10 fold difference in annual net nitrogen mineralisation rates by the third year (Wedin and Tilman 1990). The impact of commonly sown grasses on mineralisation in Australia has not been demonstrated, however grasses with higher C:N and root:shoot ratios may lead to greater reductions in N availability.
1.4.4 Productivity trends in grass/legume pastures
Grass/legume pastures have the potential to fix atmospheric nitrogen and therefore sustain higher levels of production than grass-only pastures. Nitrogen fixed by legumes in the pasture will improve feed quality and ultimately contribute more available nitrogen to grasses for dry matter production. However, the feasibility of developing and maintaining resilient and productive sown grass/legume pastures over long periods (e.g. >15-20 years) with few management inputs in northern Australia has been questioned (Walker et al. 1997).
There is little quantified information on the longer-term stability or resilience of sown grass/legume pastures or native pastures over-sown with legumes (Walker et al. 1997). However, there are
several examples of reduced productivity, stability or resilience in legume/grass pastures (McIvor et al. 1996; Walker et al. 1997):
Productivity decline after the establishment phase of leucaena/grass pastures has been reported (Radrizzani et al. 2007). The decline has been attributed to reduced supply of
phosphorus and sulphur (Radrizzani et al. 2010);
Legume dominance has been reported in grass pastures over-sown with stylos and round leaf cassia (McIvor et al. 1996; Miller and Stockwell 1991). Legume dominance can result in
less resilient pastures (e.g. more prone to erosion) and lower production through reduced grass production. High legume content exposes animals in frost prone areas to severe feed shortages in cold, dry winters (Burrows 1991).
Lack of persistence and production of pasture legumes with buffel grass pastures have been reported by graziers (Appendix 1). High legume content and dry matter production are required to fix large amounts of N and significantly increase grass growth. However, management practices that promote legume content (e.g. heavy grass utilisation in summer to promote medic establishment in southern Queensland) may increase the risk of feed shortages in subsequent dry winters (Clarkson et al. 1991).
Over-grazing either the legume or grass component of pastures. For example, grasses have been grazed out in some stylo pastures and siratro has been grazed out of grass pastures (Quirk and McIvor 2005). Inadequate soil P is also commonly implicated in the legume component’s decline.
especially nutrient management for the legume component, is a key consideration to establish and maintain productive grass/legume pastures.
1.4.5 Phosphorus and other nutrients
Legumes generally require more P and S than their companion grasses, therefore fertility management is important to maintain high levels of legume production and N fixation. In contrast to legume augmented pastures in southern Australia, fertilisers are rarely used on tropical pastures in northern Australia. The use of fertiliser to maintain productivity in sown grass/legume pastures is likely to become more important for pasture managers in northern Australia.
Phosphorus cycling in pasture systems is more complex than N cycling. Biological decomposition of organic matter contributes some P but most of the plant available P comes from mineral sources and depends on the P sorption potential of soils and the balance between strongly and weakly ‘held’ pools of phosphorus (Dubeux et al. 2007). As with N, the availability of P and other nutrients have
an initial flush in availability (the ‘run-up’) when vegetation is cleared and cultivated but there is a decline as pasture ages. Figure 5 shows trends within 3 catchment areas at Brigalow Research Station. As P accumulated in plant material and soil organic matter, the more readily available Colwell bicarbonate P in the soil declined from the initial flush at clearing. While not shown, acid extractable P declined in a similar manner to bicarbonate P (C. Thornton pers. comm.). The
cropping catchment has not had fertiliser applied and in comparison to the buffel grass catchment has higher levels of available P indicating that P availability declines under continuous pasture, while available P remains higher with cropping due to greater decomposition of organic matter.
Bicarb. P
0 5 10 15 20 25 30 35 40
-5 0 5 10 15 20 25 30
Time since clearing (years)
mg
/k
g
C1 - Virgin brigalow forest C2 - Cleared then cropped C3 - Cleared then grazed pasture
Figure 5: Phosphorus availability (bicarbonate P) over time (Thornton et al. 2010).
persistence. Grass competition further restricts their productivity and persistence on low P soils because legumes generally require higher soil phosphorus levels than their associated grasses (Table 4).
On moderately fertile brigalow soils of southern and central Queensland, decline in P availability has occurred widely due to both removal in grain and other crop products and from “tie-up” in organic matter, reaching levels that restrict legume growth, e.g., < 15ppm. Recent unpublished studies of soil carbon on 100 sites across southern Queensland with a range of land uses and histories revealed Bicarbonate P levels (0-10 cm) as low as 3 ppm, with 50% of the sites below 15 ppm, and 25% below 10 ppm (unpublished data, D. Lawrence pers. comm.).
Table 4: Phosphorus requirements for maximum growth and persistence (Ahern et al. 1994). Legume P requirement (Colwell P, mg/kg)
Leucaena* > 25
Seca stylo > 8 (>3mg/kg for any growth) Verano stylo 8-12
Siratro 10-14 (* S. Buck pers. comm.)
The amount of N fixed by legumes is directly related to their biomass production (Peoples et al.
1995). Improved nutrition, strategic grazing and other practices can increase legume growth and the amount of N fixed in grass/legume pastures, and such practices must become more widely used to sustain their positive impacts on productivity. However, this will require a better understanding of the costs and benefits of applied P to tropical grass/legume pastures.
1.5 Conclusion
2 Project
Objectives
Graziers in southern and central Queensland continue to be concerned about declining productivity in sown grass pastures. This concern is shared by Meat & Livestock Australia (MLA) and the Queensland government through the Department of Employment Economic Development and Innovation (DEEDI).
Research has documented this decline in productivity and identified the underlying cause to be a lack of available soil nitrogen as pastures age. However, the continuing decline and its impact on northern Australia’s most widely sown species (buffel grass) suggests that current mitigation strategies and/or the way they are used on farms must be improved.
The review builds on past research. It includes more recent research findings and graziers’ experiences to better understand the extent of the decline, and assess the impacts of mitigation options on commercial properties. Specifically, the project provides:
1. A concise overview of the primary causes, extent and economic impacts of sown pasture ‘rundown’.
2. A review and evaluation of the mode-of-action and cost-effectiveness of options for abating the impact of sown pasture ‘rundown’, including those currently practiced and any others that have potential value.
3. An assessment of the technical and other (e.g. adoption) issues that constrain the cost-effective abatement of sown pasture ‘rundown’, and the likelihood of overcoming these constraints through additional research, development and extension.
4. The priority areas for future research, including the likely economic benefit to industry of pursuing these.
3 Methodology
The review involved consultation with key groups within the grazing industries (graziers, researchers, seed companies and merchant resellers), literature review, spatial analysis, economic analysis and prioritisation of RD&E needs. Aspects of productivity decline in sown grass pastures have been studied in detail (e.g. process of rundown) while other aspects have received little attention (e.g. relative N fixation of commercially grown legumes) (Myers and Robbins 1991; Walker
et al. 1997). This project builds on past and current industry supported projects, technical expertise
across agencies and experiential knowledge of graziers and agri-business in reviewing the current state of knowledge of productivity decline.
The components of the review were:
1. Literature review. Scientific literature is referenced throughout this report.
2. Consultation with graziers, researchers, pasture seed industry and merchant resellers. 3. Spatial analysis of the current extent of buffel grass and potential area suitable for mitigation
strategies.
4. Economic analysis of mitigation strategies at the farm and whole of industry scales. 5. Prioritisation of Research, Development and Extension needs.
3.1 Consultation
This project had a strong emphasis on consulting with key stakeholders to gain access to published and un-published information, experiential knowledge and to document the results of strategies currently being trialled or used by landholders and industry. The consultation process is summarised below.
3.1.1 Graziers
Graziers across southern and central Queensland were consulted to document their experiences with pasture productivity decline and mitigation strategies to address pasture rundown on their properties. During March and April 2010 six focus group meetings were held with graziers in southern and central Queensland to discuss productivity decline in sown pastures. Meetings were held in Moura, Rolleston, Clermont, Roma, Nindigully and Wandoan.
At the focus group meetings graziers discussed the following questions: 1. What’s the extent of productivity decline?
How big a problem is it for your business? How does it affect your business?
2. How do you manage productivity decline in sown pastures? What has been tried?
What are the results?
What are the main reasons for success or failure?
3. What are the biggest limitations to overcoming productivity decline?
3.1.2 Seed industry
The seed industry was consulted via a semi-structured interview conducted by telephone. The initial questions asked were:
1. What is the extent of sown pasture or productivity rundown with your clients? 2. How does it affect the seed industry (your business) and your clients? 3. How do you advise clients to manage rundown in sown pastures?
4. What are your thoughts on the practicalities and impacts of perennial legumes? 5. What's the biggest limitation to overcoming rundown in Queensland pastures?
3.1.3 Researchers and extensionists
A workshop was held with key research and extension personnel to provide expert opinion and identify published and/or un-published sources of information. The key outputs from the workshop were expert opinion on:
The likely pasture and animal response of pasture productivity decline and mitigation strategies. Level of knowledge and certainty of responses was also discussed.
Identification of which land types support buffel grass pastures across Queensland. Legume suitability by land type across Queensland.
Key knowledge gaps in scientific literature.
R,D&E priorities for sown pasture productivity decline.
3.2 Spatial analysis
Spatial analysis was used to estimate the geographic extent of buffel grass pastures in Queensland, the area suited to mitigation strategies and regional sown pasture production.
3.2.1 Geographic extent of buffel grass pastures
Knowledge of the geographic extent of sown grass pastures is necessary to estimate the costs of productivity decline and the likely benefits from mitigation strategies. Previous authors have calculated that of the total area of sown pastures, 70% were sown with grass only and that buffel grass representing more than 75% of that area (Walker et al. 1997; Walker and Weston 1990). This
project therefore decided to focus on improving the estimation of the area of buffel grass pastures in Queensland.
Improved estimation of the extent of buffel grass compared to previous estimations e.g. (Lawson et al. 2004; Weston et al. 1984) is now possible due to improved mapping. The extent of buffel grass
map is based on the following linkages and assumptions:
Buffel grass densities were linked to grazing land types (Whish 2010) by a panel of experts. The spatial extent of grazing land types have been mapped by linking the description to
regional ecosystem mapping.
Land use mapping was used to exclude those land uses which would exclude buffel grass pastures e.g. cropped land.
It is assumed that buffel has spread and established on land types it is adapted to. This assumption is supported by the observations of the experts involved in the researchers’ workshop.
Descriptions of the spatial data sets used are provided in Appendix 4.
3.2.2 Area suited to mitigation strategies
Soil limitations were described for mitigation strategies (Table 5) and linked to land type descriptions. For suitability of leucaena and butterfly pea it is recognised that there is an interaction between climate and plant available water-holding capacity (PAWC) requirements. That is, a requirement for higher PAWC in drier environments to meet requirements for persistence and production. Similarly, there is interaction between clay content, soil structure and soil depth on PAWC, and therefore required rooting depths. The rooting depths required in drier districts that leucaena and butterfly pea are suited to was used for developing Table 5.
Table 5: Soil limitations for mitigation strategies. Mitigation strategy Soil Limitations
Supplements None
Fertiliser (60 kg/N/ha) None
Fertiliser (120 kg/N/ha) None
High production Legume (butterfly pea, leucaena)
Fertile soils with rooting depth > 90cm for Butterfly pea and > 120cm for Leucaena. Suitability described by land type
Legume (medics, stylo, desmanthus) Described by land type
Mechanical Renovation (Blade plough) >60 cm to dispersible or impenetrable layers Mechanical Renovation (Chisel plough) >30 cm to dispersible or impenetrable layers Short-term fallow (3 + months) >50cm to dispersible or impenetrable layers
Herbicide None
Table 6: Rainfall requirements for legumes in different regions of Queensland.
Zone Regions Leucaena
Butterfly pea Burgundy bean Medics Shrubby stylo Caribbean stylo Caatinga stylo Desmanthus Northern Queensland
North of Charters Towers to Mt Isa
Northern Gulf, Southern Gulf, northern half of
Burdekin >800 mm >750mm
Not well adapted
Does
not grow >600mm >750mm >750mm >600mm
Central Queensland
North of Isla Gorge, Carnarvon range
Fitzroy, Mitchell Grass Downs, Desert Uplands, Southern half of Burdekin (Belyando, Suttor)
550 -
800mm >550mm >600mm Does
not grow >500mm >600mm >600mm >500mm
Southern Queensland
Maranoa/Balonne, Border Rivers, Inland Burnett, Mulga, southern part of Fitzroy (Upper Dawson)
600 - 800mm
Not well
adapted >550mm >450mm
Frost free areas, not well adapted or widely spread Does not
grow well >550mm >500mm
References: North Queensland was based primarily on un-published pasture evaluation trials (T. Hall pers. comm.); central and
southern regions (Anonymous 2010; Collins and Grundy 2005; Dalzell et al. 2006; Gardiner et al. 2004; Gardiner and Swan 2008;
3.3 Economic analysis
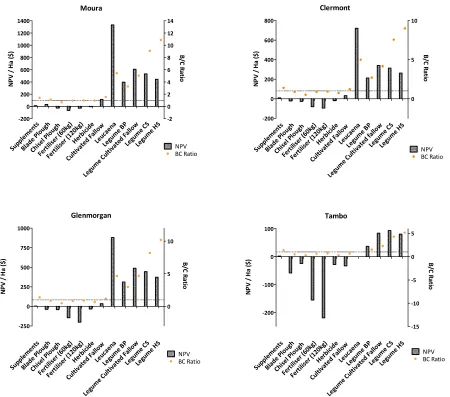
A spreadsheet based pasture production and economics model was used to evaluate the benefits and costs associated with undertaking mitigation strategies at the farm level to address buffel grass pasture productivity decline. Four case study locations across Queensland (Moura, Glenmorgan, Clermont and Tambo) were selected to represent a range of production capabilities and model the effects of mitigation strategies on the production system. The mitigation strategies evaluated were:
Dry season supplementation of stock.
Fertiliser at two different rates (60 and 120 kg N/ha/yr).
Mechanical renovations using three different methods – chisel plough, blade plough and a 3 month cultivated fallow with four cultivations.
Leucaena established into cultivated strips (5 m cultivated, 3 m grass strips).
Legumes established using four different techniques. The legumes were not specified although it is assumed they are well adapted to the location and in practice would most likely be medics, stylos and/or desmanthus. The establishment techniques were cultivated strips, herbicide strips, blade plough and short term fallow. The strip treatments assumed 5 m treated with herbicide or cultivation with 11 m grass strips.
A ‘rundown buffel’ scenario was developed for each region which was assumed to be the present state of sown buffel grass pastures (the ‘base case’) with productivity being constant over time (that is reduced N availability had resulted in a lower but stable equilibrium state of pasture productivity). Mitigation strategies were compared to the base case to derive a net economic benefit (or cost) of undertaking the mitigation. The results of the farm scale analyses were extrapolated to a regional scale (using the spatial analysis results) to estimate state-wide impacts of employing the selected mitigation strategies.
3.3.1 Pasture production, stocking rates and animal performance
Average annual pasture and animal production were described for high, medium and low fertility soils for the case study locations. Pasture production for rundown buffel grass was estimated through a combination of GRASP pasture growth models (Whish G. pers. comm.), back calculation
from carrying capacity described in local consensus data reports (Clarke et al. 1992), other
published sources (Dalzell et al. 2006; Middleton 2001; Partridge 1996) and expert opinion through
consultation with researchers described in section 3.1.3. Individual animal performance was described as an average annual live weight gain and was estimated from published figures and expert opinion. Pasture production and animal performance for mitigation strategies were calculated from likely responses (from published sources and expert opinion) relative to rundown buffel grass production figures.
Stocking rates were calculated from pasture production estimates described above using an average annual forage budget methodology. Benchmark residual biomass at end of dry season for high, medium and low fertility soils for each location were calculated from published utilisation rates for land types at the case study locations. The stocking rates for mitigation strategies were calculated to achieve the same residual pasture biomass, that is stock numbers were increased to utilise the extra forage with the same end of dry season residual biomass. Forage for animal consumption was calculated as follows:
Benchmark utilisation rates and spoilage percentages used for pasture budgeting are shown in Table 7.
Table 7: Utilisation and spoilage rates used for forage budgeting. The utilisation rate was applied to rundown buffel grass DM production to calculate a benchmark residual biomass for use with mitigation strategies (adapted from Whish 2010).
Location Moura, Glenmorgan, Clermont Tambo
Soil Fertility High Med Low High Med Low
Utilisation rate 30% 25% 20% 25% 20% 15%
Spoilage 20% 15% 15% 20% 15% 15%
3.3.2 Property scale economic analysis
The economic analysis was based on a steer finishing enterprise where stock are purchased annually and finished to meet the “Jap Ox” market specifications (596 kg live weight, 310 kg carcase weight). Purchase weights were determined by working backwards using the required turn off weight (596 kg) and the calculated annual live weight gain for each scenario (Table 18). The livestock purchase price was based on a long term average for the Gracemere sales yards and the selling price based on a long-term average for the Dinmore meat processing plant. Freight and animal health costs were based on 2010 prices. Freight costs were calculated on the assumption that stock were purchased from the closest major saleyard and sold to the closest major abattoir.
Gross margins were calculated for high, medium and low fertility soils at each case study location for each mitigation strategy (as well as the base case), over a range of years (depending on how long the strategy was expected to have an impact on the production capacity of a pasture). For example, the ‘blade plough’ strategy had 9 gross margins calculated at each location:
3 fertility levels (L,M,H) x 3 different impact stages (Year 1, Years 2-5, years 6-7) = 9 gross margins
The gross margin is equal to the annual income received from cattle sales, less the variable costs incurred by the operation (e.g. livestock purchase, health costs, freight and levies).
For the farm level analysis, expert opinion was consulted to estimate the percentage breakdown of low, medium and high fertility land sown with buffel, as well as the percentage of non-buffel pasture on a typical farm at each location. A representative farm size was also estimated (Table 8).
Table 8: Land type mix and size of case study properties which approximate a typical property for the respective district. Adapted from local consensus data (Clarke et al. 1992; Lawrence et al. 1994a)
Location Size High Fertility
%
Medium Fertility %
Low fertility % Non-buffel %
Moura 4 000 ha 20% 30% 20% 30%
Glenmorgan 3 000 ha 20% 20% 30% 30%
Clermont 15 000 ha 10% 20% 20% 50%
Annual gross margins for each mitigation strategy and the base case were aggregated at each location by summing the product of the gross margin for each fertility level, the percentage of farm area made up of the fertility level and total farm area:
∑ (Gross Margin(L,M,H,NB) x % of land(L,M,H,NB) x Total farm area)
Where L = Low, M = Medium, H = High and NB = Non-buffel. The non-buffel area of the farm was assumed to be native pasture. The gross margin per Adult Equivalent (AE) for the non-buffel area was taken as $114.40/AE (Best 2009) and was assumed to be constant across locations. The figure is taken from a spear grass pasture production system and was adjusted to 2010 dollars. The stocking rate was adjusted for each case study to reflect the likely carrying capacity of non-buffel native pastures for each location (Table 9).
Table 9: Stocking rate (SR) and gross margins for native pastures for the case study properties (Best 2009).
Location SR (ha/AE) Gross Margin / ha
Moura 10 $11.44
Glenmorgan 12 $9.53
Clermont 15 $7.63
Tambo 25 $4.58
The impact of each mitigation strategy was measured over 30 years using the annual gross margins calculated for each strategy less the costs of mitigation and fixed costs. For simplicity, contract rates were used for planting, ploughing, spraying and cultivation. Fixed costs remained constant across strategies except for the fertiliser scenarios where increased depreciation was incurred due to ownership and use of a spreader. Because this mitigation strategy occurred annually, it was assumed a farmer would purchase a spreader and perform the operation themselves.
Table 10: Mitigation strategy costs.
Scenario Description Treatment
Frequency
Cost Rundown (Base
case)
Assumed current scenario N/A N/A
Dry Season Supplement
50 days of supplement for Glenmorgan 100 days of supplement for Tambo and Moura
150 days of supplement for Clermont
Annual 12.5 cents per AE
per day
Fertiliser (60kg/ha) 60kg of Nitrogen applied per ha (130 kg of Urea)
Annual $102 per ha
Fertiliser (120kg/ha)
120kg of Nitrogen applied per ha (260 kg of Urea)
Annual $188 per ha
Blade Plough 6 month destocking in treatment years, contract rate for ploughing
Every 10 years $210 per ha
Chisel Plough 3 month destocking in treatment years,
contract rate for ploughing Every 5 years $37 per ha Cultivated Fallow 6 month destocking in treatment years,
4 x cultivation (contract rate)
Every 10 years $170 per ha
Herbicide renovation
6 month destocking in treatment years, 2 aerial sprays of Roundup (2 L/ha)
Every 5 years $46 per ha
Leucaena 2 x Ripper
2 x Offset disc
1 x Roundup (strips only, 1.5 L/ha) 1 x Spinnaker (strips only, 70 g/ha) 1 x Roundup (whole paddock – 1.5 L/ha)
No stocking in year 1, only High and Medium soils are planted to leucaena.
Plant in year 1, maintenance
trimming and fertiliser (100 kg/ha Superphosphate) every 5 years
$312 per ha - planting
$149 per ha - maintenance
Legume – est. by Blade Plough
6 month destocking in year 1, contract rate for ploughing and planting
Plant in year 1 $250 / $224* per ha
Low Fert - $225 / $199* per ha
Legume – est. by
cultivated fallow 6 month destocking in year 1 4 x cultivation (contract rate)
25 kg/ha superphosphate on low fertility soils in year of establishment
Plant in year 1
Med & High Fert - $210 / $184* per ha Low Fert - $105 / $97* per ha
Legume – est. by cultivated strips
6 month destocking in year 1 2 x Ripper (strips only) 2 x Offset disc (strips only)
2 x Roundup (strips only, 1.5 L/ha) 1 x Spinnaker (strips only, 0.07 L/ha) 25 kg/ha superphosphate on low fertility soils in year of establishment
Plant in year 1
Med & High Fert - $90 / $82* per ha
Low Fert - $74 / $66* per ha
Legume – est. by herbicide strips
6 month destocking in year 1 3 x Roundup (strips only, 1.5 L/ha) 1 x Spinnaker (strips only, 0.07 L/ha) 25 kg/ha superphosphate on low fertility soils in year of establishment
Plant in year 1
Med & High Fert - $60 / $52* per ha
A discounted cash flow (DCF) investment analysis framework was used to compare the ‘net present value’ (NPV) of alternative mitigation strategies. The NPV is derived by discounting back all future cash flows (costs and income) at a given discount rate. For this analysis, a discount rate of 7% was used to represent the opportunity cost of the investment. The cash flows of the base case scenario (rundown buffel) were subtracted from the cash flows of each mitigation strategy to give a meaningful comparison of what the benefit (or cost) of a mitigation strategy was compared with what would have occurred in the absence of any mitigation. A negative NPV figure indicates that the mitigation strategy would result in a net cost to the farmer at the stated discount rate over 30 years. Further, a benefit cost (B/C) ratio was calculated for each strategy. The B/C ratio is the ratio of the discounted benefits of the investment to the sum of the discounted costs over the 30 year investment period. It can be thought of as the return on investment for every dollar spent in present dollar value (i.e. for every dollar spent, how many dollars are returned). For the investment to be considered beneficial, a B/C ratio greater than 1 is required.
Sensitivity analysis was carried out on a number of assumptions. The NPV of each strategy was calculated at discount rates of 6% and 8% to test the robustness of the findings. The fertiliser strategies were expanded to test how results would change if application was only required every two and three years. Further, the percentage of land made up of each fertility level were altered to measure the effect on NPV.
3.3.3 Industry scale economic analysis
The industry scale economic analysis compared different rates of adoption of economically viable mitigation strategies to assumed current levels of adoption. The adoption rates modelled were 20, 40, 60 and 100% increases on current levels and adoption on all land that is suited to the mitigation strategy.
The NPV calculated at the property scale was extrapolated to the Queensland scale using the areas suitable for each mitigation strategy calculated by the spatial analysis. Only mitigation strategies that are technically (soil and climate) and economically (positive returns) feasible were extrapolated to the region and, subsequently, Queensland scale. The mitigation strategies that were modelled at the Queensland scale were:
Legumes established in cultivated strips.
Leucaena.
Cultivated fallow.
Blade plough.
Table 11: Case study locations and the grazing land management (GLM) regions to which their economic returns were applied.
Case study location GLM region.
Moura Fitzroy, Inland Burnett, Darling Downs
Glenmorgan Maranoa Balonne, Border Rivers
Clermont Burdekin
Tambo Desert uplands, Southern Gulf, Northern Gulf
Tambo – No suitable legume Mulga, Mitchell Grass Downs, Channel Country
3.4 Research, Development and Extension priorities
R,D&E needs for addressing pasture productivity decline in grass pastures were identified from consultation with industry (graziers, researchers and pasture seed industry). Some of the R,D&E needs were tested through the spatial and economic analysis described above. Technical, social and economic drivers or constraints for mitigation options were identified. R,D&a