PAPER AS ACCEPTED FOR PUBLICATION BY PEDIATRIC EXERCISE SCIENCE 1
The CHANGE! Project: Changes in body composition and cardiorespiratory fitness in 10-11 2
year old children after completing the CHANGE! Intervention 3
Dagger, Rebecca. M1., Davies, Ian.G2., Mackintosh, Kelly. A3., Stone, Genevieve. L4., George, 4
Keith. P5., Fairclough, Stuart. J6,7., Boddy, Lynne. M5. 5
1. Dagger, Rebecca. M was previously known as Gobbi, Rebecca. M. 6
School of Health Sciences, Liverpool Hope University, Hope Park, Taggart Ave, Liverpool, L16 7
9JD 8
2. Faculty of Education, Health and Community Liverpool John Moores University, IM Marsh 9
Campus, Barkhill Road Liverpool, L17 6BD 10
3. Applied Sports Science Technology and Medicine Research Centre (A-STEM) College of 11
Engineering, 967c Talbot Building, Swansea University, Singleton Park, Swansea, Wales, 12
SA2 8PP 13
4. Stone, Genevieve. L was previously known as Warburton, Genevieve. L. 14
Faculty of Health and Social Care, Edge Hill University, St Helens Road, Ormskirk, Lancashire, 15
L39 4QP 16
5. The Physical Activity Exchange, Research Institute for Sports and Exercise Sciences, 17
Liverpool John Moores University, 62 Great Crosshall Street, Liverpool, L3 2AT 18
6. Sport and Physical Activity Department, Edge Hill University, St Helens Road, Ormskirk, 19
Lancashire, L39 4QP 20
7. Department of Physical Education and Sports Science, University of Limerick, Limerick, 21
Ireland 22
23
The Authors declare they have no conflicts of interest. 24
25
Corresponding Author 26
Lynne. M Boddy, Research Institute for Sports and Exercise Sciences, Liverpool John Moores 27
University, No 62 Great Crosshall Street, Liverpool, L3 2AT. Email: [email protected]
28
Title: The CHANGE! Project: Changes in body composition and cardiorespiratory fitness in 30
10-11 year old after completing the CHANGE! Intervention 31
Running Head: Changes in body composition 32
Abstract 33
Purpose: To assess the effects of the Children’s Health, Activity and Nutrition: Get Educated! 34
intervention on body size, body composition and VO2peak in a sub-sample of 10-11 year old 35
children. 36
Method: Sixty children were recruited from 12 schools (N= 6 intervention) to take part in the 37
CHANGE! sub-sample study. Baseline, post intervention and follow measures were 38
completed in October 2010, March-April 2011, and June-July 2011 respectively. Outcome 39
measures were BMI z-score, waist circumference, body composition assessed using DEXA 40
(baseline and follow up only), and VO2peak. 41
Results: Significant differences in mean trunk fat mass (control 4.72 kg, intervention 3.11 kg, 42
p = 0.041) and trunk fat % (control 23.08%, intervention 17.75 %, p = 0.022) between groups 43
were observed at follow up. Significant differences in waist circumference change scores 44
from baseline to follow up were observed between groups (control 1.3 cm, intervention -0.2 45
cm, p = 0.023). Favourable changes in body composition were observed in the intervention 46
group; however, none of these changes reached statistical significance. No significant 47
differences in VO2peak were observed. 48
Conclusion: The results of the present study suggest the multicomponent curriculum 49
intervention had small to medium beneficial effects on body size and composition health 50
outcomes. 51
Introduction 53
Childhood obesity, poor nutritional intake, low cardiorespiratory fitness (CRF) and 54
insufficient physical activity increase the risk of developing cardiometabolic disease (2, 3, 55
16). Over the last decade childhood obesity has increased (UK) (8, 40). Concurrently CRF, an 56
independent risk factor for cardiometabolic (CM) disease, has decreased independent of 57
changes in body size and other confounders such as maturation and deprivation (7, 8, 40). 58
Current UK guidelines recommend children participate daily in at least 60 minutes of 59
moderate to vigorous intensity PA (MVPA) whilst engaging in vigorous PA (VPA) at least 3 60
times per week (12). However, few children report meeting these guidelines (34, 36). 61
Schools provide an ideal opportunity to implement an intervention designed to improve PA 62
since children spend approximately half of their waking hours in school (15). Health 63
promoting curriculum based interventions have been found to be successful in children, 64
especially when utilising a multi-disciplinary approach, which combines PA and diet, and 65
uses established behaviour change and social support processes (21, 43). Several 66
intervention studies have aimed to increase PA, reduce sedentary time and improve 67
nutritional intake in children in order to reduce CM disease risk, often reporting mixed levels 68
of success (18, 30, 37, 38). These studies typically include measures of body size such as 69
body mass index, skin fold thicknesses and waist circumference rather than composition. 70
Furthermore the majority of studies assessed CRF in the field using the 20m multi-stage 71
shuttle runs test, which although valid and reliable does not provide a direct assessment of 72
peak oxygen uptake (VO2peak). The Children’s Health, Activity and Nutrition: Get Educated! 73
(CHANGE!) intervention was designed to improve PA levels and healthy eating behaviours of 74
teachers (14). The main intervention outcomes have been reported elsewhere (14). Briefly, 76
significant differences between the control and intervention group were observed in waist 77
circumference at post intervention and BMI z-scores and light intensity physical activity at 78
follow up. As part of the CHANGE! study a sub-sample of children were invited to take part 79
in some additional laboratory based measures, including treadmill assessed peak oxygen 80
uptake (VO2peak) and DEXA scans to provide detailed information on body composition. 81
This study reports outcomes from the sub-sample group who participated in these 82
additional measures rather than the full CHANGE! pragmatic evaluation group. The aim of 83
this analysis was to assess changes in measures of body size and VO2peak between baseline 84
and post intervention and baseline and 10 week follow between the control and 85
intervention group in the CHANGE! sub-sample. In addition, differences in pre-follow up 86
DEXA assessed body composition between the control and intervention groups were also 87
examined. This study extends the previous CHANGE! pragmatic evaluation study by 88
examining changes on reference standard measures of body composition and 89
cardiorespiratory fitness in the sub-sample participants. 90
91
Materials and Methods 92
Participants and Study Design 93
After receiving institutional ethical approval 12 primary schools from the Wigan Borough in 94
North West England were recruited to participate within the clustered randomized 95
controlled pilot trial, registered with Current Controlled Trials (ISRCTN03863885). All 96
children within Year 6 (10 - 11.9 y) were invited to take part in the CHANGE! study from 97
received from 318 participants (75.7% participation rate), the results of the whole sample 99
are reported elsewhere (14). A stratified random sub-sample of sixty participants (5 100
participants from each participating school), were invited to take part in these additional 101
study measures, and are reported here. The sample size was based on feasibility of data 102
collection and the resources available to the research team. If the selected children did not 103
wish to participate in the sub-ample measures another participant was randomly selected 104
from the volunteers in the school using the random number generator function in SPSS V.17 105
(SPSS Inc., Chicago, IL.) This sampling approach was completed until parental consent and 106
participant assent was received for 60 participants to take part in the subsample measures. 107
The number of children invited to take part in the subsample vs the number agreeing to 108
participate were not recorded. Approximately 95% of the children were of white British 109
ethnicity, which is representative of the school age population in Wigan (45). Schools were 110
randomised to an intervention (N = 6 schools) or control condition (N = 6 schools) prior to 111
baseline measures being completed in October 2010. Randomisation occurred prior to 112
baseline measures to allow enough time for the teacher training sessions to take place, and 113
was completed using the random number generator function in SPSS v17 (SPSS Inc., Chicago 114
IL). Post intervention measures were completed after the 20 week intervention period in 115
March and April 2011 for all measures with the exception of DEXA assessed body 116
composition, which was assessed at baseline and follow up only. Follow up laboratory 117
measures were taken 8 to 10 weeks after the intervention ended, prior to the school 118
summer holidays in June-July 2011. One intervention school withdrew from the CHANGE! 119
project shortly after baseline measurements leaving a subsample of 30 children in the 120
Intervention Design 122
The CHANGE! Intervention including details on lesson topics has been described elsewhere 123
(14). Briefly the CHANGE! Intervention was designed and adapted from the Planet Health 124
resources that have been used in the USA (19). The adaptations were made following 125
formative work which has been described elsewhere (9, 29). The CHANGE! topics were 126
aligned with the UK Healthy Schools programme and were cross-referenced to English 127
National Curriculum objectives in Personal Social Health and Economic Education (PSHE) PE, 128
Maths, Science, ICT, English, Geography and History (35). In total the CHANGE! Intervention 129
consisted of 20 lesson plans which included worksheets, and other resources, and were also 130
supported by homework tasks which involved the whole family, since the formative work 131
emphasised the importance of family support. The CHANGE! lesson themes, titles and 132
content summary have been published previously (14). Briefly themes such as energy 133
balance, reducing sedentary time, what physical activity is and where children are active 134
were amongst the topics covered. 135
136
Outcome Measures 137
Anthropometrics 138
Stature and sitting stature were measured to the nearest 0.1 cm and body mass to the 139
nearest 0.1 kg using a stadiometer (Seca, Bodycare, Birmingham, UK) and calibrated 140
electronic scales (Seca, Bodycare, Birmingham, UK) using standard techniques (28). Body 141
Mass Index (BMI) was calculated using the equation body mass (kg) ÷ height (m)2. Waist 142
were taken at the narrowest point between the bottom of the ribs and the iliac crest by one 144
researcher. 145
Body Composition 146
Body composition was assessed at baseline and follow up using fan beam dual energy x-ray 147
absorptiometry (DEXA) (Hologic QDR series, Delphi A, Bedford, Massachusetts, USA) in the 148
whole body scan mode. Participants were scanned in a supine position in lightweight 149
clothing and without shoes. All scans were carried out by the same qualified researcher and 150
were analysed using Hologic QDR software for Windows version 11.2. All scans were 151
completed in accordance with standard operating procedures and after completing the 152
necessary quality control checks including daily calibration. Key variables assessed from the 153
whole body scan were absolute (kg) fat mass and lean tissue mass, and relative (%) body fat. 154
Segmental analysis was also carried out to assess the distribution of body fat and the key 155
variables of interest were trunk fat mass, and relative (%) trunk fat, peripheral (arms and 156
legs) fat mass (PFM), and relative (%) peripheral fat. 157
158
Somatic Maturation 159
Somatic maturation was estimated using the sex specific regression equations (32) by 160
determining years from peak height velocity. This method has been used previously in 161
similar paediatric populations (20, 25) and shows acceptable agreement with skeletal age 162
(32). 163
164
To account for the known associations between deprivation and health outcomes, 166
postcodes for the primary address of each participant were collected and indices of multiple 167
deprivation score (IMD) were calculated using Geoconvert (http://geoconvert.mimas.ac.uk/) 168
which uses data from the National Statistics Postcode Database November 2010. The IMD 169
score was then retained for analysis. 170
171
Cardiorespiratory Fitness (VO2peak) 172
Peak oxygen uptake (VO2peak) was assessed using an individually calibrated continuous 173
incremental treadmill (H P Cosmos, Traunstein, Germany) test to volitional exhaustion, 174
under ambient conditions, using an online gas analysis system (Jaeger Oxycon Pro, Viasys 175
Health Care, Warwick, UK). All participants wore an accelerometer (Actigraph GT1M, 176
ActiGraph LLC, Pensacola, FL, USA) on the right hip and a heart rate monitor (Polar, 177
Kempele, Finland) throughout the test. In order to account for individual variation in limb 178
length, the VO2peak test speeds were calibrated individually by setting treadmill speeds to 179
set Froude (Fr) numbers. Dynamic similarity theory suggests that geometrically, individuals 180
will have similar gait dynamics if the Fr number is kept constant (1). According to this theory 181
optimum walking speed will be at Fr 0.25, with the transition between walking and running 182
occurring close to Fr 0.5 regardless of variations in body size (31). Therefore treadmill 183
speeds were calculated individually using the equation: 184
Fr = v2/ (g x l) 185
[Where v is speed of movement (m/sec), g is gravity, l is leg length (m)] 186
The protocol involved 2 minute incremental stages; stage 1 was programmed to individual 187
0.5; subsequent stage increments were based on researcher judgement using respiratory 189
exchange ratio (RER) and heart rate (HR) of participant as a guide and either involved an 190
increase in speed, determined by the difference in speed for stages one and two 191
(approximately 1 to 2 km/h), or by an increase in gradient. VO2peak was determined as the 192
highest 15-s averaged oxygen uptake achieved during the test when participants exhibited 193
subjective indicators of peak effort that were confirmed by a RER > 1.05 and/or HR > 195 194
beats.min-1. This protocol has been used previously in similar paediatric studies (10, 24). 195
196
Statistical Analysis 197
All analyses were conducted using SPSS V.17 (SPSS Inc., Chicago, IL.). Participant 198
characteristics were compared at baseline using multivariate analysis of covariance 199
(MANCOVA) controlling for sex and IMD. Differences in mean waist circumference, BMI Z-200
scores, body composition measures and VO2peak between participants in the intervention 201
and control groups at each time point were assessed using MANCOVA with somatic 202
maturation, IMD and sex as covariates. Change scores between baseline and post 203
intervention and baseline and follow up were calculated for waist circumference, BMI Z-204
scores, body composition measures (baseline and follow up only) and VO2peak. Group 205
differences between mean change scores were assessed using MANCOVA with sex, somatic 206
maturity at baseline, IMD, and baseline measure value as covariates. This method has been 207
recommended for use in randomised control trials (RCTs), and generally has greater 208
statistical power than other methods when analysing the effects of RCTs (44). Partial eta 209
squared (ŋ2) values provide estimates of effect sizes for the main analyses where partial ŋ2 ≥ 210
0.01, 0.09 and 0.25 classified as small, medium and large effect sizes respectively (33). 211
Results 213
Participant characteristics are presented for the control and intervention groups in Table 1. 214
Groups were well matched at baseline. Table 2 shows adjusted means (SD) for measures at 215
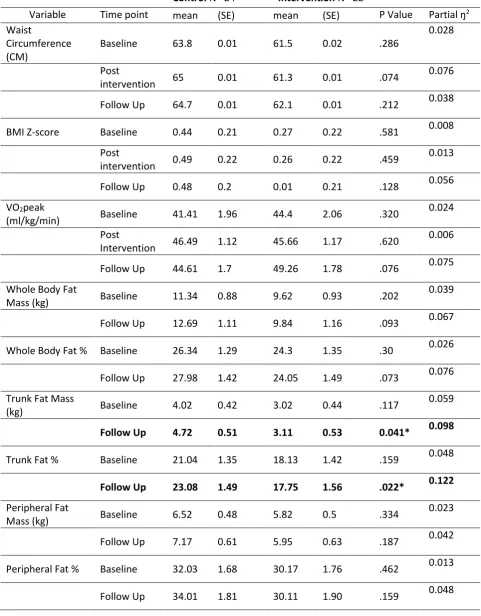
baseline, post intervention and follow up. For the comparison of mean values between 216
groups, there were no significant differences for any values at post intervention. There were 217
also no significant differences for any values with the exception of significantly lower trunk 218
fat mass (control group 4.7 kg, intervention group 3.1 kg, p = 0.041, partial ŋ2= 0.098, 219
medium effect size) and trunk fat mass % in the intervention group in comparison to the 220
control group at follow up (control group 23.08%, intervention group 17.75%, p = 0.022, 221
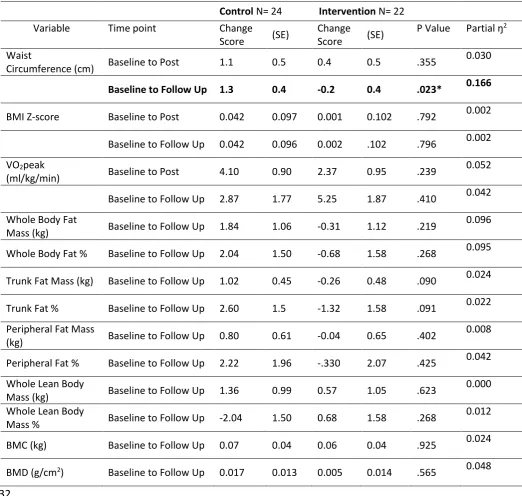
partial ŋ2= 0.122, medium effect size). Table 3 displays adjusted mean change scores 222
between baseline and post intervention, and between baseline and follow up, when 223
controlling for baseline values, sex, maturity, and IMD. For the change score analysis there 224
were no significant differences between groups for baseline to post intervention change 225
scores. A significant difference between groups for waist circumference change between 226
baseline and follow up was observed after controlling for sex, maturity, baseline values, and 227
IMD (control waist circumference change: 0.013 cm, intervention change score: -0.002cm, 228
p=0.023, partial ŋ2= 0.166, medium effect size) (Table 3). There were no other statistically 229
significant differences between groups for changes between baseline and follow up for any 230
of the other measures. 231
232
The adjusted body composition (DEXA) measures showed favourable improvements in the 233
intervention group in comparison to the control group in a range of measures (Tables 2 and 234
3); however, none of these changes with the exception of mean trunk fat and trunk fat% 235
intervention group and increased by 1.84 kg in the control group (partial ŋ2= 0.096 medium 237
effect size), and whole body fat % reduced in the intervention group by 0.68 %, whereas the 238
control group increased by 2.04 % (partial ŋ2 = 0.095, medium effect). There was a slight 239
decrease in trunk fat mass of 0.26 kg in the intervention group, and an increase of 1.02 kg in 240
the control group (partial ŋ2= 0.024, small effect). Trunk fat % reduced in the intervention 241
group by 1.32 % and increased by 2.6 % in the control group, however this change score 242
trend did not reach statistical significance (p = 0.091, partial ŋ2= 0.022, small effect). 243
Peripheral fat mass also decreased slightly in the intervention group (0.04 kg) and a small 244
increased was observed in the control group (0.80 kg, partial ŋ2= 0.008, negligible effect). 245
Peripheral fat mass % decreased by 0.33% in the intervention group and increased by 2.22% 246
in the control group (partial ŋ2 = 0.042, small effect). Whole body lean mass % increased in 247
the intervention group slightly (0.68%) in comparison to a small decline in the control group 248
(-2.04%), however this trend was not statistically significant (p = 0.268, partial ŋ2= 0.012, 249
small effect). Between baseline and post intervention the control group exhibited greater 250
changes in VO2peak (4.1 ml/kg/min) than the intervention group (2.37 ml/kg/min). Despite 251
this, the intervention group exhibited a greater increase in VO2peak between baseline and 252
follow up (5.25 ml/kg/min) in comparison to the control group (2.87 ml/kg/min) however 253
this difference did not reach statistical significance (p=0.410, partial ŋ2= 0.042, small effect). 254
255
Discussion 256
This cluster randomised study aimed to assess the effects of the school-based CHANGE! PA 257
and healthy eating intervention on body composition and cardiorespiratory fitness in a sub-258
sample of 10 to 11 year old children. A significant intervention effect was detected at follow 259
fat %. Furthermore, there were also favourable improvements in body composition (DEXA) 261
measures in the intervention group in comparison to the control group (Tables 2 and 3); 262
however, none of these changes reached statistical significance (p > 0.05), which may be 263
due to the small sample size involved in the sub-sample cohort. Despite the lack of 264
statistically significant findings, medium and small effect sizes were observed that suggested 265
the intervention may have been beneficial. 266
267
The results of the present study add a degree of support to the existing evidence of the 268
effectiveness of combined curriculum based PA and nutrition interventions on lifestyle-269
related health outcomes. The changes observed in mean trunk fat (mass and %) and waist 270
circumference suggest reductions in central adiposity in the intervention group. Waist 271
circumference and DEXA assessed trunk fat predict visceral fat (11, 41) and are positively 272
associated with cardiometabolic risk factors in children (5, 39). The small to medium 273
improvements in central adiposity observed, equating to a change score difference of 1.5cm 274
between the control and intervention group at follow up, may be associated with reduced 275
disease risk therefore representing an important intervention effect. Significant differences 276
in waist circumference were also observed between the intervention and control groups in 277
the main CHANGE! trial, however these improvements were statistically significant at post 278
intervention only. Other physical activity and dietary intervention studies have reported 279
improvements in waist circumference, for example the Lekker Fit! (26) study conducted 280
with 9-12 year old children reported significant improvements in waist circumference in the 281
intervention group, however their reported decrease in waist circumference was greater at 282
0.71 cm (26). Unlike the main CHANGE! study, no significant changes in BMI Z-scores were 283
up, though the intervention group exhibited smaller Z-score changes between baseline and 285
follow up (0.01 Z-score units) than the control group (0.48 Z-score units, partial ŋ2= 0.056, 286
small effect), suggesting favourable changes in the intervention group in overall body size, 287
though these did not reach statistical significance. Other intervention studies have 288
demonstrated significant improvements in BMI z-scores, with significant decreases in 289
intervention children’s BMI z-scores (0.2 units) observed after two years follow-up in the 290
APPLE Project (42), and in the Planet Health intervention study obesity prevalence 291
significantly reduced in girls (19). Any reduction in BMI z-scores is thought to be clinically 292
meaningful (6), reducing the risk of cardiometabolic disease (22, 23), therefore despite the 293
lack of statistical significance the medium effects observed for BMI z-scores may have been 294
meaningful in our study. 295
296
Despite differences in other measures of body size and body composition failing to reach 297
statistical significance small and medium effect sizes demonstrate potentially beneficial 298
changes in total body fat and peripheral fat mass between groups at follow up. These 299
findings suggest that the CHANGE! intervention may have improved body composition, but 300
that the sub-sample study was not suitably powered to detect changes. Future studies 301
should aim to include larger sample sizes in all key outcome measures to better examine the 302
effect of the intervention on body composition. Despite this recommendation, the use of 303
DEXA in children’s studies on a large scale is not always feasible, due to a lack of facilities 304
and resources available. 305
306
When assessing change in VO2peak from baseline to follow up the control group slightly 307
whereas the intervention group increased VO2peak by over 5 ml/kg/min. The difference in 309
VO2peak between groups did not reach statistical significance (p = 0.410). Other studies 310
have demonstrated greater increases in fitness immediately following multi-disciplinary 311
curriculum based interventions (27, 30, 38), however, fitness was assessed using different 312
methods to CHANGE!. The small improvement in VO2peak in the intervention group 313
between baseline and follow up equates to an increase of 2.8%, representing a small effect 314
size. In a review of 22 aerobic training studies, there was an average improvement in 315
VO2peak of 5-6%, and greatest improvements were evident where training intensity 316
exceeded 80% HR max (4). In light of this, the improvement in the present study is low, and 317
suggests that any changes in physical activity were not of sufficient intensity or duration to 318
stimulate significantly improved fitness. Despite the minor intervention effects observed, 319
cross sectional studies have demonstrated the negative relationship between clustered 320
cardiometabolic risk and VO2peak (3, 10, 17) and therefore the small improvement in 321
VO2peak observed in the current study, if sustained, may be physiologically beneficial. 322
323
The CHANGE! intervention was underpinned by a programme of formative work (9, 29) as 324
well as reviews of empirical evidence related to school-based physical activity and nutrition 325
interventions. Empirical evidence consistently reported that multi-component studies stood 326
the best chance of success and formative work highlighted key issues of importance to the 327
target population. The theoretically underpinned curriculum intervention that was adjusted 328
to the needs of the population involved (9, 29) in combination with homework tasks to 329
promote family engagement (13) may have created an environment conducive to behaviour 330
change, thus accounting for the changes observed in body composition and body size 331
components of the CHANGE! intervention were successful or unsuccessful, therefore future 333
studies should build-in thorough process evaluation measures to provide this important 334
information going forwards. 335
336
Strengths and Limitations 337
Over 75% of children invited to take part in the main CHANGE! study consented to take part, 338
and the subsample was randomly invited to participate from this group, therefore reducing 339
the risk of sampling bias. Despite this, records were not kept to examine how many 340
participants declined to participate in the subsample groups, so recruitment rates cannot be 341
calculated. Randomisation into treatment groups was by school therefore reducing risk of 342
intervention contamination to control group children, however randomization occurred 343
prior to baseline measures. The intervention content was informed by opinions and beliefs 344
of the participants and stakeholders and was relevant to the local context. Furthermore, the 345
intervention was a sustainable approach since existing class teachers delivered the lessons, 346
which were able to be integrated into the existing curriculum. Randomisation into 347
treatment group was limited to clusters (by school) and therefore allows for the possibility 348
of clustering of outcome observations within schools. However, at baseline control and 349
intervention participants were well matched and analysis of the main CHANGE! intervention 350
study found no significant influence of clustering on outcomes. Statistical analysis presented 351
within the present study controlled for baseline results, as well as sex, deprivation (IMD), 352
and maturation therefore accounting for the influence of these covariates within analyses. 353
354
Teachers received training on how to deliver the intervention lessons; however, there were 355
therefore intervention fidelity is unknown. The study used reference standard measurement 357
techniques to assess body composition (DEXA), and CRF (individually calibrated treadmill 358
based VO2peak protocol). In larger scale studies the combination of such high quality 359
measures are rarely utilised. However, the sample size for the subsample was relatively 360
small. This would have therefore reduced statistical power and may account for some 361
between group and time-point differences failing to reach statistical significance; 362
furthermore, due to the small sample size and narrow age range of participants, the results 363
may not be generalised to a wider population. This study demonstrates that conducting 364
reference standard measures in children is possible and feasible, however a larger sample 365
size is needed in future to obtain the necessary statistical power to detect any changes in 366
health outcomes. A strength of the study was that it included a follow up investigation 367
period. However, this was relatively short (8 to 10 weeks) and a longer term follow up is 368
required to determine whether any intervention effects were maintained long-term. 369
370
Conclusions 371
The present study demonstrated short-term positive intervention effects with statistically 372
significant improvements in waist circumference, mean trunk fat mass and mean trunk fat 373
mass % at follow up. Given the association between central adiposity and disease risk, these 374
changes are likely to be beneficial. The study also demonstrated some small to medium 375
improvements in other markers including whole body fat %, lean mass % and VO2peak at 376
follow up. Since the CHANGE! intervention focused mainly on behaviour change, it is 377
possible that any behavioural changes may not have clinical influence immediately after 378
term follow up is required in order to establish if behaviour can transition into clinical health 380
References 382
1. Alexander RM. Optimization and gaits in the locomotion of vertebrates. Physiol Rev. 383
1989;69:1199-227. 384
2. Andersen LB, Harro M, Sardinha LB, et al. Physical activity and clustered 385
cardiovascular risk in children: a cross-sectional study (The European Youth Heart Study) 386
Lancet. 2006;368(9532):229-304. 387
3. Andersen LB, Sardinha LB, Froberg K, Riddoch CJ, Page AS, Andersen SA. Fitness, 388
fatness and clustering of cardiovascular risk factors in children from Denmark, Estonia and 389
Portugal: The European Youth Heart Study. International Journal of Pediatric Obesity. 390
2008;3:58-66. 391
4. Baquet G, van Praagh E, Berthoin S. Endurance training and aerobic fitness in young 392
people. Sports Medicine. 2003;33(15):1127-43. PubMed PMID: 14719981. Epub 393
2004/01/15. eng. 394
5. Bassali R, Waller JL, Gower B, Allison J, Davis CL. Utility of waist circumference 395
percentile for risk evaluation in obese children. Int J Pediatr Obes. 2010;5(1):97-101. 396
PubMed PMID: 19606372. PMCID: 2851850. Epub 2009/07/17. eng. 397
6. Bell LM, Byrne S, Thompson A, et al. Increasing body mass index z-score is 398
continuously associated with complications of overweight in children, even in the healthy 399
weight range. J Clin Endocrinol Metab. 2007 Feb;92(2):517-22. PubMed PMID: 17105842. 400
Epub 2006/11/16. eng. 401
7. Boddy LM, Fairclough SJ, Atkinson G, Stratton G. Changes in cardiorespiratory fitness 402
in 9-10.9year old children: SportsLinx 1998-2010. Medicine and Science in Sports and 403
Exercise. 2012 Aug 3. PubMed PMID: 21814150. Epub 2011/08/05. Eng. 404
8. Boddy LM, Hackett AF, Stratton G. Changes in fitness, body mass index and obesity in 405
9-10 year olds. Journal of Human Nutrition and Dietetics 2010;23(3):254-9. 406
9. Boddy LM, Knowles ZR, Davies IG, et al. Using formative research to develop the 407
healthy eating component of the CHANGE! school-based curriculum intervention. BMC 408
Public Health. 2012;12:710. PubMed PMID: 22931457. PMCID: 3548762. Epub 2012/08/31. 409
eng. 410
10. Boddy LM, Murphy MH, Cunningham C, et al. Physical activity, cardiorespiratory 411
fitness, and clustered cardiometabolic risk in 10- to 12-year-old school children: The REACH 412
Y6 study. American journal of human biology : the official journal of the Human Biology 413
Council. 2014 Jul;26(4):446-51. PubMed PMID: 24599609. 414
11. Brambilla P, Bedogni G, Moreno LA, et al. Crossvalidation of anthropometry against 415
magnetic resonance imaging for the assessment of visceral and subcutaneous adipose tissue 416
in children. Int J Obes (Lond). 2006 Jan;30(1):23-30. PubMed PMID: 16344845. 417
12. Department of Health. Start Active, Stay Active: A report on physical activity for 418
health from the four home countries' Chief Medical Officers. 2011. 419
13. Duncan S, McPhee JC, Schluter PJ, Zinn C, Smith R, Schofield G. Efficacy of a 420
compulsory homework programme for increasing physical activity and healthy eating in 421
children: the healthy homework pilot study. Int J Behav Nutr Phys Act. 2011;8:127. PubMed 422
PMID: 22085440. PMCID: 3256102. Epub 2011/11/17. eng. 423
14. Fairclough SJ, Hackett AF, Davies IG, et al. Promoting healthy weight in primary 424
school children through physical activity and nutrition education: a pragmatic evaluation of 425
the CHANGE! randomised intervention study. BMC Public Health. 2013 Jul 2;13(1):626. 426
15. Fox KR, Cooper A, McKenna J. The school and promotion of children’s health 428
enhancing physical activity: perspectives from the United Kingdom. Journal of School 429
Health. 2004;2:338-58. 430
16. Freedman DS, Mei Z, Srinivasan SR, Berenson GS, Dietz WH. Cardiovascular risk 431
factors and excess adiposity among overweight children and adolescents: the Bogalusa 432
Heart Study. Journal of Pediatrics 2007;150(1):12-7 e. 433
17. Gobbi RM, Davies IG, Fairclough SJ, et al. Clustered Cardiometabolic Risk, 434
Cardiorespiratory fitness and Physical Activity in 10-11 year old children. The CHANGE! 435
Project Baseline." Archives of Exercise in Health and Disease 2012;3(3):207-13. 436
18. Gorely T, Nevill ME, Morris JG, Stensel DJ, Nevill A. Effect of a school-based 437
intervention to promote healthy lifestyles in 7-11 year old children. Int J Behav Nutr Phys 438
Act. 2009;6:5. PubMed PMID: 19154622. PMCID: 2637227. 439
19. Gortmaker SL, Peterson K, Wiecha J, et al. Reducing obesity via a school-based 440
interdisciplinary intervention among youth: Planet Health. Archives of Pediatrics and 441
Adolescent Medicine. 1999 Apr;153(4):409-18. PubMed PMID: 10201726. Epub 1999/04/14. 442
eng. 443
20. Graves LEF, Ridgers ND, Atkinson G, Stratton G. The effect of active video gaming on 444
children's physical activity, behaviour preferences and body composiiton. Pediatric Exercise 445
Science. 2010;22:535-46. 446
21. Greaves CJ, Sheppard KE, Abraham C, et al. Systematic review of reviews of 447
intervention components associated with increased effectiveness in dietary and physical 448
activity interventions. BMC Public Health. 2011;11:119. PubMed PMID: 21333011. PMCID: 449
3048531. Epub 2011/02/22. eng. 450
22. Hobkirk JP, King RF, Davies I, et al. The metabolic inter-relationships between 451
changes in waist circumference, triglycerides, insulin sensitivity and small, dense low-density 452
lipoprotein particles with acute weight loss in clinically obese children and adolescents. 453
Pediatr Obes. 2014 Jun;9(3):209-17. PubMed PMID: 23616363. 454
23. Hobkirk JP, King RF, Gately P, et al. The predictive ability of triglycerides and waist 455
(hypertriglyceridemic waist) in assessing metabolic triad change in obese children and 456
adolescents. Metab Syndr Relat Disord. 2013 Oct;11(5):336-42. PubMed PMID: 23758076. 457
24. Hopkins ND, Stratton G, Maia J, et al. Heritability of Arterial Function, Fitness, and 458
Physical Activity in Youth: A Study of Monozygotic and Dizygotic Twins. Journal of Pediatrics 459
2010;157:943-8. 460
25. Hopkins ND, Stratton G, Tinken TM, et al. Relationships between measures of fitness, 461
physical activity, body composition and vascular function in children. Atherosclerosis. 462
2009;204(1):244-9. 463
26. Jansen W, Borsboom G, Meima A, et al. Effectiveness of a primary school-based 464
intervention to reduce overweight. International Journal of Pediatric Obesity. 2011;6(2):e70-465
e7. 466
27. Jansen W, Borsboom G, Meima A, et al. Effectiveness of a primary school-based 467
intervention to reduce overweight. International journal of pediatric obesity. 2011 Jun;6(2-468
2):e70-7. PubMed PMID: 21609245. Epub 2011/05/26. eng. 469
28. Lohman T, Roche AF, Martorell R. Anthropometric standardization reference manual. 470
Kinetics H, editor. Champaign, Illinois1991. 471
29. Mackintosh KA, Knowles ZR, Ridgers ND, Fairclough SJ. Using formative research to 472
develop CHANGE!: a curriculum-based physical activity promoting intervention. BMC Public 473
30. Manios Y, Moschandreas J, Hatzis C, Kafatos A. Health and nutrition education in 475
primary schools of Crete: changes in chronic disease risk factors following a 6-year 476
intervention programme. Br J Nutr. 2002 Sep;88(3):315-24. PubMed PMID: 12207842. 477
31. Minetti AE. Walking on other planets. Nature 2001;409:467-8. 478
32. Mirwald R, Baxter-Jones A, Bailey D, Beunen G. An assessment of maturity from 479
anthropometric measurements. Medicine and Science in Sports and Exercise. 480
2002;34(4):689-94. 481
33. MRC Cognition and Brain Sciences Unit. Rules of thumb on magnitudes of effect sizes 482
[20.02.206]. Available from: http://imaging.mrc-cbu.cam.ac.uk/statswiki/FAQ/effectSize 483
34. Ness AR, Leary SD, Mattocks C, et al. Objectively Measured Physical Activity and Fat 484
Mass in a Large Cohort of Children PLoS Med. 2007;4(3):e97. 485
35. Qualifications and Curriculum Authority. Personal, social and health education key 486
stage 2. Non-statutory content. 1999. 487
36. Riddoch CJ, Mattocks C, Deere K, et al. Objective measurement of levels and patterns 488
of physical activity. Archives of Disease in Childhood. 2007 Nov;92(11):963-9. PubMed 489
PMID: 17855437. PMCID: 2083612. Epub 2007/09/15. eng. 490
37. Rosenbaum M, Nonas C, Weil R, et al. School-based intervention acutely improves 491
insulin sensitivity and decreases inflammatory markers and body fatness in junior high 492
school students. Journal of clinical endocrinology and metabolism. 2007 Feb;92(2):504-8. 493
PubMed PMID: 17090635. Epub 2006/11/09. eng. 494
38. Slawta JN, DeNeui D. Be a Fit Kid: nutrition and physical activity for the fourth grade. 495
Health Promot Pract. 2010 Jul;11(4):522-9. PubMed PMID: 19129432. 496
39. Steene-Johannessen J, Kolli, Bo Andersen L, Anderssen SA. Adiposity, aerobic fitness, 497
muscle fitness, and markers of inflammation in children. Medicine and Science in Sports and 498
Exercise. 2013;45(4):714-21. 499
40. Stratton G, Canoy D, Boddy LM, Taylor SR, Hackett AF, Buchan IE. Cardiorespiratory 500
fitness and body mass index of 9-11-year-old English children: a serial cross-sectional study 501
from 1998 to 2004. International Journal of Obesity. 2007;31(7):1172-8. 502
41. Taylor RW, Jones IE, Williams SM, Goulding A. Evaluation of waist circumference, 503
waist-to-hip ratio, and the conicity index as screening tools for high trunk fat mass, as 504
measured by dual-energy X-ray absorptiometry, in children aged 3-19 y. Am J Clin Nutr. 505
2000 Aug;72(2):490-5. PubMed PMID: 10919946. 506
42. Taylor RW, McAuley KA, Barbezat W, Strong A, Williams SM, Mann JI. APPLE Project: 507
2-y findings of a community-based obesity prevention program in primary school age 508
children. The American Journal of Clinical Nutrition. 2007 Sep;86(3):735-42. PubMed PMID: 509
17823440. Epub 2007/09/08. eng. 510
43. van Sluijs EM, McMinn AM, Griffin SJ. Effectiveness of interventions to promote 511
physical activity in children and adolescents: systematic review of controlled trials. BMJ. 512
2007 Oct 6;335(7622):703. PubMed PMID: 17884863. PMCID: 2001088. Epub 2007/09/22. 513
eng. 514
44. Vickers AJ, Altman DG. Analysing controlled trials with baseline and follow up 515
measures. BMJ. 2001;323:1123-4. 516
45. Wigan Council. Equality information and objectives 2011 [cited 2016 29th February]. 517
Available from:
http://www.wigan.gov.uk/Council/Strategies-Plans-and-Policies/Equality-518
and-Diversity/Equality-information-and-objectives.aspx. 519
Tables 521
Table 1. Participant characteristics at baseline adjusted for sex and IMD 522
Control N= 27 Intervention N= 26
mean (SE) mean (SE)
Age 10.62 (0.06) 10.64 (0.06)
Somatic Maturation (Years) -1.99 (0.08) -199 (0.08)
Stature (m) 1.46 (0.01) 1.45 (0.01)
Sitting Stature (m) 0.72 (0.007) 0.73 (0.007)
Mass (kg) 39.9 (1.5) 37.5 (1.5)
BMI (kg/m2) 18.5 (0.53) 17.82 (0.54)
BMI z-scores 0.43 (0.2) 0.24 (0.2)
Waist circumference (cm) 63 (0.01) 62 (0.01) 523
Table 2 Adjusted mean (SE) and partial ŋ2 for waist circumference, BMI Z-score, and VO2peak at 525
baseline, post intervention and follow up (where available), controlling for somatic maturation, IMD 526
and sex 527
Control N= 24 Intervention N= 22
Variable Time point mean (SE) mean (SE) P Value Partial ŋ2
Waist
Circumference (CM)
Baseline 63.8 0.01 61.5 0.02 .286
0.028
Post
intervention 65 0.01 61.3 0.01 .074
0.076
Follow Up 64.7 0.01 62.1 0.01 .212 0.038
BMI Z-score Baseline 0.44 0.21 0.27 0.22 .581 0.008
Post
intervention 0.49 0.22 0.26 0.22 .459
0.013
Follow Up 0.48 0.2 0.01 0.21 .128 0.056
VO2peak
(ml/kg/min) Baseline 41.41 1.96 44.4 2.06 .320
0.024
Post
Intervention 46.49 1.12 45.66 1.17 .620
0.006
Follow Up 44.61 1.7 49.26 1.78 .076 0.075
Whole Body Fat
Mass (kg) Baseline 11.34 0.88 9.62 0.93 .202
0.039
Follow Up 12.69 1.11 9.84 1.16 .093 0.067
Whole Body Fat % Baseline 26.34 1.29 24.3 1.35 .30 0.026
Follow Up 27.98 1.42 24.05 1.49 .073 0.076
Trunk Fat Mass
(kg) Baseline 4.02 0.42 3.02 0.44 .117
0.059
Follow Up 4.72 0.51 3.11 0.53 0.041* 0.098
Trunk Fat % Baseline 21.04 1.35 18.13 1.42 .159 0.048
Follow Up 23.08 1.49 17.75 1.56 .022* 0.122
Peripheral Fat
Mass (kg) Baseline 6.52 0.48 5.82 0.5 .334
0.023
Follow Up 7.17 0.61 5.95 0.63 .187 0.042
Peripheral Fat % Baseline 32.03 1.68 30.17 1.76 .462 0.013
Whole Lean Body
Mass (kg) Baseline 2.93 0.46 2.88 0.48 .470
0.013
Follow Up 3.01 0.94 2.88 0.48 .935 0.000
Whole Lean Body
Mass % Baseline 73.67 1.29 75.70 1.35 .300
0.026
Follow Up 72.03 1.42 75.95 1.49 .073 0.076
528
Table 3. Change scores (SE) and partial ŋ2 between groups at all time points, controlling for sex, 530
somatic maturation (baseline), IMD and baseline values 531
Control N= 24 Intervention N= 22
Variable Time point Change
Score (SE)
Change
Score (SE)
P Value Partial ŋ2
Waist
Circumference (cm) Baseline to Post 1.1 0.5 0.4 0.5 .355
0.030
Baseline to Follow Up 1.3 0.4 -0.2 0.4 .023* 0.166
BMI Z-score Baseline to Post 0.042 0.097 0.001 0.102 .792 0.002
Baseline to Follow Up 0.042 0.096 0.002 .102 .796 0.002
VO2peak
(ml/kg/min) Baseline to Post 4.10 0.90 2.37 0.95 .239
0.052
Baseline to Follow Up 2.87 1.77 5.25 1.87 .410 0.042
Whole Body Fat
Mass (kg) Baseline to Follow Up 1.84 1.06 -0.31 1.12 .219
0.096
Whole Body Fat % Baseline to Follow Up 2.04 1.50 -0.68 1.58 .268 0.095
Trunk Fat Mass (kg) Baseline to Follow Up 1.02 0.45 -0.26 0.48 .090 0.024
Trunk Fat % Baseline to Follow Up 2.60 1.5 -1.32 1.58 .091 0.022
Peripheral Fat Mass
(kg) Baseline to Follow Up 0.80 0.61 -0.04 0.65 .402
0.008
Peripheral Fat % Baseline to Follow Up 2.22 1.96 -.330 2.07 .425 0.042
Whole Lean Body
Mass (kg) Baseline to Follow Up 1.36 0.99 0.57 1.05 .623
0.000
Whole Lean Body
Mass % Baseline to Follow Up -2.04 1.50 0.68 1.58 .268
0.012
BMC (kg) Baseline to Follow Up 0.07 0.04 0.06 0.04 .925 0.024
BMD (g/cm2) Baseline to Follow Up 0.017 0.013 0.005 0.014 .565 0.048
532