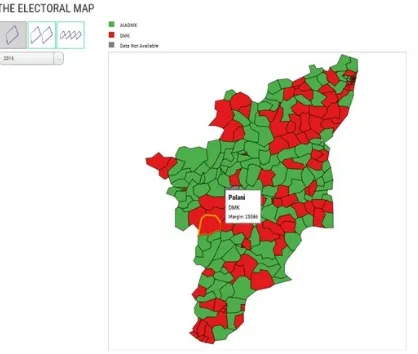
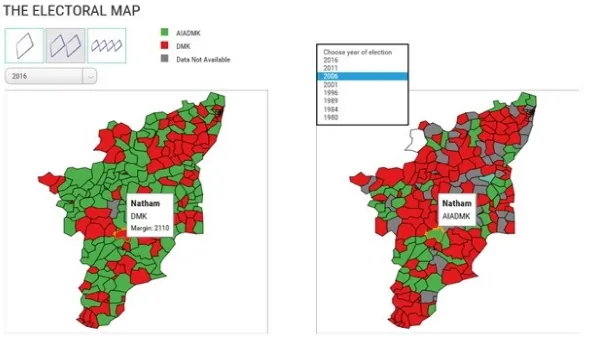
Visualization of election data: Using interaction design and visual discovery for communicating complex insights
Full text
Figure
Related documents
Further experiences with the pectoralis myocutaneous flap for the immediate repair of defects from excision of head and
To investigate the role of the positively charged head and negatively charged “stem” patches in the CsgE-CsgA interaction, we examined the effect of mutations in the head and
Considering only women who received abortion care from public facility where there is shortage contraception supplies in study conducted in two of the region and failing to
The use of sodium polyacrylate in concrete as a super absorbent polymer has promising potential to increase numerous concrete properties, including concrete
The proposed indexing that uses Generalized Hash Tree (GHT) expedites projection and selection operations on encrypted medical XML records stored in WORM storage.. We implemented
19% serve a county. Fourteen per cent of the centers provide service for adjoining states in addition to the states in which they are located; usually these adjoining states have
(a) Empirical values by year and species (averaged across cohorts and microhabitats); (b) empirical values by year and microhabitat (averaged across species and cohorts). Retained
This includes decreas- ing the contamination rate to the environment by colonized patients and contaminated health care workers by employ- ing regular time-tabled cleaning
