OPTIMAL ZONING OF FORESTED LAND CONSIDERING THE
CONTRIBUTION OF EXOTIC PLANTATIONS
Jay A. Anderson
1, Glen W. Armstrong
2, Martin K. Luckert
1,
Wiktor L. Adamowicz
11Department of Resource Economics and Environmental Sociology 2Department of Renewable Resources
University of Alberta, Edmonton, Canada T6G 2H1
Abstract.Previous studies suggest that management intensity zoning systems, such as the triad approach, could allow Canada’s forest industry to maintain or increase timber harvest levels while simultaneously reducing its environmental impact. In most such studies, the zones are exogenously specified. In this study, we use a linear programming model to endogenously allocate forest land to management intensity zones given several alternative policy scenario formulations. We examine how alternative policy scenarios affect the net present value of the optimal forest management plan, timber output, and the spatial allocation of land to management intensity zones. We conclude that policies which facilitate optimal zoning could enable land use specialization to increase both profits and ecological protection. Such zoning, however, can only happen if provincial governments in Canada revise their forest policies with respect to allocation of forest tenures and establishment of exotic plantations on public forest land.
Keywords: timber supply, triad, hybrid poplar
Introduction
Forest management in most of Canada’s boreal for-est involves relatively low intensity silviculture: it con-sists of timber harvesting and reestablishing the har-vested areas to regenerating forest such that provincial government standards with respect to species mix and stocking standards are met. These practices would be considered extensive forest management using the ter-minology of Carmean (2007). Because of the relatively small input into stand establishment and tending, very little of the forest land in Canada is considered to be plantation forest by the United Nations Forest Resource Assessment (FAO, 2006). A very large fraction (93%) of Canada’s forest land is publicly owned (Natural Re-sources Canada, 2010). Therefore, public forest policy plays an important role in determining forest manage-ment practices.
Planting of exotic tree species is precluded on most of Canada’s public land (e.g. Johnston and Williamson, 2008). The exceptions, British Columbia and Quebec, will be discussed later. These rules exist to protect the genetic diversity present in Canada’s forests by requir-ing plantrequir-ing stock to originate from seed sources near the
planting site. Some fear that allowing foreign and hybrid species will reduce the diversity of the gene pool and pos-sibly open the door for genetically modified trees, a prac-tice which Greenpeace (2010) calls “genetic pollution”. However, since none of the indigenous tree species in Canada’s boreal forest appears suited for short-rotation intensive forestry, these rules limit the possibilities for intensifying the fibre-producing potential of Canada’s boreal forest.
Until recently, rights to harvest timber on public land were subject to explicit “use-it-or-lose-it” policies. See, for example, Alavalapati and Luckert (1997) for a dis-cussion of this policy in Alberta. These policies were meant to maximize industrial development by forcing a firm to use all of the public forest allocated to it for tim-ber production, or risk losing it to another firm. So, for example, if a firm decided to preclude harvest on some of its tenure area to provide an ecological benchmark, or to reduce its overall delivered wood costs, the provincial government could have viewed this as a violation of the terms of the tenure agreement, and remove the area in question from the tenure area. It would then have the option of reallocating this land to another firm.
Partly as a result of the Softwood Lumber Agreement between Canada and USA, penalties for “under-cutting” have been removed from provincial forest management legislation. Even without explicit “use-it-or-lose-it” poli-cies, most forms of Canadian forest tenure still require that the forest be managed to maximize the sustained yield of timber – making it uncertain whether a firm would be allowed to retain the portions of its manage-ment area that it has set aside. This uncertainty is a substantial disincentive to firms considering a reduction in areas harvested, much to the detriment of calls to preclude industrial activities on a substantial fraction of the boreal forest (e.g. Boreal Songbird Initiative, 2007). Moreover, such large scale removal of forest from the productive land base could negatively impact forestry firms, which have made significant capital investments based on current levels of timber production. Nonethe-less, Canada is below average when it comes to ecologi-cal benchmarks, having protected only 8% of its forests, compared to the global average of 12.4% in 2000 (FAO, 2001).
Sedjo (1999) identifies a global trend of replacing tim-ber harvested from natural forests with timtim-ber from fast-growing plantations. In 2000, plantations produced 35% of global roundwood, and are expected to produce 44% by 2020 (FAO, 2001). Yet data from the United Nations Forest Resource Assessment suggests Canada is not fol-lowing this trend (FAO, 2006). Instead of harvesting fast-growing plantation timber close to mill sites, most harvesting in Canada is still occurring on virgin forest or relatively slow-growing naturally (or near-naturally) re-generated forest. Hence, Canada’s forestry sector faces upward pressures on log haul costs at a time when plan-tation forestry in an increasingly globalized economy seems to be exerting downward pressures on forest prod-uct prices.
Unfortunately, tree species indigenous to Canada have little potential for short-rotation forestry. Stand level analysis typically shows that intensive management of native species in Canadian boreal regions is not finan-cially feasible (e.g. Adamowiczet al., 2003; Rodrigues, 1998). With a forest-level analysis, an immediate in-crease in allowable annual cut can be a benefit of inten-sified silviculture. Yet, even when the allowable cut ef-fect (Schweitzer et al., 1972) is considered,the financial returns to managing native species are mixed (Hegan and Luckert, 2000), and policies in Canada have largely prevented firms from realizing benefits from those cases where returns could be positive (Luckert and Haley, 1995). There are, however, alternatives to native species; and stand-level financial analyses suggest that policy re-form could make intensive management of hybrid poplar feasible in Canada’s boreal regions (Anderson and Luck-ert, 2007). Indeed, some researchers expect that poplar
will lead the way towards tree domestication (Brad-shaw and Strauss, 2001). Although policies prevent the use of hybrid poplar on public land in most Canadian provinces, the use of exotics is beginning to gain some acceptance. British Columbia and Quebec have begun allowing hybrid poplar within their public forests, and in 2005 there were 4 900 ha of such plantations (Richardson
et al., 2005).
Messier (2007) suggests that “one ha of hybrid poplar can be used to put aside 5 to 14 ha of forest for other [i.e. non-timber] purposes” while maintaining the cur-rent level of fibre production from the forest. Although “other purposes” could include land use by other indus-tries, he stresses that it should also include protected ar-eas of forests in natural or near-natural states. Along the same line, Victor and Ausubel (2000) foresee a “Great Restoration” of natural forests because “efficient farmers and foresters are learning to spare forestland by grow-ing more food and fiber in ever-smaller areas”. They suggest the continuing evolution towards fast-growing plantations will shrink production forests to about 12% of the world’s woodlands by 2050.
Zoning systems could provide a policy framework for the coexistence of plantations and protected areas. A zoning system frequently discussed in Canada is the triad approach. As its name implies, the triad approach involves three management intensity zones: protected, extensive, and intensive. Logging is typically excluded from the protected zone, regeneration effort is minimal in the extensive zone, and much effort is expended in the intensive zone on regeneration and stand tending. The hope is that the increased productivity in the intensive zone will offset lost production as a result of creating the protected zone (Binkley, 1997; Gladstone and Ledig, 1990; Hunter and Calhoun, 1996). Such zoning creates land use specialization, where the purpose of the inten-sive zone is to produce timber value, the purpose of the protected zone is to produce or protect non-timber val-ues such as biodiversity and ecosystem function, and the extensive zone will produce and protect some of both.
Our objective is to develop a model to assess how land use specialization might occur through the economic de-cisions of private firms in Canadian boreal regions if pol-icy constraints were relaxed. We begin by defining polpol-icy scenarios that could enable firms to implement zoning, should it make financial sense. We then use a forest man-agement scheduling model to estimate how these policies influence the behaviour of a profit-maximizing forestry firm. Our optimal zoning approach suggests how each policy impacts the net present value of the optimal for-est management plan and the spatial composition of the forest, which includes the location of plantations and non-harvested areas. For the purpose of this study, we assume that one possible use of these non-harvested ar-eas is to set them aside as protected arar-eas. We fully realize that low value for timber production is not usu-ally the primary criterion in identifying protected areas, but it may be a consideration.
We build upon previous work by Montigny and MacLean (2006) and Krcmar et al. (2003). Both of these studies use forest management models to analyze triad zoning, and both find that higher environmental demands may be satisfied under triad zoning without increasing the financial burdens on the industry, or re-ducing its wood supply.
Our approach differs from these articles in three ma-jor ways: First, these studies exogenously specify land allocations to the different zones. For example, Krcmar
et al.(2003) constrain their model to only analyze three levels of forest protection – 8%, 12% and 15%. Montigny and MacLean (2006) use scenario planning to simulate effects of 64 predetermined allocations, each within the bounds of 0-15% protection, 39-64% intensive, and 21-61% extensive. In our approach we analyze policies that enable firms to allocate land to the different zones such that the net present value of their actions is maximized. We do not refer to our optimal zoning approach as a triad approach for the simple reason that we are con-sidering five management intensities, and not just three. Second, instead of studying only private land (Montigny and MacLean, 2006) or only public land (Krcmaret al., 2003), we look at interactions between private and pub-lic land. That is, we construct a model that allows firms to make land use specialization decisions across public and private land. Finally, instead of conducting a case study of a particular area, we construct a simple styl-ized forest management unit. This approach allows us to consider the impact of different policies in a more general manner.
In the next section we describe the various policies to be analyzed. Then we describe the starting inventory and yield assumptions for the stylized forest. A linear programming based timber supply model is then
devel-oped. Finally, we show the modelling results for each of the policies, and conclude with a brief discussion.
Policy scenario descriptions
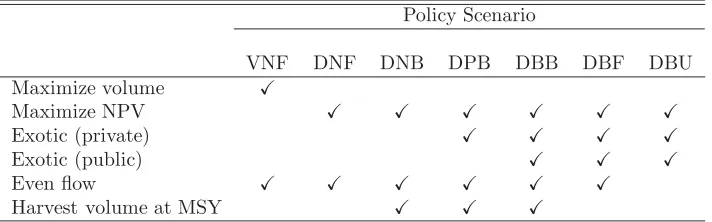
We created seven policy scenarios with which we ex-plore the effects of optimal zoning on the firm’s prof-its and harvest volume. Each policy scenario is iden-tified with a three-letter code; the first letter indicates whether total harvest volume (V) or net present value (D) is being maximized; the second indicates whether exotic plantation is forbidden (N), permitted on private land only (P), or permitted on both private and public land (B); the third letter indicates the kind of even-flow constraint imposed where (F) indicates evenflow, (B) in-dicates evenflow at the maximum sustained yield (MSY) level, and (U) indicates completely unconstrained.
We explore seven policies that allow firms to make land use specialization decisions based on financial in-centives.
VNF This policy scenario is meant to represent current practice in Alberta. The harvest volume is calcu-lated as the maximum even-flow volume from public land. No exotics are permitted.
DNF This policy scenario maximizes net present value (NPV) of timber harvest subject to even flow of harvest volume. No exotics are permitted. It is possible to leave forested land unharvested.
DNB This policy scenario is identical toDNFexcept that the harvest volume in each period is constrained to be that found for policy scenarioVNF. This repre-sents the NPV maximizing harvest schedule which will achieve the harvest volume flow from the base policy scenario.
DPB The same as policy scenario DNB except exotics are permitted on private land. It is also accept-able to leave some forested land unharvested. Be-cause part of the demand for wood volume is being supplied from private land, some public land could conceivably be freed up for other uses.
DBB The same as policy scenario DPB except exotics are permitted on both private and public land.
DBF The same as policy scenarioDBBexcept that the even-flow harvest level is not constrained to the level fromVNF.
DBU The same as policy scenarioDBFexcept that there are no flow constraints whatsoever.
Table 1: Summary of policy scenarios.
Policy Scenario
VNF DNF DNB DPB DBB DBF DBU Maximize volume
Maximize NPV
Exotic (private)
Exotic (public)
Even flow
Harvest volume at MSY
Table 2 shows permitted management intensity tran-sitions for the three exotic plantation policies (i.e. not permitted, permitted on private land only, or permit-ted on both public and private land). The rows indicate the management intensity of the harvested stand and the columns indicate the management intensity of the regenerated stand. The cells which contain the letter corresponding to each of the three exotic policies exam-ined, indicate permissible transitions under that policy scenario.
Timber Supply Model
We construct a stylized representation of a mill site and the surrounding public and private land. We assume the mill site can access two million ha of land, of which half is public and half is private. The mill site is spatially located directly between the private and public land.
The landscape is segmented into development types, each of which is described using the following five at-tributes:
1. Ownership. Each development type is either private or public.
2. Haul zone. Each development type is located in one of ten, 20 km wide haul zones. Their midpoint distances range from 10 to 190 kilometers from the mill site (Fig. 1).
3. Management intensity. All private development types start as agriculture and all public develop-ment types start as native species growing accord-ing to the leave for natural (LFN) yield curves (dis-cussed in next paragraph). Each development type can be differentiated as LFN, native plantation, ex-otic plantation, agriculture, or protected. For a de-scription of possible transitions for each manage-ment intensity, see Table 2.
4. Timber productivity rating. There are four tim-ber productivity ratings (TPRs): good, medium, fair, and unproductive. Within each haul zone,
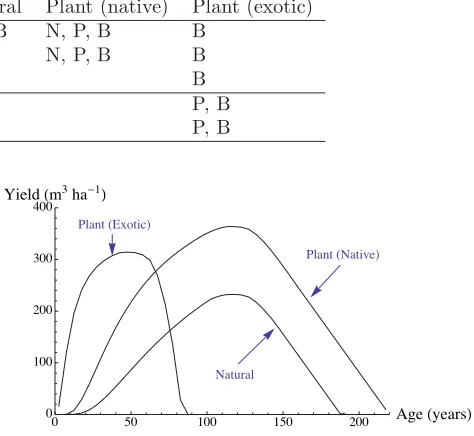
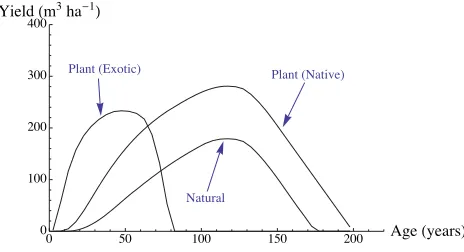
the TPRs are assigned such that 25% (i.e. 25 000 ha) of the land is in each TPR. The unproductive TPR represents land incapable of producing mer-chantable timber. There are yield curves for each management intensity corresponding to the three productive TPRs, as shown in Figures 2 – 4. These yield curves are meant to be illustrative of the mer-chantable timber production typical to Canadian boreal conditions, as the “native” curves roughly correspond to yield curves for trembling aspen (e.g. Government of Alberta, 1985), while the “exotic” curves were compiled by Anderson and Luckert (2007) using hybrid poplar growth data collected by the Prairie Farm Rehabilitation Administration (2001). The rapid decline in merchantable volume is a result of the relatively early mortality and de-composition of deciduous species in Canada’s bo-real forest. Unproductive sites are assumed to have a yield of zero, and are not considered in this anal-ysis.
5. Age. If a development type is forested, it is assigned to a 5-year age class. The age distribution of the starting public forest is assumed to be comprised of young and old timber, with a gap in the mid-dle (see Fig. 5). Such an age class distribution is representative of much of Canada’s forest, which in many regions has experienced little harvesting until recently, and therefore is still predominantly virgin timber (which makes up the older age classes) with some area in the younger age classes as a result of recent harvesting.
The model
Table 2: Permitted management transitions. Each cell indicates which of the 3 exotic plantation policies a manage-ment transition is permitted. Blank cells indicate that the transition is not permitted under any policy. The letters N, P, and B in the table body correspond to the exotic plantation policy for each of the policy scenarios as indicated by the three-letter scenario code: N indicates policy scenarios where no exotic plantations are permitted, P indicates exotic plantations are permitted on private land, and B indicates runs where exotic plantations are permitted on both public and private land. As an example to aid in interpretation, the “N,P,B” for the cell describing the transition of public land with a pre-harvest intensity of “Natural” and a post-harvest intensity of “Plant (native)” means that the transition is permitted under the N, P, and B exotic policies.
Post-harvest intensity
Ownership Pre-harvest intensity Natural Plant (native) Plant (exotic) Public Natural N,P,B N, P, B B
Plant (native) N, P, B B
Plant (exotic) B
Private Plant (exotic) P, B
Agriculture P, B
# $ % & ' ( ) * + #"
#" %" '" )" +" ##" #%" #'" #)" #+"
Figure 1: Schematic map of the forest indicating owner-ship, TPR, and haul zone.
Model II approach, decision variables are created which represent the management activities occurring in a de-velopment type class between its period of establishment and final harvest. In our model, decision variables repre-sent the area of each of these development type classes to be harvested and regenerated to each permissible man-agement intensity. There are also decision variables that represent the area of each development type class left un-harvested at the end of the planning horizon. Because this is a Model II representation, a set of constraints is imposed to ensure that all of the area harvested in any period of the planning horizon is regenerated as new development types in the same period. We have speci-fied policy constraints which can be used to control the harvest volume in the first period, and the relationship between the harvest level in a period and the period pre-vious to it. Permissible transitions between management intensities vary by policy scenario and are controlled by a set of parameters. Depending on the policy scenario being examined, the objective function of model max-imizes either total volume harvested over the planning horizon or net present value.
Plant (Exotic)
Plant (Native)
Natural
0 50 100 150 200 Ageyears 0
100 200 300 400 Yieldm3ha1
Figure 2: Yield curves for good TPR sites.
The model was implemented in GNU MathProg (Makhorin, 2010b) and solved using the GNU Linear Programming Kit (Makhorin, 2010a). GNU MathProg permits the use of set notation and operations in the de-velopment of mathematical programming models. Our model formulation uses this capability extensively, as it allows for a concise representation of the model. The source code for the GNU MathProg models is avail-able from the University of Alberta’s Education and Re-search Archive at the permalink http://hdl.handle. net/10402/era.28408. The model is defined mathe-matically below.
Control parameters Control parameters are used to
specify some of the most basic assumptions in the model. The parameterT represents the number of periods in the planning horizon. N represents the minimum harvest age in periods. In all of the model runs, T = 40, and
N = 1. Each period represents five years. By setting
Plant (Exotic)
Natural
Plant (Native)
0 50 100 150 200 Ageyears 0
100 200 300 400 Yieldm3ha1
Figure 3: Yield curves for medium TPR sites.
Plant (Exotic)
Plant (Native)
Natural
0 50 100 150 200 Ageyears 0
100 200 300 400 Yieldm3ha1
Figure 4: Yield curves for fair TPR sites.
number of decision variables by setting N to a larger number.
Sets We use a number of sets to define the model. H is the set of haul zones,S is the set of site classes, So is a subset ofSrepresenting the productive site classes,Ois the set of ownership classes,I is the set of management intensity classes, Ais the set of possible age classes, Be is the set of birth periods for existing development type classes based on the starting age class distribution, and
Bfis the set of birth periods for future development type
1 2 3 4 5 6 7 8 9 10 11 12 13 14 15 16 17 18 19 20 21 22 23 24 25 26 27 28 29 30 Age Classperiods 5000
10 000 15 000 20 000 25 000 30 000 35 000
Areaha
Figure 5: Starting age class distribution for stylized for-est. Age classes are in five-year wide periods.
classes. The membership of the set Be is determined by the age class distribution of the existing forest. The membership ofBeshown below reflects the data we used. Establishment period refers to the period in which a development type class was established. We use the con-vention that the first period in the planning horizon is designated as 1, the second as 2, and so on. For de-velopment type classes that were established before the beginning of the planning horizon (i.e. existing devel-opment type classes), we use the convention that the establishment period is 0 for a development type class established in the period immediately before the start of the planning horizon, -1 for a development class type established two periods before the start of the planning horizon, and so on.
The sets used in the model formulation are defined below.
H ={1, . . . ,10}
S={Good,Medium,Fair,Unproductive}
So={Good,Medium,Fair}
O={Public,Private}
I={Natural,Plant(Native),Plant(Exotic),Agriculture}
A={1, . . . ,80}
Be={−29,−28, . . . ,−16,−5,−4, . . . ,0}
Bf ={1, . . . , T}
We define a number of other sets using the basic def-initions above. The set of all possible combinations of haul zone and productive TPR classes is Φ =H×So.
The set Ωeis the set of 2-tuples representing all pairs of establishment and harvest periods for existing devel-opment types which correspond to a harvest age greater thanN periods. It is defined as
Ωe={(i∈Be, j∈Bf) :j−i≥N} (1)
We define a similar set of 2-tuples for future development types:
Ωf ={(i∈Bf, j∈Bf) :j−i≥N}. (2)
For each establishment period for existing develop-ment type classes, we create a set of permissible harvest periods based on the minimum harvest age, and a set of permissible establishment periods for each harvest pe-riod. This set is used in the constraint used to balance establishment and harvest.
Φexi∈Be ={j∈Bf :j−i≥N} (3)
Φey
j∈Bf ={i∈Be:j−i≥N} (4)
We do the same for future development type classes.
Φfxi∈Bf ={j∈Bf :j−i≥N} (5)
Φfy
The management intensity transition rules specified in Table 2 are implemented as two sets of 3-tuples, which are populated in the data section of the GNU MathProg implementation of the model. The set of 3-tuples Λe con-tains all permitted combinations of O, I for harvested development type classes, and I for regenerated devel-opment type classes. If the 3-tuple (o, i, j) is in Λe, it is permissible to transfer existing development type classes in ownershipo and management intensityi to manage-ment intensity j immediately post-harvest. A similar set of 3-tuples Λf contains all permitted combinations ofO,I for regenerated development type classes, andI for harvested development type classes.
For each combination of ownership and current man-agement intensity (from-intensity), we create a set of the permissible post-harvest management intensities (intensities). For each combination of ownership and to-intensity, we create a set of permissible from-intensities. For existing development types,
Ψexo∈O,mb∈I ={md∈I: (o, mb, md)∈Λe} (7)
Ψeyo∈O,md∈I ={mb∈I: (o, mb, md)∈Λe} (8)
and for future development types,
Ψfxo∈O,mb∈I ={md∈I: (o, mb, md)∈Λf} (9)
Ψfyo∈O,md∈I ={mb∈I: (o, mb, md)∈Λf}. (10)
The set of 2-tuples Θeand Θfrepresent the valid com-binations of ownership and from-intensity for develop-ment types left unharvested at the end of the planning horizon. These are defined in the data section of the model.
The set of 5-tuplesU=H×So×Θe×Be is used to represent valid combinations of haul zone, TPR, owner-ship, from-intensity, and establishment period for ex-isting development types. The set of 5-tuples V =
H ×So×Θf ×Bf represents the same for future de-velopment types.
The set of 7-tuples W =H×So×Λe×Ωe contains valid combinations of haul zone, TPR, ownership, from-intensity, to-from-intensity, establishment period, and harvest period for existing development type classes. The set
X =H×So×Λf×Ωf does the same for future devel-opment type classes.
Parameters The parameterR is used to represent the
real annual discount rate. The parameter Mt is used to represent the midpoint (in years) of each period
t ∈ {1, . . . , T}. Because we are using five-year peri-ods, we calculate Mt = 52 + 5(t−1). The parameter
Dt is used to represent the discount factor for each pe-riod t∈ {1, . . . , T} assuming all costs and revenues oc-cur at the midpoint of the period. It is calculated as
Dt= (1 +R)−Mt.
The yield tables, indexed by management inten-sity, TPR, and age, are stored in the parameter
Ym∈I,s∈S,a∈A. The initial forest inventory, indexed by ownership, haul class, TPR, management intensity and establishment period is stored in the parameter
Qo∈O,h∈H,s∈S,m∈I,bp∈Be. The mean haul distance for
each haul zone class is stored in Fh∈H. The haul cost for each haul zone class is Cr
h∈H = 0.07Fh. The mill-gate value of wood ($ m−3) is stored in the parameter
P. Logging cost ($ ha−1) is stored in the parameter
Cl bm∈I which is fixed for each management intensity of the stand at harvest. Reforestation cost ($ ha−1) is stored in the parameter Cr
bd∈I which is fixed for the management in-tensity of the regenerated stand. Land procurement costs are the costs of changing the management intensity of an area of land at the moment between harvest and re-generation. For example, the acquisition of private land for exotic plantation establishment comes at a cost. The land procurement cost is stored inCmbp ∈I,md∈I.
Variables We create decision variables to represent the
area (ha) of forest assigned to various prescriptions:
• uh,s,o,mb,tbrepresents the area of each valid combi-nation of haul zone, TPR, ownership, management intensity, and establishment period in existing de-velopment type classes left unharvested at the end of the planning horizon,
• vh,s,o,mb,tb represents the area of each valid combi-nation of haul zone, TPR, ownership, management intensity, and establishment period in future devel-opment type classes left unharvested at the end of the planning horizon,
• wh,s,o,mb,md,tb,td represents the area of each valid combination of haul zone h, TPR s, ownership o, from-intensity mb, and establishment period tb in existing development type classes, to be scheduled for final harvest in harvest periodtdand transferred to to-intensitymd, and
• xh,s,o,mb,md,tb,td represents the area of each valid combination of haul zone h, TPR s, ownership o, from-intensity mb, and establishment period tb in future development type classes, to be scheduled for final harvest in harvest periodtdand transferred to to-intensitymd.
We also create some accounting variables to aid in model formulation.
• N P V represents net present value ($),
• P Vt∈{1,...,T} represents the volume harvested in
each periodT.
All the decision and accounting variables, except for
N P V, are constrained to be non-negative: N P V can take on any real value.
Objective function coefficients Coefficients are
needed for the objective function for each of our deci-sion variables. Depending on the policy scenario being examined, the model maximizes either volume or NPV.
Volume maximization In the volume maximization
case, the objective function coefficients are simply the harvest volumes associated with a management inten-sity, TPR class, and age class stored in the yield table parameter. The coefficientsωvrefer to yields for existing stands andχv refer to future stands (Eqs. 11-12).
ωh,s,o,mb,md,tb,tdv =Ymb,s,td−tb∀(h, s, o, mb, md, tb, td)∈W (11)
χvh,s,o,mb,md,tb,td=Ymb,s,td−tb∀(h, s, o, mb, md, tb, td)∈X (12)
NPV maximization The coefficients for the NPV
maximization objective function represent the dis-counted net revenue ($ ha−1) associated with each de-cision variable. The coefficients for existing stands are represented byω; coefficients for future stands are rep-resented by χ(Eqs. 13-14).
Equations Now that definitions are complete, we
spec-ify the linear program in Eqs. 15–22 (Table 3).
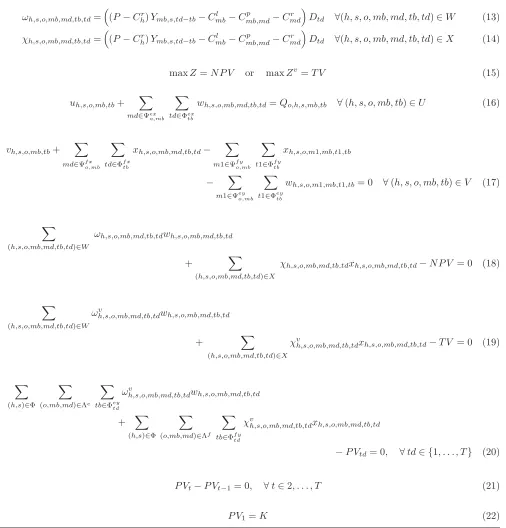
Depending on the policy scenario, either a volume or NPV maximizing objective function is chosen (Eq. 15). The initial area constraints (Eq. 16) ensure that all of the existing forest area is assigned to harvest or no-harvest decision variables and that the area harvested from each development type class cannot be greater than the area available. The establishment-harvest transfer constraints (Eq. 17) ensure that all area harvested from a development type class is regenerated as a new devel-opment type class, possibly with a different management intensity. The net present value accounting constraint (Eq. 18) serves to assign the net present value to the vari-ableN P V for use in the objective function and reporting purposes. Similarly, the total harvest volume accounting constraint (Eq. 19) transfers the total volume harvested to the variableT V for use in the objective function and reporting. Accounting contraints are also used to trans-fer periodic volume harvested to appropriate accounting variables (Eq. 20). These are used in periodic volume flow constraints (Eq. 21) and the initial period harvest level constraint (Eq. 22).
The different policy scenarios are modeled by choos-ing the appropriate objective function (Eq. 15), modify-ing or removmodify-ing the periodic harvest volume constraints (Eqs. 21 and 22), and changing Λe and Λf in the data section of the model to specify the permitted changes in management intensity.
Data The analysis presented here is for a stylized exam-ple: however we attempted to use data within the range of plausibility. All costs and revenues are expressed in constant Canadian dollars.
Buongiorno and Gilless (2003) argue that timberland investments have a risk level similar to corporate bonds and therefore a potential benchmark discount rate for forestry investment analysis are Aaa corporate bond yields in the United States. Between 1970 and 1999 these yielded an average nominal rate of return of 9.1% in the wake of average inflation of 5.2% corresponding to a real rate of return of 3.7%. For this study, we set
R= 0.037.
We set the mill-gate price for timber P to $48.69/m3based on an average mill-gate value for Canada (WRI, 2000).
Table 3: Equations of the linear program.
ωh,s,o,mb,md,tb,td=
(P−Chr)Ymb,s,td−tb−Cmbl −Cmb,mdp −Cmdr
Dtd ∀(h, s, o, mb, md, tb, td)∈W (13)
χh,s,o,mb,md,tb,td=
(P−Chr)Ymb,s,td−tb−Cmbl −Cmb,mdp −Cmdr
Dtd ∀(h, s, o, mb, md, tb, td)∈X (14)
maxZ =N P V or maxZv=T V (15)
uh,s,o,mb,tb+
md∈Ψex o,mb
td∈Φex tb
wh,s,o,mb,md,tb,td=Qo,h,s,mb,tb ∀(h, s, o, mb, tb)∈U (16)
vh,s,o,mb,tb+
md∈Ψfx
o,mb
td∈Φfx
tb
xh,s,o,mb,md,tb,td−
m1∈Ψfy
o,mb
t1∈Φfy
tb
xh,s,o,m1,mb,t1,tb
−
m1∈Ψeyo,mb
t1∈Φeytb
wh,s,o,m1,mb,t1,tb= 0 ∀(h, s, o, mb, tb)∈V (17)
(h,s,o,mb,md,tb,td)∈W
ωh,s,o,mb,md,tb,tdwh,s,o,mb,md,tb,td
+
(h,s,o,mb,md,tb,td)∈X
χh,s,o,mb,md,tb,tdxh,s,o,mb,md,tb,td−N P V = 0 (18)
(h,s,o,mb,md,tb,td)∈W
ωvh,s,o,mb,md,tb,tdwh,s,o,mb,md,tb,td
+
(h,s,o,mb,md,tb,td)∈X
χvh,s,o,mb,md,tb,tdxh,s,o,mb,md,tb,td−T V = 0 (19)
(h,s)∈Φ
(o,mb,md)∈Λe
tb∈Φey
td
ωvh,s,o,mb,md,tb,tdwh,s,o,mb,md,tb,td
+
(h,s)∈Φ
(o,mb,md)∈Λf
tb∈Φfytd
χvh,s,o,mb,md,tb,tdxh,s,o,mb,md,tb,td
−P Vtd= 0, ∀td∈ {1, . . . , T} (20)
P Vt−P Vt−1= 0, ∀t∈2, . . . , T (21)
P V1=K (22)
Conversion costs represent the costs incurred when the firm chooses to convert public land to an exotic planta-tion. In this case we assume native timber has been harvested and there will be costs to achieving a bare land state similar to private land. A previous Alberta study found that land clearing costs are approximately
For stand establishment or reforestation costs (Cr) we follow Insley et al.(2002) who assume that the costs of leave-for-natural reforestation is $5/ha and that native plantations cost $930/ha, which is assumed to cover the present value cost of site preparation, nursery stock, and planting.
For exotic plantations, Alberta-Pacific’s reforestation costs are provided by Thomas and Kaiser (2003), and when they are discounted to year zero and summed, the present value is $1 231/ha. In addition to this value, for exotic plantations we estimate that a post-harvest cost of $175/ha will be necessary to unearth and burn the stumps after harvesting. Our estimate for this post-harvest cost is less than the $300/ha public land con-version cost because we assume that once the land has been converted to a plantation, subsequent harvests of the short-rotation plantations will require less piling and burning.
We define a reforestation cost (Cr
mb,mdj) which is used to represent the sum of conversion and stand establish-ment costs for developestablish-ment type classes transitioning from management intensity mb to md at the time of harvest.
Results
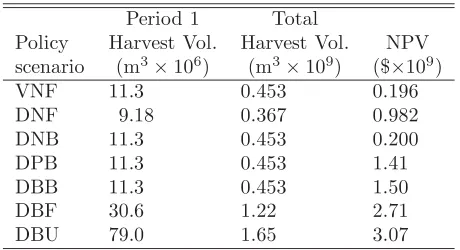
The results from each of the seven policy scenarios are summarized in Table 4 and Fig. 6. In the status quo policy scenario of volume maximization, no exotics, and even-flow (VNF), all public forest land is managed using the plant (native) intensity. An even-flow timber harvest volume of 11.3 million m3/period is achieved with an NPV of $0.196 billion.
Table 4: Policy scenario run summary.
Period 1 Total
Policy Harvest Vol. Harvest Vol. NPV scenario (m3×106) (m3×109) ($×109)
VNF 11.3 0.453 0.196
DNF 9.18 0.367 0.982
DNB 11.3 0.453 0.200
DPB 11.3 0.453 1.41
DBB 11.3 0.453 1.50
DBF 30.6 1.22 2.71
DBU 79.0 1.65 3.07
When the objective is changed to NPV maximization (policy scenario DNF), the results change in an interest-ing way: harvest volumes decrease by about 20%, but NPV is five times what it was in the status quo policy scenario. This is achieved by reducing the management intensity on fair sites, and medium sites in haul zone 4 and further. There is more land being scheduled for
nat-ural regeneration, and a substantial fraction scheduled for no harvest at all.
Policy scenario DNB was created by modifying DNF such that the harvest in the first period was constrained to be equal to the first period harvest from policy sce-nario VNF. As must be, the harvest levels were the same, and the NPV increased slightly to $0.200 million. This run was created to provide a NPV maximizing baseline against which we compared the remaining NPV maxi-mizing policies.
In policy scenario DPB, the model was constrained to provide the same harvest level as DNB, but exotics were permitted on private land. NPV increased 7-fold. All good site private land in haul zones 1–5 and some of the land in haul zone 6 was converted to plantation. The management intensity on all public land was reduced to no harvest or natural regeneration. The proportion of the area allocated to no harvest increases with increas-ing haul distance and decreasincreas-ing site productivity, as expected. A substantial proportion of the public land is never harvested under this policy scenario, potentially freeing it up for other uses.
In policy scenario DBB, planting of exotics is permit-ted on public land. Because of the lower land acquisition costs, much of the exotic plantation area shifts from pri-vate to public land. Exotic plantations occur only on good sites. The NPV is improved by about 6% over the policy scenario prohibiting exotics on public land.
In policy scenario DBF, the first period harvest level is no longer constrained to the level obtained in the status quo run (VNF). Periodic harvest levels almost triple to 30.6 million m3, and NPV increases to almost 14 times the baseline level. All good TPR private land in haul zones 1–9 is converted to exotic plantations. Most good TPR and some medium TPR sites on public land are converted to plantations. Most of the remaining land is managed on a leave-for-natural basis, although some of the fair TPR land in the far haul classes is assigned to the no harvest management intensity.
No harvest
Natural
Plant (native)
Plant (exotic)
Agriculture Management Zone
10 9 8 7 6 5 4 3 2 1 1 2 3 4 5 6 7 8 9 10 VNF
DNF
DNB
DPB
DBB
DBF
DBU
Haul zone (QVCMJD) Haul zone (private)
Figure 6: Allocation of land to management intensity by ownership, haul zone, and timber productivity rating. The leftmost bar in each triplet represents good sites, the middle medium sites, and the rightmost fair sites. The mill is assumed to be in the center of this representation.
net revenue associated with timber harvest declines with age.
Discussion
Our model results suggest that current tenure systems require reforestation efforts that are inconsistent with both profit maximization and the establishment of pro-tected forest areas. Specifically, we find significant costs associated with “use-it-or-lose-it” and sustained yield policies. There are also to be costs associated with poli-cies preventing exotic plantations on public land. These findings add support to previous work by Luckert and Haley (1993), who suggest that “Canadian forest policies encourage behaviour in private firms which may signifi-cantly reduce the value of public forest resources.”
Policies encouraging firms to manage every hectare of land for timber production appear to be inefficient. Giving firms options for reducing their logging footprint seems to increase the NPV for the firms and reduce area required for timber harvest. Such efficiency gains arise because net revenue is related to log-haul distance and site class. Our model also suggests that reducing the the area required for timber harvest by establishing exotic plantations, whether on private or public land, increases NPV. As an added bonus, public land no longer required to feed the mill could be put to other uses, such as pro-tected areas. Even though maximum sustained yield harvest levels could be maintained, preserving more land
would require provincial governments to forego increas-ing timber production beyond MSY levels.
A somewhat unexpected result is that no-harvest ar-eas are not simply allocated to poor land located far from the mill. Harvest costs that vary with stand yields and the abundance of low yielding old stands combine to preserve some over-mature stands on good and medium sites within various haul zones. Preserving over-mature stands for environmental and financial reasons differs from current forest policies, which often require the old-est stands be harvold-ested first. Instead, our modelling sug-gests that harvesting should focus on middle-aged stands that have not yet experienced high mortality. Then, by regenerating these areas with native LFN or exotic plan-tations, the oldest stands are preserved and the forestry sector made more competitive. Society benefits from protected areas and timber revenue.
A valid criticism of our approach is that it only con-siders net present value of timber harvest when choosing which areas to protect, and gives no economic value to the protected areas (even though our approach does lead to a smaller harvesting footprint). It is possible, how-ever, to incorporate more than just profit maximization within our optimal zoning technique. For example, ex-plicit values for protected areas could also be included in future work.
Finally, our model results suggest that policies allow-ing public land exotic plantations permit a trade-off be-tween biodiversity and protected areas, such that low biodiversity exotic plantations are exchanged for high biodiversity preservation. And yet, while public land ex-otic plantations are common in other jurisdictions, they are almost nonexistent in Canada. This absence could be related to public perception. Indeed, more research is required on the public perception of exotic plantations within Canada’s public forests.
Acknowledgements
This work was supported by the Social Sciences and Humanities Research Council of Canada, the Natural Sciences and Engineering Research Council of Canada, the Canadian Forest Service, the University of Alberta PhD Scholarship, Alberta-Pacific Forest Industries Inc., Weyerhaeuser Company Limited, the Walter H Johns Graduate Fellowship, the Sustainable Forest Manage-ment Network, and Genome Canada. The initial model was built using the Remsoft Spatial Planning System. The use of the software was made possible by the Ed-ucational Partners Program of Remsoft Inc. For their helpful comments, thanks are due to Peter Boxall, Ellen Goddard, Vic Lieffers, David Newman, and two anony-mous reviewers.
References
Adamowicz W.L., Armstrong G.W., and Messmer M.J. 2003. The economics of boreal forest management, chap. 6. NRC Research Press, Ottawa, ON, Canada, 181–211.
Alavalapati J.R.R and Luckert M.K. 1997. Modeling the Effects of Institutional Constraints on Short-run Tim-ber Supply on Public Land: A Case Study of Quota Holders in Alberta Nat. Res. Model. 10: 263–282.
Anderson J.A. and Luckert M.K. 2007. Can hybrid poplar save industrial forestry in Canada?: A finan-cial analysis in Alberta and policy considerations. For. Chron.83: 92–104.
Binkley C.S. 1997. Preserving nature through intensive plantation forestry: The case for forestland allocation
with illustrations from British Columbia. For. Chron.
73: 553–559.
Boreal Songbird Initiative. 2007. 1,500 scientists world-wide call for protection of Canada’s boreal forest. http://www.borealbirds.org/scienceletter.shtml.
Bradshaw H.D. and Strauss S.H. 2001. Breeding Strate-gies for the 21st Century: Domestication of Poplar, chap. 14.
Buongiorno J. and Gilless J.K. 2003. Decision meth-ods for forest resource management. Academic Press, Amsterdam.
Carmean W.H. 2007. Intensive plantation management for good-site forest lands in northwest Ontario. For. Chron.83: 41–53.
FAO. 2001. Global forest resources assessment 2000 : main report. Food and Agriculture Organization of the United Nations, Rome.
FAO. 2006. Global forest resources assessment 2005 : progress towards sustainable forest management. Food and Agriculture Organization of the United Na-tions, Rome.
Gladstone W.T. and Ledig F.T. 1990. Reducing pressure on natural forests through high-yield forestry. For. Ecol. Manage.35: 69–78.
Government of Alberta. 1985. Alberta Phase 3 forest inventory: Yield tables for unmanaged stands. ENR Report Dept. 60a. Department of Energy and Natural Resources, Edmonton, Canada.
Government of Alberta. 2003. Grazing Statis-tics for Public Land. Ministry of Sus-tainable Resource Development. pamphlet. http://www.srd.alberta.ca/FormsOnlineServices/ documents/GrazingStatisticsPublicLand-Dec-2003.pdf [accessed 10 August 2012].
Government of Alberta. 2012. Agricultural real es-tate transfers – County of Athabasca. Min-istry of Agriculture and Rural Development. web page. http://www1.agric.gov.ab.ca/$department/ deptdocs.nsf/all/sdd1506?opendocument [accessed 10 August 2012].
Greenpeace. 2010. Say no to genetic engineer-ing. http://www.greenpeace.org/international/en/ campaigns/agriculture/problem/genetic-engineering/ [accessed 17 June 2010].
forest management policies: an Alberta case study. Can. J. For. Res.30: 1591–1600.
Hunter M.L. and Calhoun A. 1996. A triad approach to land use allocation. InBiodiversity in managed land-scapes. (Edited by R.C. Szaro and D.W. Johnston). Oxford University Press, New York, New York, 477– 491.
Insley M., Fox G., and Rollins K. 2002. The economics of intensive forest management: a stand level analy-sis for the Romeo Mallette forest in Ontario. Tech. rep. Report prepared for Tembec Inc., the Ontario Ministry of Natural Resources, and ULERN.
Johnson K.N. and Scheurman H.L. 1977. Techniques for Prescribing Optimal Timber Harvest and Investment under Different Objectives – Discussion and Synthe-sis. No. 18 in Forest Science Monograph. Society of American Foresters, Bethesda, MD, USA.
Johnston M.H. and Williamson T.B. 2008. Adapting forest management to the impacts of climate change in Canada. BIOCAP Canada Foundation, Kingston, Ont.
Krcmar E., Vertinsky I., and van Kooten. G.C. 2003. Modeling alternative zoning strategies in forest man-agement. International Transactions in Operations Research10: 483–498.
Kuhnke D.H., White W.A., and Bohning R.A. 2002. The Alberta logging cost survey: Data for 1996-1998. Inf. Rep. NOR-X-375, Canadian Forestry Service. Natural Resources Canada, Edmonton, Canada.
Luckert M.K. and Haley D. 1993. Canadian forest tenures and the silvicultural investment behavior of rational firms. Can. J. For. Res.23: 1060–1064.
Luckert M.K. and Haley D. 1995. The allowable cut ef-fect as a policy instrument in Canadian forestry. Can. J. For. Res.25: 1821–1829.
Makhorin A. 2010a. GNU Linear Programming Kit: Reference Manual for GLPK Version 4.45 (Draft, De-cember 2010). Free Software Foundation, Inc., 51 Franklin St, Fifth Floor, Boston, MA 02110-1301, USA. http://www.gnu.org/software/glpk/. [accessed 29 January 2011]
Makhorin A. 2010b. Modeling Language GNU Math-Prog. Language Reference for GLPK Version 4.45 (Draft, December 2010). Free Software Foundation,
Inc., 51 Franklin St, Fifth Floor, Boston, MA 02110-1301, USA. http://www.gnu.org/software/glpk/. [ac-cessed 29 January 2011]
Messier C. 2007. Making Canadian forestry the best in the world. For. Chron.83: 8–11.
Montigny M.K. and MacLean D.A. 2006. Triad forest management: Scenario analysis of forest zoning effects on timber and non-timber values in New Brunswick, Canada. For. Chron.82: 496–511.
Natural Resources Canada. 2010. Key facts. http://canadaforests.nrcan.gc.ca/keyfacts. [accessed 29 November 2010]
Prairie Farm Rehabilitation Administration. 2001. Project Summaries 2000 and 2001. pp. 50-55. Agri-Food and Agriculture Canada.
Richardson J., Brourard J., Hogg T., Khasa D., Schroeder B., and van Oosten C. 2005. Poplar in Canada: information and research, 2005. Presenta-tion to the Poplar Council of Canada Annual General Meeting, August 23, 2005.
Rodrigues P.M.J. 1998. Economic analysis of ecologi-cally based mixedwood silviculture at the stand level. Master’s thesis, Department of Rural Economy, Uni-versity of Alberta, Edmonton, AB, Canada.
Schweitzer, D.L.R., R.W. Sassaman, and C.H. Schallau. 1972. Allowable cut effect: some physical and eco-nomic implications. needs. J. For. 70:415-418.
Sedjo R.A. 1999. The potential of high-yield plantation forestry for meeting timber needs. New Forests 17: 339–359.
Thomas B. and Kaiser C. 2003. Poplar farming in the boreal transition zone: Alberta-Pacific Forest Indus-tries Inc. http://www.poplar.ca/pdf/thomas.pdf [ac-cessed 29 November 2006].
Victor D.G. and Ausubel J.H. 2000. Restoring the forests. Foreign Affairs79: 127–144.
Vincent J.R. and Binkley C.S. 1993. Efficient multiple-use forestry may require land-multiple-use specialization. Land Econ.69: 370–376.
Westworth and Associates. 1994. Aspen woodlot feasi-bility study. Pub. No. I/529, Canada-Alberta Part-nership Agreement in Forestry.