No. 2007–72
RANKING DUTCH ECONOMISTS
By Jan C. van Ours, Frederic Vermeulen
September 2007
Ranking Dutch economists
∗Jan C. van Ours†and Frederic Vermeulen‡ September 13, 2007
Abstract
This paper ranks Dutch economists using information about publications and cita-tions. Rankings involve the aggregation of several performance dimensions. Instead of using a cardinal approach, where each dimension is weighted based on impact factors of journals for example, we use an ordinal approach which accounts for quality differ-ences between journals and also takes citations into account. We find that this ordinal approach is more robust. Based on the ordinal ranking of publications and citations we find that Peter Wakker is the most productive economist, followed by Michel Wedel. The third place in the ranking is ex aequo for Philip-Hans Franses and Florencio Lopez de Silanes. Adding-up the individual output we find that the economists of Erasmus University Rotterdam are the most productive, followed ex aequo by Tilburg University and Free University Amsterdam.
Keywords: Productivity of economists, ranking JEL Codes: A11, J24
∗
The authors thank CentER for making their data on publications and citations of individual economists available for further analysis. They also thank Jan Boone, Philip-Hans Franses, Coen Teulings and Tom Wansbeek for comments on a previous version of the paper.
†
Department of Economics, Tilburg University, CentER and CEPR; email: vanours@uvt.nl
‡
CentER, Department of Econometrics and OR, Tilburg University, Netspar and IZA; email: fred-eric.vermeulen@uvt.nl.
1
Introduction
Economists are fond of measuring productivity including the productivity of economists themselves. Measuring productivity, i.e. publishing performance of economists is not just fun, but is important for several reasons. Evaluation of performance of individuals and departments is an important tool to distribute money; think of grants to individual re-searchers or the allocation of government funds to departments. In the U.K., for example, there is a research assessment exercise that determines how much money goes to
depart-ments.1 At the Faculty of Economics and Business Administration of Tilburg University
research funds are allocated to the departments on the basis of research output. Also tenure and promotion decisions are heavily based on the number and quality of publications.
In the Netherlands there is a lively ranking tradition. The history of the ranking
of Dutch economists goes back to 1980 when the Dutch journal Economisch Statistische
Berichten (ESB) published the first ‘Top-40 of Economists’.2 This ranking was based on
publications in 70 somewhat arbitrarily chosen journals. In 1982 the Top-40 was published
in the Dutch weekly magazineIntermediair, later on it was again ESB that published the
ranking. In the course of the 1990s the number of journals was limited to about 30 and in 1994 the Top-40 shrunk to a Top-20. In 1997 the ranking procedure changed drastically while, again, a Top-40 was established. From then on, the ranking was based on the databases of (Social) Science(s) Citation Index journals that are set up by the Institute for Scientific Information (ISI) in Philadelphia. For each journal that is contained in one of its databases, ISI reports an impact factor each year in its Journal Citation Reports (JCR).
The (S)SCI-impact factor of journalj in yeartis defined as the number of citations found
in the (S)SCI-database in yeartto articles published inj in the years t−1,t−2, divided
by the total number of articles published in that journal in those two years. The ranking includes economists who published in relevant ISI journals and have an affiliation with one of the participating Dutch universities and/or institutions for at least 20%. Only the following ISI publication types are included: articles, letters, notes and reviews (but not book reviews). All other ISI publication types, such as (meeting) abstracts, corrections and
editorials are not included. The score Si of individual iis based on the following formula:
Si= X j wij 2 1 +nij (1) 1
Oswald (2007) mentions£8 billion that will be allocated over each department in more than 100 UK universities in the 2008 Research Assessment Exercise.
2
See http://center.uvt.nl/top40/intro.html for a more extended history of the Dutch ranking tradition. Also in other countries individual economists are ranked; see for example Dolado et al. (2003) for Spain and Bauwens (1998) for Belgium.
wherewij is defined as the weighted and normalized impact factor for journal j in which
researcheripublished andnij is the number of co-authors in this publication. The journal
impact is the impact weight for the last year of the five-year period under consideration for the Top-40. Reference date for the 2006 Top lists is set at January 1, 2006, which implies that the period 2000-2004 is considered. For this period, the impact factors for 2004, as found in the Web of Science, are used in the calculations.
Apart from the above discussed Top-40 ranking of Dutch economists, there is also the Top-30. This alternative ranking looks at those economists with an affiliation with a Dutch university or institution who obtain the highest number of citations. Also this ranking is
published on a yearly basis inESB (see Jolink, 2007).3
The latest scion in the Dutch ranking history is the new Top-20 of Dutch economists which takes into account both publications and citations (see Jolink, 2006). More
specif-ically, the Top-20 is based on the h-index which has been proposed by Jorge Hirsch, a
physics professor of the University of California at San Diego. A researcher has anh-index
of h if (s)he has published h papers with at least h citations each. Although the index
takes into account both an economist’s production and influence, which is an advantage with respect to indices that are based on only publications or only citations, it loses quite
some information (namely all the papers that are cited less thanhtimes). Moreover, young
promising economists are in a very disadvantageous position given the time span between the publication of an article and its citations by others in later published articles.
Basically, the above mentioned ranking methods try to aggregate information over several performance dimensions (like the number of top journal articles, the number of other journal articles or the number of citations) in a single number (score). Such methods usually have a cardinal nature: they attach a fixed weight to each performance dimension that is taken into account (the Top-40, for example, uses the normalized impact factors, corrected for the number of authors, as the weights). As we will illustrate below, such cardinal methods are subject to some deficiencies.
In this paper, we advocate an alternative ranking method of economists who are affili-ated with a Dutch university or institution. This method has been developed independently by Wittkowski (2003) and Cherchye and Vermeulen (2006). Cherchye and Vermeulen ap-plied the method to Tour de France racing cyclists. The alternative ordinal ranking method has clear advantages over cardinal methods. Most importantly, the methodology that we
3The Top-30 of 2006 takes into account all citations (except self-citations) to any publication of the
researcher received in the period 2000-2004 appearing in the (Web of Science version of the) Social Sci-ence Citation Index (SSCI), SciSci-ence Citation Index (SCI) and Arts and Humanities Index (A & HCI). No allowance is made for the order of authors, i.e. not only the first-author citations are counted (http://center.uvt.nl/top40/rulestop30-06.html).
apply merely uses information regarding theordering of the different performance
dimen-sions that are considered. Indeed, while it may often be difficult to specify how much
one performance dimension is more important than another performance dimension (like 1 top journal article is worth 3 other articles), it is usually fairly easy to determine simply
that the first performance dimension is more important than the second (like 1 top journal
article is more important than 1 other article).
We will apply the ordinal method to a dataset of 135 economists (also used to construct the 2006 Top-40) and compare the new ranking obtained with the original Top-40. We further construct an alternative ranking, based on the same ordinal method, of the Dutch economics faculties.
The rest of the paper is organized as follows. Section 2 discusses some widely used ranking methods (including the Top-40 ranking methodology) and proposes an alternative ranking method that has an ordinal nature. In Section 3 we discuss several rankings ob-tained by different methods. Rankings of both economists and institutes will be discussed. Section 4 concludes.
2
Ranking economists – mission impossible?
Economists can publish their work in many ways: in books, journal articles of different quality, working papers et cetera. However, when it comes to measurement of productivity it is mainly published journal articles that count. Van Damme (1996) proposes the following
“score”S of an individual researcheri:
Si= X i β(pi)ω(pi) α(pi) (2)
where for each publicationpi by that individual β(pi) denotes its length, ω(pi) denotes a
quality weight, andα(pi) denotes a correction for co-authorship. Each part is this formula
is controversial. How should one account for the length of an article? Is an article that
is twice as long also twice as important? How should one account for co-authorship?
How should we standardize the size of the pages (compare, for example, a page from the
American Economic Review with one from the Journal of Political Economy)? Simply
state α(pi) = n, where n is the number of co-authors? This seems reasonable but there
are alternative schemes. As shown above, in the Dutch Top-40α(pi) = 1+2n. This formula
recognizes that the “glory” for an individual publishing with one co-author is more than half of the glory of a single authored publication. The downside is that multiple authorship increases the overall value of an article. The quality weight of an article is perhaps the most controversial issue (Neary et al., 2003). Usually the quality weight of an article
is determined by the journal in which it appears.4 The quality of a journal is usually determined by its impact factor which is based on the number of times the journal is cited over a particular period of time. This too is not uncontroversial. Oswald (2007) shows that the best articles published in medium-quality journals are cited more often than the
worst articles that are published in an elite journal like theAmerican Economic Review.5
Sometimes the number of citations over a particular period is used to establish the publishing performance of individual economists. Citations are problematic because sur-veys and expository papers are more likely to be cited. And, there are differences between fields in citation practices. Furthermore, citations are subject to long and variable lags. Finally, the citing journal should be weighted: a citation is more valuable if it comes from a prestigious journal (Neary et al., 2003). Fase (2007) criticizes citation analysis and bib-liometric indicators to measure research performance and academic productivity because often monographs and books are neglected, the time window chosen are arbitrary, and for various reasons the impact factor of a journal may not be a sufficient robust indicator.
Most ranking methods (including the Dutch Top-40 and the rankings in Kalaitzidakis et al. (1999) and in the special issue on evaluating economics research in Europe; see Neary et al. (2003)) have a cardinal nature. More specifically, each publication has a fixed weight (that usually depends on the quality of the journal in which the article is published or the number of authors). More generally, a ranking methodology is based on the aggregation of several performance dimensions (like the number of articles published in top journals, the number of articles published in other journals or the number of citations). The aggregation procedure usually boils down to a weighted sum of the different performance indicators (like in (2)). Such procedures have an easy interpretation: a better performance in a given dimension implies a higher score and the higher the weight of that dimension, the higher the increase of the score. Moreover, they are easily implementable.
However, such a procedure is subject to some deficiencies. First of all, it is not robust to the specification of the weights. This seems obvious. However, even if a set of weights basically reflects the same order of importance of the different performance dimensions, quite different rankings may be obtained. The following example illustrates this. For
4Alternatively it could be based on the citations it attracts, but then lags become very important. 5Alternative, less frequently used measures are the “immediacy index” and the cited “half-life”. The
“immediacy index” relates the number of citations to articles in a particular year to the number of articles published in the same year. The cited half-life of a journal is the median age of its articles cited in a particular year. Half of the citations to the journal are to articles published within the cited half-life. For example in applied physics and applied chemistry journals the cited half-life is about 6 years. For economics journals the cited half-life is on average more than 10 years. In 2005 about one-third of all citations to
AERpapers was to papers that appeared up to 10 years before, while two-thirds related to papers that were published more than 10 years before.
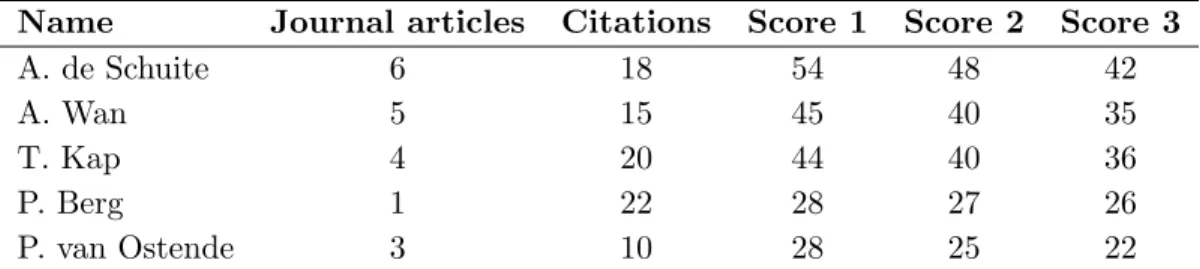
Name Journal articles Citations Score 1 Score 2 Score 3 A. de Schuite 6 18 54 48 42 A. Wan 5 15 45 40 35 T. Kap 4 20 44 40 36 P. Berg 1 22 28 27 26 P. van Ostende 3 10 28 25 22
Table 1: A fictitious example: cardinal rankings
simplicity, assume that we are only interested in two performance dimensions: the number of journal articles and the number of citations obtained. The first three columns of Table 1 show the performance of five fictitious economists. Most scientists will agree that a journal article is more valuable than one citation (under the current assumption that there are no quality differences in the journals). The last three columns of Table 1 show the economists’ scores that are calculated by means of three cardinal methods. All methods have in common that they attach a higher weight to a journal article than to a citation. All three methods attach a weight of 1 to a citation. They differ in the weights attached to a journal article: methods 1, 2 and 3 attach a weight of respectively 6, 5 and 4 to a journal article. It is clear from the table that the three methods obtain quite different rankings of the five economists, notwithstanding the fact that they all consider a journal article more important than a citation. In all three methods, A. de Schuite ranks 1. In two of the three methods, P. Berg and P. van Ostende rank respectively 4 and 5, while in one of the methods P. van Ostende ranks 4 together with P. Berg. A. Wan and T. Kap obtain a strictly different relative ranking which depends on the method used. This clearly shows that cardinal methods are not robust for different order-preserving weighting schemes.
A second deficiency of cardinal ranking methodologies is that they assume a constant trade-off between performance dimensions; e.g., one journal article has always an equal value as six citations according to method 1 in the above example. Finally, and quite importantly given the non-robustness for order-preserving weights, is that an appropriate weighting scheme is not readily available. In the Top-40 use is made of the impact factors of journals, but this is quite controversial. In addition to the objections discussed before, the Top-40 also allows for publications in non-economics journals to be counted. This implies
that one article in for example Science has the same value as 17 papers in American
Economic Review.6
6In fact, in the Top-40 for 2006 a 3.5 page 6 authorsScience paper about an analysis of mouse brain
tissue was accounted for. The author involved got a score for his share of the work – 0.6Science page – that was equivalent to 5 single-authoredAERpapers.
We advocate the use of an alternative ranking methodology that was proposed by Wit-tkowski (2003) and Cherchye and Vermeulen (2006). The methodology drops the linearity
(or constant trade-off) assumption and merely uses information regarding theordering of
the different performance dimensions. While it may often be difficult to specifyhow much
one performance dimension is more important than another performance dimension, it is
usually fairly easy to determine simplythatthe first performance dimension is more
impor-tant than the second. Although such an ordinal ranking may also be somewhat arbitrary,
it is clearly more robust than associating cardinal weights to the criteria; e.g., a given
ordinal ranking encompasses all possible cardinal rankings that are order preserving. The ranking methodology obtains robust performance rankings from such ordinal information by implementing an intuitive ‘compensation principle’ (see Cherchye and Vermeulen (2006) for a more detailed discussion).
The compensation principle states that one unit more of a higher ranked performance dimension may compensate for one unit less of a lower ranked performance dimension, but
notvice versa. Consequently, economist A can only dominate economistB ifA performs
at least as good asB in terms of the highest ranked performance dimension. Next, when
regarding the second performance dimension, even if A does not perform as good asB in
terms of this dimension, dominance of A can be obtained if a better performance in the
more important dimension 1 compensates this worse performance in dimension 2. Formally,
this means that the sum of A’s performance indicators 1 and 2 should not be below the
same sum for B. And so on. Let us go back to the fictitious data in Table 1 to illustrate.
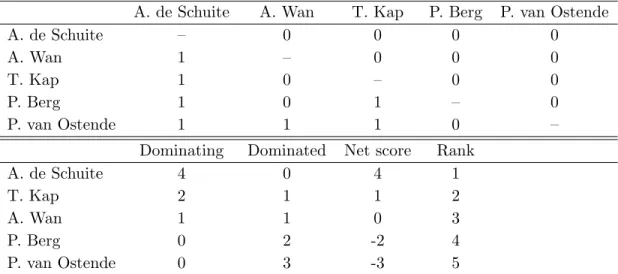
Suppose that we attach a greater value to a journal article than to a citation (which reflects the same ordering as the above applied cardinal methods). Clearly, A. de Schuite dominates both A. Wan and P. van Ostende: he performs at least as good with respect to both the number of journal articles and the number of citations. Moreover, he also dominates T. Kap and P. Berg: the two (respectively five) extra journal articles compensate for the two (respectively four) citations less. Further, A. Wan dominates P. van Ostende. He does not dominate T. Kap, however, since the extra journal article of A. Wan cannot compensate for the five extra citations of T. Kap when comparing each other’s performance indicators. The same reasoning applies when comparing the performance of A. Wan with that of P. Berg. It further turns out that T. Kap dominates both P. Berg and P. van Ostende. Finally, P. van Ostende is dominated by A. de Schuite, A. Wan and T. Kap, while she is not dominated by P. Berg. These pairwise dominance relationships are summarized in the upper panel of Table 2.
The application of the compensation principle results in pairwise dominance
relation-ships: economistA(B) dominates economistB(A) or neither of them dominates the other.
A. de Schuite A. Wan T. Kap P. Berg P. van Ostende A. de Schuite – 0 0 0 0 A. Wan 1 – 0 0 0 T. Kap 1 0 – 0 0 P. Berg 1 0 1 – 0 P. van Ostende 1 1 1 0 –
Dominating Dominated Net score Rank
A. de Schuite 4 0 4 1
T. Kap 2 1 1 2
A. Wan 1 1 0 3
P. Berg 0 2 -2 4
P. van Ostende 0 3 -3 5
Table 2: A fictitious example: dominance matrix and ordinal score
Note: Entry in the upper panel equal to 1 (0) implies that the economist in the associated row is (not) dominated by the economist in the associated column.
relationships by calculating the difference between (i) the number of other economists that a given economist is dominating and (ii) the number of other economists that dominate the evaluated economist. Higher values of this ‘net-dominance’ score then correspond to a higher ranking within the full sample. The results with respect to the above fictitious example are shown in the lower panel of Table 2. The procedure would rank A. de Schuite on the first place with a net-dominance score of 4. The rest of the top three consists of T. Kap and A. Wan with net-dominance scores of respectively 1 and 0. The last one in the
ranking is P. van Ostende who obtains a net-dominance score of -3.7
In the next section, we will apply the above ordinal ranking methodology to Dutch economists and compare the results with alternative (cardinal rankings) like the Top-40.
3
Ranking economists – proof of the pudding
3.1 Dutch economists
7Note that if 4th place P. Berg is excluded from the ranking procedure the Top 3 rank is somewhat
affected. A. de Schuite is still number 1. But, after P. Berg is removed T. Kap only dominates P. van Ostende. T. Kap and A. Wan are now ex aequo second.
The cardinal Top-40 is published every year in a December issue ofESB. The ranking is based on impact factors which are straightforward but do not distinguish between economic and non-economic journals. As shown before, as a consequence economic publications in non-economic journals with a high impact factor get a relatively high weight. Thus there is
no correction for the fact that economic publications in for exampleScience are cited less
often as the average article inScience (Van Damme, 2003). In fact, in the current set-up of
the Top-40 an economist who would have had one single-authored article inScience would
have been number 1 of the list, 5 years long. To illustrate the effect of the impact factors we use the Tinbergen Institute (TI) classification of journals, which distinguishes between
AA, A and B journals. The AAjournals are American Economic Review, Econometrica,
Journal of Political Economy, Quarterly Journal of Economics and Review of Economic
Studies (see Table 7 for the full list). The TI list is based on Kalaitzidakis et al. (2003)
transferring the cardinal ranking of economics journals to an ordinal ranking using three categories (Teulings, 2007). Of course the TI list is also arbitrary but at least the top
5 of AA journals seems to get wide support. Ellison (2002) analyzing the slow-down of
the economics publishing process investigates citations to these most prestigious economics journals. It seems that the importance of the top five economics journals has increased over time as he finds that in 1970 and 1980 the top field journals in economics typically received about 30 percent fewer citations than the top five journals while by the end of the 1990s they typically received 70 percent fewer citations. Axarloglou and Theoharakis
(2003) analyze a survey of AEA members asking for their opinion about the quality of
economics journals. They find that the respondents – irrespective of whether it concerns American or European members – rank these five journals as the highest. Lubrano et al.
(2003) give the 5 AA journals also the highest rank, adding to this as sixth journal the
Journal of Economic Theory. Normalizing their top 6 to 10, the second group of journals
has a score of 8. Combes and Linnemer (2003) have the 5AAjournals as their top journals
with weight 1, and the second group of journals having a weight of 0.67. Neary et al.
(2003) find that theAAjournals are also the top 5 originating from an unweighed ranking
of 5 weighting schemes used to rank European economics research.8 We rank all other
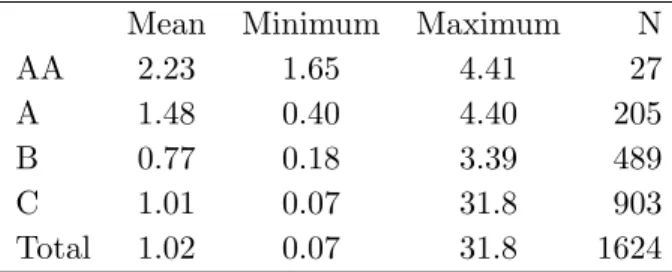
ISI journals as C journals. Using the results for the Top-40 of 2006 Table 3 shows the
relationship between the journal classification and the impact factorsSij.
As shown, the sample contains 1624 publications. There is some ordering in the average
score per publication but amazingly the maximum impact factor is highest for the C
8
The five weighting schemes have one common element:AERalways ranks first. Apart from that, some weighting schemes are elitist containing only a few journals which all have a substantial lower weight than
AER. Other schemes are egalitarian with quite a few journals that have the same weight asAERand other journals have quite a sizeable impact too; see Neary et al. (2003) for details.
Mean Minimum Maximum N AA 2.23 1.65 4.41 27 A 1.48 0.40 4.40 205 B 0.77 0.18 3.39 489 C 1.01 0.07 31.8 903 Total 1.02 0.07 31.8 1624
Table 3: Journal classification and impact scores
category. In the period 2000-2004 there were few publications in the top category; more
than half of the publications is in the C category.
To illustrate how this category influences the ranking of economists Table 4 presents
the Top-40 2006 as it was published and as it would have been if categoryC was ignored.
Clearly, omitting the C journals has a huge impact. Half of the upper 10 disappears.
Without the C category Nijkamp ranks 11 in stead of 2, Rietveld 17 in stead of 4, Van
Knippenberg 61 in stead of 7, while Nusse and Frewer disappear from the ranking
com-pletely because their ranking is based on C journals only. Apparently, it is the quantity
that counts not so much the status in the profession. On balance the Top-40 economists
working in Groningen, Wageningen and Maastricht rely heavily ofC journals. Once these
are taken out many of them are replaced by economists from the two Amsterdam univer-sities (4 from the Free University of Amsterdam, 6 from the University of Amsterdam).
With the exclusion of theC journals, the number of economists from Amsterdam,
Rotter-dam and Tilburg in the Top-40 increases from 28 to 37. The shift in terms of university affiliation is especially in the lower end of the Top-40, in the Top-10 there are not many changes.
The ESB Top-40 of 2006 is based on information about publications from 135 Dutch
economists over the period 2000 to 2004.9 The big faculties of Erasmus University
Rotter-dam (EUR), University of Groningen (RUG), Tilburg University (UvT), Free University of Amsterdam (VU), University of Amsterdam (UvA) and University of Maastricht (UM) each nominated 20 researchers, the smaller faculties of the Radboud University in Ni-jmegen (RUN), Utrecht (UU) and Wageningen (WUR) each nominated 5 researchers. In our following exercise, we will retain these 135 economists. Note that the participating universities provide the information about the publications separately from the informa-tion about citainforma-tions. An economist with many citainforma-tions but few publicainforma-tions may appear on the citations list but not on the publications list and vice versa. As a result, we do not
Cardinal ranking Cardinal ranking – no C journals
Name Uni Score Name Uni Score
1 Wedel M RUG 27.2 1 Wedel M RUG 18.1
2 Nijkamp P VU 24.0 2 Van Ours J UvT 14.0
3 Wakker P EUR 23.8 3 Bleichrodt H EUR 13.6
4 Rietveld P VU 22.9 4 Lopez de Silanes F UvA 13.5
5 Pieters R UvT 19.0 5 Wakker P EUR 11.4
6 Franses P EUR 18.4 6 Van Doorslaer E EUR 11.1
7 Van Knippenberg D EUR 18.3 7 Franses P EUR 9.9
8 Van Doorslaer E EUR 18.3 8 Pieters R UvT 9.4
9 Nusse H RUG 16.0 9 Van den Bergh J VU 9.2
10 Frewer L WUR 15.9 10 Van den Berg G VU 8.9
11 Bulte E UvT 15.4 11 Nijkamp P VU 8.8
12 Bleichrodt H EUR 14.9 12 Post T EUR 8.7
13 Van Ours J UvT 14.7 13 Van Soest A UvT 8.5
14 Lopez de Silanes F UvA 14.6 14 Huizinga H UvT 8.1
15 Van den Bergh J VU 13.7 15 Verhoef E VU 7.9
16 Tol R VU 13.4 16 Offerman T UvA 7.9
17 Steenkamp J UvT 13.2 17 Rietveld P VU 7.2
18 Dijksterhuis G RUG 13.2 18 Kleijnen J UvT 6.3
19 Huirne R WUR 12.8 19 Pradhan M VU 6.2
20 Janssen O RUG 12.2 20 Bovenberg L UvT 6.1
21 James J UvT 12.0 21 Bulte E UvT 5.9
22 Hommes C UvA 11.9 22 Pennings J WUR 5.8
23 Van den Berg G VU 11.0 23 Sonnemans J UvA 5.8
24 Post T EUR 10.9 24 Teulings C UvA 5.8
25 Stremersch S EUR 10.4 25 Stremersch S EUR 5.7
26 Groot W UM 10.2 26 Muller W UvT 5.6
27 De Ruyter K UM 10.1 27 Gerlagh R VU 5.6
28 Verhoef E VU 9.7 28 Boone J UvT 5.5
29 Ule A UvA 9.7 29 Lindeboom M VU 5.4
30 Kleijnen J UvT 9.6 30 Perotti E UvA 5.4
31 Smits J RUN 9.6 31 Oosterbeek H UvA 5.4
32 Anderson N UvA 9.6 32 Plug E UvA 5.3
33 Oude Lansink A WUR 9.4 33 Beetsma R UvA 5.2
34 Schumacher J UvT 9.3 34 Bartelsman E VU 5.2
35 Verhoef P RUG 9.2 35 Ongena S UvT 5.0
36 Papazoglou M UvT 8.9 36 Van Winden F UvA 4.8
37 Van Soest A UvT 8.7 37 Boot A UvA 4.7
38 Hagedoorn J UM 8.6 38 Lucas A VU 4.7
39 Verbeke W EUR 8.3 39 Janssen M EUR 4.7
have complete citation information for the whole list. For those economists of which we did not have any citation information, we imputed a number of citations via a linear regression with a set of dummies capturing the different universities, the numbers of publications in the different classes, age and age squared (a correction was imposed on those economists who have an imputed number of citations that exceeded the number of citations of the
lowest ranked economists in the citation list provided by her or his institute).10 A final
word of caution is needed. In both the publication and the citation cases institutes provide only the local top. This implies that it is well possible that an economist who ranks 21 in an institute (and who is thus not in the list) could have a better performance than an economist who ranks 15 in another institute (and who will be in the list) (see also the Concluding remarks).
In what follows, we will compare three rankings. The first is obtained by means of the ordinal ranking methodology applied to both publications and citations. The performance dimensions that we consider are the following (in decreasing order and making use of the
TI list): (1) the number of single-authoredAAjournals, (2) the number of co-authoredAA
journals, (3) the number of single-authored A journals, (4) the number of co-authored A
journals, (5) the number of single-authored B journals, (6) the number of co-authored B
journals, (7) the number of single-authoredC journals, (8) the number of co-authored C
journals, and (9) the number of citations. In our opinion, this is a quite intuitive ordering which could get wide support (at least if one accepts the TI list). Firstly, it not only takes into account the quality of the journals, but also whether an article is single-authored or
co-authored. It, for example, states that a co-authored article in the American Economic
Review is ranked above a single-authored article in the Journal of Public Economics. We
believe that many economists would indeed prefer the first option above the second. The ordering of the performance criteria that refer to journals seems uncontroversial if one accepts the TI list and the fact that a co-authored journal of a higher category is better than a single-authored article in a lower category. The final question is then where to rank citations. We think that most economists will agree that a journal article (independent of its quality and the number of authors) is always better than a citation. The second ordinal ranking that we consider only takes account of publications. Finally, we also focus on an
ordinal ranking that leaves outC journals and citations. The ordering of the performance
dimensions in the latter two ordinal rankings is the same as above.
Table 5 summarizes the three ordinal rankings. To save on space, we only focus on the 40 economists who obtain the highest score in terms of the net-dominance metric in the
10
The R2 of the regression equals 0.31; p-values of F-tests associated with the complete model, the affiliation dummies, the numbers of different publication types and the age variables are equal to respectively 0.00, 0.62, 0.00 and 0.06.
Baseline No citations No citations – no C journals
1 Wakker P EUR 101 1 Van Ours J UvT 117 1 Van Ours J UvT 126
2 Wedel M RUG 96 2 Wakker P EUR 102 2 Van den Berg G VU 120
3 Lopez de Silanes F UvA 92 3 Van den Berg G VU 99 3 Lopez de Silanes F UvA 114
– Franses P EUR 92 4 Wedel M RUG 98 4 Offerman T UvA 112
5 Van Ours J UvT 89 5 Franses P EUR 96 – Wakker P EUR 112
6 Van Doorslaer E EUR 85 6 Lopez de Silanes F UvA 92 6 Sonnemans J UvA 103
7 Van den Berg G VU 82 7 Peters H UM 89 7 Muller W UvT 100
8 Bovenberg L UvT 74 8 Post T EUR 85 8 Herings P UM 99
9 Bleichrodt H EUR 71 – Muller W UvT 85 9 Franses P EUR 98
10 Tijs S UvT 68 10 Van Doorslaer E EUR 82 – Bleichrodt H EUR 98
11 Offerman T UvA 58 11 Offerman T UvA 81 11 Wedel M RUG 97
12 Van Soest A UvT 55 – Herings P UM 81 12 Huizinga H UvT 96
– Sonnemans J UvA 55 13 Tijs S UvT 80 13 Van Soest A UvT 95
14 Peters H UM 53 14 Bleichrodt H EUR 77 – Bovenberg L UvT 95
15 Huizinga H UvT 52 15 Bovenberg L UvT 75 15 Oosterbeek H UvA 93
16 Nijkamp P VU 50 16 Van Soest A UvT 74 – Post T EUR 93
17 Kleijnen J UvT 47 17 Sonnemans J UvA 73 17 Pradhan M VU 90
– Bulte E UvT 47 18 Huizinga H UvT 66 – Peters H UM 90
19 Van den Bergh J VU 44 19 Bulte E UvT 62 – Van Doorslaer E EUR 90
– Rietveld P VU 44 20 Oosterbeek H UvA 60 20 Teulings C VU 88
21 Pfann G UM 42 – Lensink R RUG 60 21 Boone J UvT 86
22 Pieters R UvT 41 22 Pennings J WUR 59 22 Perotti E UvA 81
– Oosterbeek H UvA 41 23 Gerlagh R VU 57 – Janssen M EUR 81
– Lensink R RUG 41 24 Pieters R UvT 51 24 Gautier P VU 78
– Herings P UM 41 – Pradhan M VU 51 25 Tijs S UvT 77
26 Steenkamp J UvT 40 26 Van den Bergh J VU 50 – Van Winden F VU 77
27 Pennings J WUR 39 – Nijkamp P VU 50 27 Kooreman P RUG 76
28 Gunning J VU 37 28 Rietveld P VU 48 28 Plug E UvA 74
29 Groot W UM 36 29 Oude Lansink A WUR 45 29 Gerlagh R VU 72
30 Tol R VU 35 30 Janssen M EUR 44 30 Lucas A VU 70
31 Beetsma R UvA 34 30 Pfann G UM 44 31 Pfann G UM 68
32 Verhoef E VU 33 32 Kleijnen J UvT 43 32 Van Dijk D EUR 61
33 Perotti E UvA 32 – Heidergott B VU 43 33 Abbring J VU 59
– Koopman S VU 32 34 Van Winden F UvA 42 – Bulte E UvT 59
35 Post T EUR 31 - Groot W UM 42 – Beetsma R UvA 59
– Magnus J UvT 31 36 Boone J UvT 38 36 Kool C UU 57
37 Van Dijk D EUR 30 - Lucas A VU 38 37 Pennings J WUR 55
– Oude Lansink A WUR 30 – Kort P UvT 38 38 Lensink R RUG 53
39 Van Winden F UvA 28 39 Beetsma R UvA 37 39 Van den Bergh J VU 52
– Muller W UvT 28 – Gautier P VU 37 40 Bartelsman E VU 51
ordinal ranking method. According to this, by us most preferred ranking, Wakker (EUR) is the best performing economist in the Netherlands with a net-dominance score of 101. If we have a closer look at a matrix with pairwise dominance relationships (which is not given here for the sake of brevity and for politeness), it turns out that Wakker dominates 101 of the 135 economists in the dataset, while nobody dominates him. This implies that 33 economists either do not dominate Wakker or are not dominated by him. The runner-up is Wedel (RuG) with a score of 96 (who dominates 96 economists while being dominated by nobody). Lopez de Silanes (UvA) and Franses (EUR) share the third place, with a score of 92. They dominate 92 other economists and are also not dominated by anybody else. The fifth place in the ranking is taken by one of the authors of this paper: he obtains the score of 89 by dominating 89 economists while he is not dominated by others.
It is worthwhile stressing that the top five of this ranking differs substantially from the top five in the Top-40 ranking. Only Wakker (rank 3 in Top-40) and Wedel (rank 1 in Top-40) appear in the list of the five highest ranked economists in both rankings. In the Top-40, Lopez de Silanes ranks 14, Franses 6 and Van Ours 13. This feature has not so much to do with the citations that are not taken into account by the Top-40, which is illustrated by the ordinal ranking without citations. In the latter ranking, the top five consists of the economists Van Ours (1), Wakker (2), Van den Berg (3), Wedel (4) and Franses (5). Also this top five differs considerably from the five highest ranked economists in the Top-40. Overall, the ordinal Top-40 only contains 22 economists that are also in the cardinal Top-40. In de ordinal-without-citations Top-40 only 17 economists from the cardinal Top-40 remain. The cardinal Top-40 is very sensitive to the inclusion of category
C journals. If these are omitted from the ranking 21 economists drop out. The ordinal
Top-40 is less sensitive to the inclusion of citations and C journals. If citations (and C
journals) are not taken into account only 9 (10) economists drop out. Also in terms of university affiliation the changes are minor.
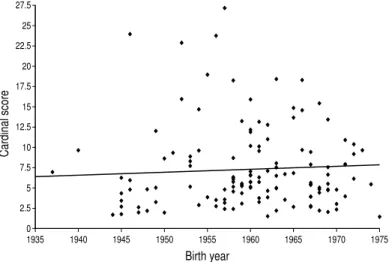
One of the criticisms of a ranking based on citations only is that it takes quite some time before articles are cited. If this is the case, older economists are more likely to get cited. The cardinal ranking that only considers publications is not subject to this age-bias. As shown in Figure 1 there is even a mildly positive relationship between birth year and cardinal score. Figure 2 shows that the ordinal ranking is not subject to an age-bias either. Apparently, due to the 5 year time window young economists can achieve a higher ranking early in their career.
As a final exercise with respect to the ranking of individual economists, we added three (fictitious) observations to the data set. The observations represent economists who
ob-tained respectively one single-authoredAApublication, one single-authored Apublication
Publications and citations Publications only Cardinal ranking
Rank University Score Rank University Score Rank University Score
1 EUR 5 1 EUR 5 1 EUR 50.1
2 UvT 4 2 UvT 4 2 UvT 45.3
– VU 4 – VU 4 3 WUR 37.5
4 UvA 3 4 UvA 3 4 VU 35.6
5 RUG 2 5 RUG 2 5 UvA 31.3
6 UM 0 6 UM 0 6 RUG 29.2
7 WUR -5 7 WUR -5 7 UM 24.2
8 UU -6 8 UU -6 8 RUN 17.1
9 RUN -7 9 RUN -7 9 UU 9.8
Table 6: Ranking of universities – 2000-2004
net-dominance score of -1. This economist dominates the other two fictitious economists while (s)he is dominated by three (real) economists. The fictitious author with one
single-authoredApublication ranks 97 with a net-dominance score of -24. Only the third fictitious
economist is dominated while the observation under evaluation is dominated by 25 other
economists (including the fictitious economist with a single-authoredAApublication).
Fi-nally, the fictitious economist with a single-authoredB publication ranks 128 by obtaining
a net-dominance score of -85 (without dominating any other economist in the ranking).
3.2 Dutch economics faculties
In addition to the Top-40 ranking of economists, ESB also provides a ranking of the
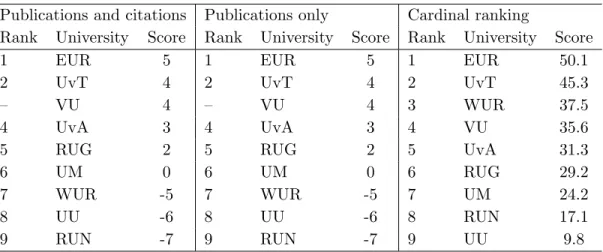
Dutch economics faculties. In this subsection, we establish an alternative ranking of these institutes by making use of the ordinal ranking methodology. To obtain this ranking, we first added all performances (per performance dimension) of all the economists in the list of 135 who belong to the same institute. We constructed two rankings: one based on publications and citations (with the same ordering of the different performance dimensions as above) and one based only on publications. The results can be found in Table 6.
As is clear from the table, the institutes’ ranking is not affected by whether or not citations are taken into account. The highest ranked institute is Erasmus University Rot-terdam which dominates 5 other institutes but is not dominated by another university. Tilburg University and the Free University share the second place in the ranking: they both dominate 4 universities and are not dominated by another university. Note that this
ranking differs from theESB ranking. In the latter ranking (based on a cardinal ranking
4
Concluding remarks
Rankings of economists either as individuals or as a group i.e. a department has become increasingly important. Rankings are used to allocate government funds or university funds to departments and sometimes within department to individual researchers. Rankings may also be used by young researchers to develop a publication strategy in terms of the order of journals to which one should submit or the quantity-quality trade-off of papers. We show that the use of cardinal ranking methods generates results that are not robust to small changes in the assumptions concerning the importance of particular journals. Instead, if an ordinal ranking is used the focus would be on aiming for top publications and not aiming for many sub-top publications or “outliers”. The ordinal ranking we propose takes various dimensions of productivity into account and is easy to apply. Based on the ordinal ranking of publications and citations we find that Peter Wakker is the most productive economist, followed by Michel Wedel. The third place in the ranking is ex aequo for Philip-Hans Franses and Florencio Lopez de Silanes. Adding-up the individual output we find that the Erasmus University Rotterdam is the most productive faculty, followed ex aequo by Tilburg University and Free University Amsterdam.
One important caveat of our study, and of all rankings based on the dataset that we consider, is that it gives only a rather partial ranking. As mentioned above, the big economics faculties in the Netherlands each nominate 20 researchers, while the smaller faculties each nominate 5 researchers. This implies that rankings based on the nominated set of economists may be biased. It may well be possible that an economist who ranks 21 in her institute (and would not be in the dataset), would rank much higher in another institute (and would be in the dataset). Our ‘policy recommendation’ would therefore be to construct a dataset with all economists who are affiliated with a Dutch faculty and who obtained at least one publication or citation in the period considered. This information seems available since institutes construct their selected sets of nominated economists by means of the criteria considered.
References
[1] Axarloglou, K. and V. Theoharakis (2003) Diversity in economics: an analysis of
journal quality perceptions, Journal of the European Economic Association, 1,
1402-1423.
[2] Bauwens, L. (1998) A new method to rank university research in economics in Belgium, CORE, mimeo.
[3] Cherchye, L. and F. Vermeulen (2006) Robust rankings of multidimensional
perfor-mances: an application to Tour de France racing cyclists,Journal of Sports Economics,
7, 359-373.
[4] Combes, P. and L. Linnemer (2003) Where are the economists who publish?
Publica-tion concentraPublica-tion and rankings in Europe based on cumulative publicaPublica-tions, Journal
of the European Economic Association, 1, 1250-1308.
[5] Dolado, J.J., A. Garc´ıa-Romero and G. Zamarro (2003) Publishing performance in
economics: Spanish rankings (1990-1999), Spanish Economic Review, 5, 85-100.
[6] Fase, M.M.G. (2007) Four example of a Trompe-l’oeil in economics, De Economist,
155, 221-238.
[7] Jolink, A. (2006) Economen Top 20 voor 2006 (Economists’ Top 20 for 2006), Economisch Statistische Berichten, 91, 548-551.
[8] Jolink, A. (2007) Bij de gratie van citatie (By the grace of citations), Economisch
Statistische Berichten, 92, 204-206.
[9] Kalaitzidakis, P., T. Mamuneas and T. Stengos (1999) European economics: an
anal-ysis based on publications in the core journals, European Economic Review, 43,
1150-1168.
[10] Kalaitzidakis, P., T. Mamuneas and T. Stengos (2003) Ranking of academic journals
and institutions in economics, Journal of the European Economic Association, 1,
1346-1366.
[11] Lubrano, M., A. Kirman, L Bauwens and C Protopopescu (2003) Ranking economics
departments in Europe: a statistical approach, Journal of the European Economic
Association, 1, 1367-1401.
[12] Neary, J.P., J.A. Mirrlees and J. Tirole (2003) Evaluating economics research in
[13] Niesten, E. (2006) EUR neemt 1eplaats over van UvT (Erasmus University Rotterdam
takes first place from University of Tilburg), Economisch Statistische Berichten, 91,
660-661.
[14] Oswald, A.J. (2007) An examination of the reliability of prestigious scholarly journals:
evidence and implications for decision-makers, Economica, 74, 21-31.
[15] Seglen, P.O. (1997) Why the impact factor of journals should not be used for evaluating
research, British Medical Journal, 314, 497.
[16] Starbuck, W.H. (2005) How much better are the most-prestigious journals? The
statistics of academic publication,Organization Science, 16, 2, 180-200.
[17] Teulings, C. (2007) Is de top echt de top? (Is the top really the top?), Economisch
Statistische Berichten, 92, 28.
[18] Van Damme, E. (1996) Measuring quality of academic journals and scientific
produc-tivity of researchers, mimeo, CentER, University of Tilburg.
[19] Van Damme, E. (2003) Lijstenbrij (Listporridge),Economisch Statistische Berichten,
88, 598-599.
[20] Wittkowski, K. (2003) Novel methods for multivariate ordinal data applied to genetic
haplotypes, genomic pathways, risk profiles, and pattern similarity,Computing Science
AA Journals
American Economic Review Quarterly J of Economics
Econometrica Review of Economic Studies
J of Political Economy A Journals
Accounting Review J of Health Economics
Econometric Theory J of Human Resources
Economic J J of International Economics
European Economic Review J of Labor Economics
Games and Economic Behavior J of Marketing Research
International Economic Review J of Monetary Economics
J of Accounting and Economics J of Public Economics
J of Business and Economic Statistics Management Science
J of Econometrics Mathematics of Operations Research
J of Economic Literature Operations Research
J of Economic Perspectives Rand J of Economics
J of Economic Theory Review of Economics and Statistics
J of Environ. Economics and Management Review of Financial Studies
J of Finance World Bank Economic Review
J of Financial Economics B Journals
Accounting and Business Research J of Economic Psychology
Accounting, Organizations and Society J of Economics and Management Strategy
American J of Agricultural Economics J of Evolutionary Economics
Applied Economics J of Financial and Quantitative Analysis
Cambridge J of Economics J of Financial Intermediation
Canadian J of Economics J of Forecasting
Contemporary Accounting Research J of Industrial Economics
Contemporary Economic Policy J of Institutional and Theoretical Economics
Ecological Economics J of International Money and Finance
Economic Development and Cultural Change J of Law and Economics
Economic Geography J of Law, Economics and Organization
Economic History Review J of Macroeconomics
Economic Inquiry J of Mathematical Economics
Economic Policy J of Money, Credit and Banking
Economic Record J of Population Economics
B Journals – continued –
Economica J of Risk and Uncertainty
Economics and Philosophy J of the Operations Research Society
Economics Letters J of Transport Economics and Policy
Economist J of Urban Economics
Energy Economics Kyklos
Environment and Planning A Land Economics
Environmental and Resource Economics Macroeconomic Dynamics
European J of Operational Research Marketing Science
Europe-Asia Studies Mathematical Finance
Explorations in Economic History National Tax J
Financial Management Operations Research Letters
Health Economics Organiz. Behavior and Human Decision Processes
Industrial and Labor Relations Review Oxford Bulletin of Economics and Statistics
Insurance: Mathematics and Economics Oxford Economic Papers
Interfaces Oxford Review of Economic Policy
International J of Forecasting Prob. in the Engineering and Informational Sciences
International J of Game Theory Public Choice
International J of Industrial Organization Queuing Systems
International J of Research in Marketing Regional Science and Urban Economics
International Monetary Fund Staff Papers Reliability Engineering and System Safety
International Review of Law and Economics Resource and Energy Economics
International Tax and Public Finance Review of Income and Wealth
J of Accounting Literature Scandinavian J of Economics
J of Accounting Research Scottish J of Political Economy
J of Applied Econometrics Small Business Economics
J of Applied Economics Social Choice and Welfare
J of Banking and Finance Southern Economic J
J of Business Theory and Decision
J of Comparative Economics Transportation Research B - Methodological
J of Development Economics Transportation Science
J of Economic Behavior and Organization Weltwirtschaftliches Archiv
J of Economic Dynamics and Control World Development
J of Economic History World Economy
Figure 1: Birth-year and cardinal ranking 2000-2004 1935 1940 1945 1950 1955 1960 1965 1970 1975 0 2.5 5 7.5 10 12.5 15 17.5 20 22.5 25 27.5 Birth year Ca rd in al s co re
Figure 2: Birth-year and ordinal ranking 2000-2004
1935 1940 1945 1950 1955 1960 1965 1970 1975 -120 -100 -80 -60 -40 -20 0 20 40 60 80 100 120 Birthyear O rd in al s co re