Theses and Dissertations
5-2012
Arkansas Teacher Licensure Cut Scores, Do They
Indicate Highly Qualified Teachers?
Karen K. Morton
University of Arkansas, Fayetteville
Follow this and additional works at:http://scholarworks.uark.edu/etd Part of theElementary Education and Teaching Commons
This Dissertation is brought to you for free and open access by ScholarWorks@UARK. It has been accepted for inclusion in Theses and Dissertations by an authorized administrator of ScholarWorks@UARK. For more information, please contactscholar@uark.edu.
Recommended Citation
Morton, Karen K., "Arkansas Teacher Licensure Cut Scores, Do They Indicate Highly Qualified Teachers?" (2012).Theses and Dissertations. 280.
ARKANSAS TEACHER LICENSURE CUT SCORES, DO THEY INDICATE HIGHLY QUALIFIED TEACHERS?
ARKANSAS TEACHER LICENSURE CUT SCORES, DO THEY INDICATE HIGHLY QUALIFIED TEACHERS?
A dissertation submitted in partial fulfillment of the requirements for the degree of
Doctor of Philosophy in Educational Statistics and Research Methods
By
Karen K. Morton University of Arkansas
Bachelor of Arts in Mathematics and Psychology, 1976 The College of William and Mary
Master of Science in Mathematics, 1979
May 2012 University of Arkansas
ABSTRACT
The highly qualified provision of the 2001 No Child Left Behind Act promoted licensure exams on a national level. The present study is an effort to explore the most commonly used Praxis licensure exams and their passing scores. Hypothesized was that passing scores are set at such a minimal level that they are ineffectual in identifying highly qualified teachers. More specifically, Arkansas’s low passing scores are examined by comparing the distribution of University of Arkansas Praxis scores to national trends. Based on low passing scores, the question was posed – At what point in teachers’ careers are expectations lessened? Academic data from Elementary Education graduates of the University of Arkansas College of Education and Health Professions were compared to colleagues with the conjecture that they would fall below. Finally, as the reauthorization of No Child Left Behind looms, the mandate for highly qualified teachers has become energized with the call for effective teachers. Student gains data of relatively new teachers from a local district were regressed on teacher scores on content
knowledge exams as well as years of experience to explore the relationships.
SEA passing scores were found to be low with all but a few exceptions using cut scores for licensure exams below the median of the national testing pool. Further, University of Arkansas testers, replicated national trends in scoring on Praxis exams eliminating any justification for Arkansas employing minimal standards. As conjectured, Elementary Education graduates of the U of A presented academic credentials below that of colleagues thus exacerbating the highly qualified conundrum. Lastly, the attempt to connect student achievement to teacher content knowledge through Praxis exam scores and years of experience proved unsuccessful. Higher standards, particularly for Elementary Education graduates, were discussed in the context of the Common Core State Standards and the push for effective teaching.
This dissertation is approved for recommendation to the Graduate Council.
Dissertation Director: _______________________________________ Dr. Sean Mulvenon Dissertation Committee: _______________________________________ Dr. Ronna Turner _______________________________________ Dr. Charles Stegman _______________________________________ Dr. Tim Martin
DISSERTATION DUPLICATION RELEASE
I hereby authorize the University of Arkansas Libraries to duplicate this dissertation when needed for research and/or scholarship.
Agreed ___________________________________________ Karen K. Morton
Refused ___________________________________________ Karen K. Morton
ACKNOWLEDGMENT
I thank the professors and dear friends in the Educational Statistics and Research Methods Department. Their vast theoretical knowledge, patience, and ability to apply have coalesced all of the loves of my life: education, psychology, and mathematics.
A special thanks goes to my superintendent for his continual encouragement and faith in me. Besides providing counsel, his help in accessing the data was pivotal to completion of this project.
I appreciate the inspiration provided me by my three precedents, my father, grandfather, and great-grandfather who attained this valued degree in their beloved content areas.
DEDICATION
To Mike Morton, dear friend, who supported me through the whole process. If not for his picking up the slack and encouraging me, this would not have been completed.
TABLE OF CONTENTS
I. INTRODUCTION 1
A. Purpose of the Study 1
B. Importance of Highly Qualified Teacher 2
C. Research Questions 7
1. National Level 7
2. Arkansas Praxis Examinations 8
3. College Level 9
4. Teacher Effectiveness 11
II. LITERATURE REVIEW 13
A. Definition of Highly Qualified Teacher Provision 13
B. HQT in Arkansas 14
C. Background on the Federal Government’s Role in Teacher Quality 15
D. Diversity in Qualifications 20
1. Background on HOUSSE 20
2. HQT in Arkansas and ARHOUSSE 22
3. State Reporting of Highly Qualified Teacher Statistics 25
E. Summary of Diversity 30
F. Teacher Shortages and Out-of-field Teaching 30 G. Summary of Teacher Shortages and Out-of-field Teaching 35
H. Retention of Teachers 36
I. Inequity ` 37
J. Alternative Certification 38
K. Summary of Alternative Certification 43
L. Licensure Examinations 44
1. State Requirements 45
2. Pedagogy Examinations 45
3. Examination Scoring 46
4. Difficulty Level of Licensure Examinations 46
5. Setting Cut Scores 49
6. Reporting of Passing Rates 52
7. Arkansas Cut Scores and Passing Rates 54
M. Summary of Licensure Examinations 55
N. College Indicators for Prospective Educators 56
O. Summary of College Level Indicators 60
P. Hypotheses 60 1. Hypothesis I 61 2. Hypothesis II 62 3. Hypothesis III 63 4. Hypothesis IV 64 Q. Summary of Hypotheses 65 III. METHOD 67
A. Introduction of Data Analysis 67
B. Data 67
i. Sources of Information 67
ii. Elementary Level 68
iii. Middle and Secondary Levels 69
iv. Table Structure of Cut Scores for States 71 2. State Passing Rates for Licensure Examinations 78 3. Praxis Data from the University of Arkansas 81
4. U of A Graduate and Enrollment Data 83
i. Data Structure and Manipulation 83 ii. Elementary Education Graduates 84
iii. Secondary-bound Graduates 85
iv. Graduates of Non-Education Majors 85
v. Enrollment Data 86
5. Teacher Variables for the Model Predicting Effective Teachers 87
C. Data Analysis 90
1. Analysis of National Cut Scores 90
2. State Passing Rates 91
3. Analysis of Arkansas Praxis Data and Comparison to Other States 91 4. Analysis of U of A Graduate/Enrollment Data 93 i. Elementary Education Analysis 93 ii. Secondary-bound Graduate Analysis 93 iii. Graduates in Non-Education Majors 93
iv. Group Comparisons 94
5. Summary of Graduate/Enrollment Data Analysis 94
6. Model of Effective Teacher 95
IV. RESULTS 101
A. Licensure Cut Scores for SEAs and Passing Rates 101
1. Elementary Educator Examinations 101
2. Middle School Educator Tests 107
3. Secondary Educator Examinations 111
4. State Passing Rates 118
B. University of Arkansas Praxis Data 124
C. University of Arkansas Graduate/Enrollment Data 134
D. Model of Effective Teachers 140
V. DISCUSSION 146
A. National Passing Scores and Passing Rates 147
1. Elementary Education Examinations 147
2. Middle School and Secondary Examinations 149
3. SEA Passing Rates 151
4. Possible Solutions to Non-differentiating Passing Scores 152 B. Arkansas Passing Scores and U of A Passing Rates 154
1. Elementary 154
2. Secondary 155
C. University of Arkansas Elementary Education, Secondary, and
Non-Education Graduates 158
D. Model for Effective Teachers 163
VI. Footnotes 169
VII. References 170
VIII. Appendix A 182
IX. Appendix B 185
I. INTRODUCTION Purpose of the Study
“Highly Qualified Teachers: it’s a lofty and good goal, but we won’t achieve it. If states set a low standard, it can be done. If states set a medium-to-high proficiency, it can’t” (Scavongelli, 2003, p. 1). This administrator opinion summed up the quandary created by the Highly Qualified Teacher (HQT) provision of the 2001 No Child Left Behind Act (NCLB). The level of content knowledge required of teachers by this federal initiative was intended to raise student
achievement to 100% proficiency and close subpopulation gaps.
The U.S. Department of Education stated the following as the reasoning behind the HQT provision:
A major objective of No Child Left Behind is to ensure that all students, regardless of race, ethnicity or income, have the best teachers possible. A well-prepared teacher is vitally important to a child's education. In fact, research demonstrates the clear correlation between student academic achievement and teacher quality. Studies also show that many classrooms and schools, particularly those with economically disadvantaged students, have
disproportionately more teachers who teach out-of-field or are not fully qualified in the subjects they teach (“Strengthen Teacher Quality,” 2007, p. 10).
The purpose of this study is to evaluate the impact of the highly qualified provision in Arkansas and to investigate its effect on student achievement in a local school district. To
facilitate the goals of the study, educator data on the national, state, college, and local levels were used to assess the expectations of teachers through the degree process, teacher training, and licensing. State licensing examination “cut scores” for those exams most frequently used and passing rates are presented for states with a focus on the ability of the cut scores to distinguish HQT adequately. Within Arkansas, University of Arkansas (U of A) Praxis I and II examination scores and their relationships to passing scores and national scoring quartiles were investigated. In addition, academic credentials and core course grade point averages for the U of A’s College
of Education and Health Professions (COEHP) teacher-graduates were utilized to assess the level of their credentials as compared to students of other colleges within the U of A. Finally, in an effort to measure teacher effectiveness, Praxis II content knowledge scores and total years of teaching experience were linked to student academic growth in a local school district.
Importance of Highly Qualified Teacher
Convincing evidence exists that teacher qualifications are related to student achievement. For every $500 spent by schools on teacher education, student achievement gains of nearly one quarter of a standard deviation were realized (Greenwald, Hedges, & Laine, 1996). The evidence from that study demonstrated that the extra money spent on teacher education provided greater student gains in achievement than resulted from three and a half years of teacher experience. More recently, Houston teachers with standard certification were found to be significantly more effective in raising student standardized test scores than teachers without standard certification in 22 out of 36 estimates (p < 0.10). In the study, the standard certification group was compared to six non-standard certification groups on six state-mandated tests (Darling-Hammond, Holtzman, Gatlin, & Heilig, 2005). Non-standard certification was defined as the absence of licensing exams, temporary or emergency certification, incomplete licensure code information, or alternative certification. The authors of that study revealed that teachers not meeting licensing requirements negatively impacted student scores.
Goldhaber and Brewer (2000), using an NELS:88 sample of 12th graders (n = 3,786), reported that a B.A. or M.A. degree in mathematics contributed to student achievement in that content area (d = 0.41 and 0.58, respectively). Utilizing 2,524 student science scores, an M.A. degree in science yielded a small effect (d = 0.23). In addition, authors revealed that students having
teachers with permanent or emergency certification in a relevant field outperformed students under the tutelage of non-certified personnel.
In his 2007 study of North Carolina teacher achievement on Praxis exams required for Elementary licensure, Goldhaber revealed that licensure tests, in some cases, are related to teacher effectiveness as manifested in student test scores. He reported small but significant coefficients in models predicting student math scores with teacher pass/fail performance on licensure content and curriculum exams (R2 = 0.70). Several student demographic variables were controlled for in the model. These results were primarily discovered in the highest quintile of teacher scores where high performance on the content exam alone provided a significant coefficient in his model (R2 = 0.70). In general, Goldhaber was tentative in interpreting the relationship between licensure scores and student achievement because the use of elevated cut scores eliminated many effective teachers from the teaching ranks.
Central to the HQT provisions, Wenglinsky (2000), in his study of teacher candidates and the colleges they graduated from, inferred that teachers should have more exposure to content knowledge and less exposure to professional knowledge. Using as the dependent variable Educational Testing Service (ETS) Praxis II average scores from a broad range of content and pedagogical assessments, his study provided evidence that institutions with larger percentages of Education majors and with larger percentages of money spent on Departments of Education produced less effective teachers, as reflected in scores, than those institutions with a more limited and focused scope. The author inferred that limiting coursework required by Departments of Education would, in effect, increase content area requirements.
A study by Schmidt et al. (2007) revealed that Middle school teachers in the U.S. complete fewer mathematics courses and are less knowledgeable in the subject than their counterparts in
South Korea, Taiwan, and Germany. Middle school teacher-candidates responsible for teaching mathematics in Taiwan and South Korea complete coursework comparable to that required of mathematics majors in the United States. Tested on five math scales developed by the MT21 project, future U.S. teachers generally scored below China (Taiwan), S. Korea, and Germany though they excelled in the statistics strand. The research revealed that undergraduate programs for U.S. Middle school mathematics teachers provided less instruction in algebra, functions, advanced math, and analysis than their international counterparts. Approximately half of the advanced math topics taught in an undergraduate math degree program were covered in U.S. Middle school degree programs as compared to 90% in Taiwanese programs. U.S. Middle school math teachers were found to be less prepared in content knowledge than colleagues graduating in Secondary programs while receiving the same levels of pedagogy training. Schmidt et al. also related the decline in U.S. student performance on international science exams to students’ lagging mathematics ability. The association was more pronounced for students who attempt the more complicated courses like chemistry and physics in Secondary schools. The authors
attributed success on international standardized tests not only to teacher content knowledge but also to the extensive pedagogy training received by the front-runners of the study.
Schmidt et al. (2010), in Breaking the Cycle: An International Comparison of U.S.
Mathematics Teacher Preparation, expanded The Teacher Education Study in Mathematics by surveying 3,300 future U.S. teachers and approximately 20,000 future teachers across 15 foreign countries. Revealed from survey results, educators trained at institutions that focused on
Secondary teaching scored higher in math content knowledge than those future educators trained in a Middle school environment. Among other suggestions, Schmidt promoted requiring more challenging math courses in all Elementary and lower Secondary Education degree programs
where the graduates would be teaching mathematics. In addition, educators with stronger math backgrounds should be recruited, emulating high achieving foreign countries. To attain future teachers comparable to Taiwanese teachers that scored at the mean on the 2003 TIMSS, U.S. recruits would necessarily have scored in the 85th percentile range.
Heck (2007) revealed in his research on the relationship between teacher quality and student achievement that collective teacher quality was positively related to achievement in both reading and mathematics, especially in schools where subgroups were more highly clustered. In this multilevel study, teacher quality was measured by the percentage of teachers at a school that were fully certified, had passed content knowledge exams, and had met state performance standards. Other encouraging results revealed were that increased collective teacher quality over time was related to higher student growth rates in math and the narrowing of subgroup
achievement gaps.
Another example of teacher performance affecting student achievement was found in
Connecticut. The Beginning Educator Support and Training assessment (BEST), for many years, was administered to second and third year teachers. BEST scores significantly predicted value-added gains on state mandated reading tests. Gains of 40% or more in reading were associated with a one point performance difference on the BEST’s four-point scale (Darling-Hammond, 2010). Alternately, she reported that Praxis scores on teacher licensure exams were not significantly related to student gains.
Years of teaching experience has been an important and well-researched factor of student achievement. Gordon, Kane and Staiger (2006) revealed that the largest gains in teacher impact on student math achievement were between years one and two, 3 percentile points, with 1 percentile point gained between years two and three. Clotfelter, Ladd, and Vigdor (2007)
regressed a number of teacher characteristics on student achievement. The effects of teacher experience on reading achievement ranged from 0.042 (p = 0.004) for one to two years of
experience, increasing to 0.083 (p = 0.004) for 28 or more years of experience. Math effects were stronger, ranging from 0.066 (p = 0.005) for 1-2 years of experience to 0.097 (p = 0.006) for 28 plus years of experience.
National, state, and college-level concerns about teacher qualifications have generated a plethora of research and rhetoric. Administrations, State Educational Agencies (SEA), and teacher organizations have espoused differing directions for NCLB to proceed. Presently, the Obama administration plans on reauthorizing the legislation and utilizing a former title, the Elementary Secondary Education Act. Proposed changes to the HQT provisions are designed to produce more effective educators (“Elementary,” 2011). In this the Common Core State
Standards era, teachers are under more pressure to have a deeper understanding of their content areas. Elementary educators, responsible for teaching several subjects, will be especially challenged as they teach rigorous content and application of knowledge through higher-order thinking skills (“About the Standards,” 2011).
The reauthorization of NCLB will not only uphold previous standards for qualified teachers but will institute measures of teacher effectiveness. Generally accomplished through principal evaluation in the past, the upcoming legislation will measure teacher effectiveness with student learning evidence (Darling-Hammond, 2010). Though many measures are available, student achievement gains in the classroom has been espoused as a valuable method for fulfilling the goals of NCLB while meeting the new goals of the reauthorization.
Research Questions
National level.Though the highly qualified designation has been defined in as many ways as there are states and jurisdictions, the common thread that runs through almost all of the plans is passing licensing examinations. Differences in state requirements are the number of teacher examinations mandated and the combinations of content knowledge and pedagogical exams. The decision on whether a beginning teacher meets their state’s definition of highly qualified is directly contingent upon licensure examination cut scores.
Of initial importance in the present study is the examination of the cut scores applied by the states for teacher licensure assessments, especially those required to teach in a content area. Education Secretary Margaret Spelling (2005, p. 38) asserted, “As a result of the low minimum passing scores and the high, test-taker pass rates, many question the value of the current pass rates for determining how well novice teachers are prepared to enter the classroom.”
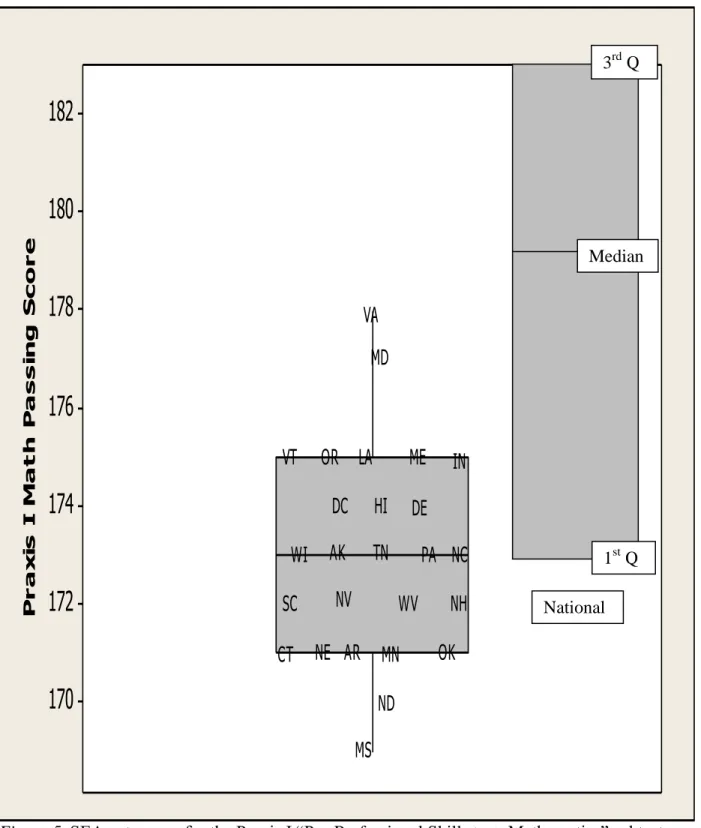
Nationally, low cut scores have been the rule rather than the exception. Very few states have set cut scores for their required teacher assessments at or above the national median for those exams. For example, only Virginia has used cut scores close to the national median on the Praxis I “Pre-Professional Skills Test” (“State Requirements,” 2010). Virginia, Alaska, and Colorado have all used cut scores for the Praxis II “Mathematics: Content Knowledge” above the national median of 144, but they are the only states or jurisdictions that have done so for that exam. However, all of the states, including the aforementioned, use at least one cut score below national medians. Some SEAs have set passing scores at such a minimal level that an aspirant could score higher by guessing. For example, in Arkansas, before the Fall of 2008, a prospective teacher passes the multiple choice Praxis II “Mathematics: Content Knowledge” exam with a scale score of 116 (“Praxis Series Testing,” 2010). This assessment, necessary for Secondary
licensure in mathematics, is scored between 100 and 200 with each of the 50 items having four response choices. Assuming equal weighting of the items then calculating this binomial
probability, an individual has a 95% chance of attaining a 116 or better by guessing. Arkansas raised the mathematics passing score to 125 in September, 2008 (“Praxis Series Testing,” 2010). With the change, the probability of guessing and passing is a much decreased 49% (see
Appendix B for calculation).
Percentages of prospective teachers passing these examinations reveal high passing rates in all states, with over half of the states showing passing rates 95% or higher (Spelling, 2006). In a perfect world, states and institutions of higher learning should be proud and take credit for such exemplary passing rates. However, if the cut scores do not distinguish between simply qualified teachers and those highly qualified to teach in the content area, the question arises: are they set too low? The first research question is: nationally, do cut scores for content area licensure examinations differentiate highly qualified teachers from those less qualified? The relationship between passing scores and passing rates is explored to investigate the hypothesis that cut scores are minimally set to distinguish HQT. As further support, the probability of passing exams by means of random guessing was addressed.
Arkansas Praxis examinations. Whereas all states differ on the kind and number of assessments utilized to qualify teachers, of particular interest in the present study is the state of Arkansas. Numerous ETS Praxis I and Praxis II assessments, testing both professional and content knowledge, are required of new teachers in the state. Passing the examinations fulfills one part of the highly qualified requirements in the state (“Arkansas Highly,” 2010). Arkansas also required a direct classroom assessment, the Praxis III, for beginning teachers (“Overview,”
2010). After May of 2011, the Praxis III was no longer required for beginning teachers that had attained a master’s degree or completed the Non-Traditional Licensure Program (Tolson, 2011). Where the sentiment behind the testing is honorable, the Arkansas cut scores may be set too low. Linked to Arkansas licensure cut scores are the high passing rates for prospective teachers in the state. The second research question is: do Arkansas Praxis I and Praxis II content area passing scores differentiate highly qualified from non-highly qualified teachers? The most commonly taken examinations are explored with a focus on the associated percentiles of Arkansas passing scores amongst U of A test-takers and how testers compared nationally. The probabilities of passing the English, math, and biology content knowledge exams through random guessing are reported as they specifically are related to Arkansas passing scores. To put Arkansas passing scores in perspective, the level at which U of A test-takers would pass in states with comparable examinations is investigated. In addition, the actual pass rates on most
commonly used examinations is explored.
College level.Preceding college admittance, degrees in Education, and licensure
examinations, the academic credentials of prospective teachers may be below that of other fields. National SAT data from 2006 indicated that high school students who planned on going into education have among the lowest scores in reading, mathematics, and writing (“Total Group,” 2006).
The American College Testing (ACT) composite scores for the graduating class of 2006 demonstrated that Education majors-to-be averaged below the national mean for the total cohort (“ACT High School,” 2006). Nationally, ACT test-takers averaged 21.1 on the composite score while students specifying Education as their career objective averaged 20.7. Differences of as little as 0.2 in ACT averages are referred to as significant (“2006 ACT National Score,” 2006).
Results of graduating high school seniors from 2010 revealed that Education aspirants averaged in the lower tier of scores, especially within the professions that would require college degrees (“2010 College-Bound,” 2010). Pertinent to the present study, the group of future educators scored lower than Business majors and far lower than students indicating that they will major in mathematics, English, or the sciences (“National Level,” 2011).
Disconcerting was U.S. Department of Education research on teaching careers in comparison to entrance exams (“To Teach or Not,” 2007). Researchers discovered that the college-entrance scores of future teachers in 1992-1993 were inversely related to the likelihood that they would be teaching ten years later. Of the lowest quarter of scores, 16% of teachers were still teaching in 2003 while 10% were not. Of the highest scorers, more left teaching than not. Encouraging research on the SAT revealed test-takers from 2002-2005 as having stronger grades and higher verbal and math scores on the SAT than prospective educators of the mid-1990s (Gitomer, 2007). The data included profiles of alternative candidates as well as those traditionally trained. This upward trend suggested a “higher caliber” of educator entering the classroom. But, the author’s findings also revealed Elementary school, Special Education, and Physical Education teachers as having scores markedly lower than their colleagues teaching an academic subject in Secondary school.
The third research question is: do Education majors enter the University of Arkansas with credentials below that of their peers in other fields and exit as graduates with levels of general content knowledge below that of their peers? Differences in group means on college admittance variables and core course GPAs are reported and discussion follows on whether future teachers are deficient in academic measures where high achievement would be desirable to fulfill HQT. Discussed is how these lagging credentials have fostered lowered expectations of teachers in
their scoring abilities on licensure tests and, ultimately, undermining the NCLB goal of a highly qualified teacher in every classroom.
Office of Institutional Research (OIR) data from the University of Arkansas, Fayetteville, were analyzed to explore the academic admittance credentials and college coursework for graduates from the U of A from 2008 to 2010. The focus was College of Education and Health Professions Elementary teacher-graduates who acquired their Bachelor of Science degrees during this timeframe. Variables explored included those used for college admittance: high school grade point average (HSGPA), the ACT composite score, and ACT subtest scores. Grades in college core courses, English, mathematics, history, and biology, were utilized to compare the level of general knowledge acquired by U of A graduates.
The summary statistics of Education majors are juxtaposed against prospective Secondary educators and, the majority of students in the data, the Education graduates. The Non-Education group included business, arts and sciences, engineering, architecture, agriculture, family and consumer science, and other majors outside of the COEHP.
Teacher effectiveness. Going beyond collegiate expectations for future teachers and assumptions that teachers are qualified, the fourth research question addresses teacher
effectiveness in the classroom. Can content area Praxis II examination scores and total years of teaching experience of educators be linked to student academic gains? Student data from a local school district in Arkansas were accessed to explore the relationship between student
achievement gains on the state mandated exam and two teacher variables. Praxis II content knowledge scores were collected for teachers from this local district with total teaching experience of one to five years. Should teacher content knowledge, as manifested in Praxis II scores, be related to student achievement, a key point in the NCLB HQT legislation would be
supported. Another of the many factors associated with effective teachers, the number of years of total teaching experience, was included in analysis, as well. Either or both may serve as
indicators of teacher success in the classroom providing administrators with another measurable attribute in their quest to hire effective teachers. While successfully establishing a relationship between the teacher variables and student achievement gains would prove beneficial, scrutinizing both ends of the spectrum of licensure exam scores, years of experience, and student gains would be enlightening as to the profile of effective teachers.
Today, teacher training can be gained in a multitude of ways, from the traditional route in Colleges of Education to alternative licensure. The multitude of licensure examinations with the various cut scores used by SEAs for certification has further complicated the highly qualified issue contributing to the question of who is “highly” qualified? States, individually, have refined their definitions during the past decade thus enabling their school districts to hire only those candidates that have the important characteristics that would classify them as “highly qualified,” in theory. But, are they truly highly qualified? And, looking toward the reauthorization of NCLB, can educator attributes translate into teacher effectiveness?
To understand the depth of the issues and support the argument that educator testing standards should be elevated, the background must be explored.
II. LITERATURE REVIEW
Definition of the Highly Qualified Teacher Provision
The HQT provision of the NCLB Act of 2001 required that teachers have a bachelor’s degree, full state certification, and demonstrable content knowledge in the subjects taught (“No Child Left Behind: A Toolkit,” 2006). To demonstrate competency, Middle and Secondary teachers had to prove to the SEAs that they knew the subject they taught. This could be
accomplished with a college major in the subject or credits comparable to a major, passage of a state-mandated assessment, completing a graduate degree in the subject, being awarded an advanced certification from the state, or gaining credit for experience and professional
development through the High Objective Uniform State Standard of Evaluation (HOUSSE) form (“New No Child,” 2004). New elementary teachers were required to take a “rigorous” content test of elementary curriculum (Spelling, 2006).
English (reading and language arts), mathematics, science, history, civics and government, geography, economics, the arts, and foreign language were denoted as core academic subjects and would be the focus of the HQT provision. Other content areas were not specifically addressed by the legislation. The requirements placed on core teachers also applied to Special Education and teachers of English Language Learners (ELL) that taught core subjects.
The original target was to have highly qualified teachers in 100% of the core subject classrooms by the end of the 2005-2006 school year. However, the U.S. Department of Education issued a one-year reprieve if states met certain qualifications. If states had defined HQT in a way consistent with the law, had reported their statistics on percentages of highly qualified teachers in their state to parents and the public, and had collected complete and accurate data on their highly qualified teachers, then states’ requests were considered (Keller,
2005). All states, the District of Columbia, and Puerto Rico had submitted revised plans attempting to meet the HQT goals by the fall of 2006 (“HQT Revised State Plans,” 2008). No dates were set by the U.S. Department of Education to revoke Title I funds based on state insufficiencies in HQT requirements.
HQT in Arkansas
As state highly qualified plans were being finalized in 2006 at the behest of the United States Department of Education (USDOE), Arkansas reported that 5% of classes were not taught by highly qualified teachers (“State Report [2006],” 2011). Further, it was revealed that the level was 15% in high poverty schools.
The USDOE reviewed Arkansas’s definition of HQT in May 2006, and the decision was that the Arkansas plan needed further revision (James, 2006). The major comments, both favorable and unfavorable, were: progress had been made in the past year in reviewing and identifying highly qualified teachers (even though Arkansas’s formal definitions were not in place until August, 2005); the State Report Card did not contain HQT data, but had slated its inclusion by March 2006; and, though strategies were in place, Arkansas lacked a comprehensive, written plan to ensure HQT equity for poor and minority students. The revised plan was submitted by September 2006, with more revisions submitted in November. The plan was accepted by the USDOE in December (Howell, 2006, December 16).
The revised plan to achieve 100% HQT in Arkansas core courses focused on reading, social studies, language arts, foreign language, music, and art classes. The plan designated that districts and schools where the percentage of highly qualified teachers was 10 percentage points below the Arkansas average of 84.8% would be targeted for attention (Howell, 2006, December 16).
Arkansas districts were directed to report to the Arkansas Department of Education (ADE) on their HQT percentages by January 2007. Central to 100% fulfillment, Arkansas districts were required to complete a plan delineating how non-highly qualified teachers would meet the state’s definition of highly qualified by the end of the 2006-2007 school year (“LEA Plan,” 2006). For the 2008-2009 school year, the Arkansas Department of Education reported that a mere 2.4% of teachers were not highly qualified (“Arkansas State [2009],” 2010). As an update, the 2010 Arkansas State Report Card revealed that 1.1% of classes were not taught by highly qualified teachers (“Arkansas State [2010],” 2011).
Background on the Federal Government’s Role in Teacher Quality
The federal government’s role in promoting high standards for teachers has been fairly recent. In 1950, half of U.S. teachers had not attained a college degree, and staffing decisions were made almost exclusively on the state level. A recapitulation by Waugh and Slivka (2005) revealed the following history of HQT.
With the success of the Soviet space program in 1957, Congress intervened in the teacher education process with the National Defense Education Act (NDEA). Besides providing loans and scholarships for those entering the fields of mathematics, science, and foreign language, Congress appropriated one billion dollars for teacher professional development.
In 1965, Congress passed the Higher Education Act (HEA). The HEA provided federal funding for poor and minority students to go to college and was later given credit for many of the female and minority teachers who entered teaching in the 1970s. Its reauthorization in 1980, renamed the Schools of Education Assistance Act (SEAA), enacted reform in teacher-education institutions.
Attention to teacher quality escalated when the renowned A Nation at Risk: The Imperative for Educational Reform of 1983 was published. The report criticized teacher-education programs for overemphasizing courses in pedagogy while disregarding content area knowledge. Through the 1998 Teacher Quality Enhancement Grants and Teacher Training Partnership Grants, the U.S. Department of Education (USDOE) directed states to ensure that their schools were staffed with qualified teachers. Under NCLB, the legislation housing the HQT provision, the directive for highly qualified teachers was formalized.
The No Child Left Behind Act of 2001 was preceded by the Elementary and Secondary Education Act (ESEA) of 1965. As part of President Johnson’s war on poverty, this legislation provided significant federal funding to schools for the first time (Nwazota, 2005). The bill provided subsidies to schools with large populations of students with low socioeconomic status (SES). Head Start, a pre-school program for impoverished students, was a key component of this legislation. Later the program was expanded to aid all grades in poor communities while leaving the management of public education as it was, with the SEAs. Professional development for teachers and programs to promote parent involvement were also funded with federal money. A cornerstone of the ESEA was the measurement of student achievement by the National Assessment of Educational Progress (NAEP). The Nation’s Report Card, as it is also called, has been administered to U.S. students since the 1969-1970 school year (“The History,” 2006). NAEP assesses the content areas of reading and mathematics biennially within states on random samples of 4th and 8th grade students. In every other testing cycle either science or writing is assessed (“Overview,” 2007). Nationally, a random sample of 12th
grade students are tested on the same content areas. A variety of subject areas such as U.S. history, economics, and foreign language are assessed mid-cycle (“Schedule for the State,” 2007). Administered by the
Education Commission of the States until 1983, The NAEP utilizes nine contractors to design assessments and administer the tests (“Current,” 2010). Under ESEA, states were not held accountable to the federal government for student achievement as they are within No Child Left Behind.
In 1994, the Clinton administration revised the ESEA as the Improving America’s Schools Act (IASA) (Nwazota, 2005). Programs for disadvantaged students and student testing were expanded. NAEP testing for 4th, 8th, and 12th grade core areas indicated that low percentages of students met proficiency minimums and that there were performance gaps in achievement between subpopulations of students.
Title II legislation within the Higher Education Act was reauthorized in 1998 with the provision that all states require licensure exams for beginning teachers (Stotsky, 2007). Licensure exams were utilized before this time, but not broadly. Formalizing the requirement was intended to serve two purposes: the public would be protected from incompetent teachers and teacher training programs would be held accountable for the academic competence of their graduates.
At the turn of the century, the Bush administration conducted an overhaul of the educational system, which resulted in the No Child Left Behind Act of 2001 (Nwazota, 2005). Initially, NCLB received praise from legislators and constituents based on its far-reaching goals for all
students. Since the signing on January 8, 2002, many of these same supporters became critics of the legislation calling it an unfunded mandate and condemning it for imposing unrealistic expectations on student achievement.
States responded to NCLB and its HQT provision in a number of ways. Many states
years, some SEAs even considered renouncing Title I: Aid to Disadvantaged Children funds, one of the most renowned of the ESEA programs, because of the HQT compliance contingency. In more recent years, five states unsuccessfully introduced legislation to completely opt out of NCLB recognizing that federal funds might be affected (“States Opt,” 2008).
Since the institution of NCLB in 2002, student achievement has been on the rise. A 2010 study by Kober, Chudowsky, and Chudowsky of student test data from state assessments, as well as the NAEP, revealed that a majority of states (with sufficient data) made gains in both 4th and 8th grade math and reading scores. Authors discovered that trends on state-mandated exams usually moved in the same direction as performance on the NAEP though state test gains tended to be larger. Arkansas achieved gains in math and reading proficiency on state tests but NAEP results trended upward only in math.
NAEP results have improved over the last decade. Percents at or above Basic in math and reading increased in 4th grade math and reading until 2007 where they have remained the same at 82% and 67%, respectively (“The Nation’s Report Card,” 2010). Additionally, gains were achieved in NAEP 8th grade math over the last decade and more modestly in reading since 2005. The 12th grade NAEP scores in math have improved since 2005 in the combined and
racial/ethnic subgroups while reading scores have increased only modestly. The NAEP
achievement gap between African American and White students narrowed during the timeframe 2002-2007 in 4th and 8th grade math and in 4th grade reading (“Achievement Gaps,” 2010). In 2007, the Arkansas Department of Education and a large majority of states had their accountability and highly qualified plans in place, or at least formulated and waiting for approval. These successes coincided with the fifth anniversary of the signing of the NCLB Act and the initial push by President Bush to have the law reauthorized by 2009. President Bush
stated that reauthorization was critical (“Fact Sheet,” 2007). He asserted that NCLB is “changing a culture and that it is working.” As evidence, he referred to outstanding reading progress in nine year olds during the NCLB years. More progress had been made in NAEP reading scores during that timeframe than in the preceding 28 years combined, he stated. Additionally, the percentage of classes taught by highly qualified teachers had risen to greater than 90% nationally (“No Child Left Behind’s 5th,” 2007).
Contrary viewpoints to NCLB were issued by the Commission on No Child Left Behind (Lips, 2007). Organized by the Aspen Institute and chaired by two former governors, seventy recommendations to improve NCLB were made. On the HQT provision, the commission recognized that teacher qualifications do not necessarily translate into effectiveness. In their report, they cited studies in Los Angeles and New York City where teacher certification did not affect student achievement. Their report recommended including Effective in the title, the new provision being named Highly Qualified Effective Teachers. With the reauthorization of NCLB looming, the Aspen Commission plans on holding hearings to release an addendum to their 2006 report (Klein, 2009). One of their focus areas will be aid to low-performing schools.
Reauthorization stalled at the end of President Bush’s second term in office. As a stopgap, Secretary Spelling introduced new regulations to strengthen NCLB. First, high school graduation rates would be calculated in a standard way across states. Second, school transfer and free
tutoring would be publicized to a greater degree in schools on the improvement list, and lastly, NAEP scores for each SEA would be reported with other student achievement data (“U.S. Secretary,” 2008).
Throughout 2010, seven hearings were held in the House Committee on Education and Labor on the future of the ESEA (“Elementary and Secondary,” 2010). The Obama blueprint outlined
to the public provided significant changes to the NCLB legislation and focused more on
responsibility, reform, and results. The President was seeking to build bipartisan support with the goal, since unfulfilled, of reauthorization in 2011 (“Readout,” 2011).
Arne Duncan, U.S. Secretary of Education, has espoused eliminating the perverse incentives in the law that, instead of raising student achievement, have actually caused states to lower their standards. The emphasis will change in the Obama legislation from the pass-fail method utilized under NCLB to student academic growth over time. The goal for all students will be college and career readiness by the year 2020 (Anderson, March 14, 2010).
Teacher quality under the Obama blueprint will give states flexibility to define “effective teachers” and support career ladders that improve student outcomes (“A Blueprint,” 2011). Professional development, recruitment and other supports will be instituted to elevate the level of teaching. Education preparation programs will be held accountable through data systems
designed to follow teacher progress in student achievement over time. Bold in its approach, states will be held accountable for placing effective teachers in all schools equitably.
Diversity in Qualifications
Background on HOUSSE. States were charged with creating their definitions for “highly qualified teacher.” Following the definition phase, they were tasked with creating an evaluation tool that struck a balance between rewarding experienced teachers for years of subject-specific knowledge and service while fostering rigorous, but fair, content standards for all teachers (Azordegan, 2004). A key emphasis in the HQT wording made states responsible for deciding
what constituted proper content knowledge of a subject. The consensus was that it should at least be equivalent to attaining a college minor in the subject (Walsh & Snyder, 2004).
Uniform State Standard of Evaluation. This tool, designed by individual State Educational Agencies (SEA), was used to gauge whether Elementary, Middle, and Secondary teachers were highly qualified. However, options other than an examination or college degree in the content area could be substituted in many of the state HOUSSE requirements.
An early analysis of versions of HOUSSE was conducted by the Education Commission of the States (ECS). They reported that the versions being developed by the states could be placed in the general categories: 1) a point system, 2) professional development, 3) performance evaluation, 4) classroom experience, 5) portfolio, and 6) student achievement data (Azordegan, 2004). Some of the more frequently used options to fulfill the HOUSSE requirements included professional development, college course work, student achievement data, awards, or
publications. Azordegan concluded that the point system was the most widely used method for assigning HQT status.
On the national level, the HOUSSE requirements varied widely. Whereas North Carolina required six months of experience to meet requirements for Elementary teachers, New Mexico required two years of experience (“50-State,” 2006). In California, half the necessary points could be accumulated from years of experience, while in Alabama only 30% of points could be gained through experience (Carey et al., 2003). Two states, Wisconsin and Idaho, did not originally institute HOUSSE because they asserted that their teacher licensure policies already ensured that teachers in their states were highly qualified. However, through pressure from the U.S. Department of Education (USDOE) to comply, both developed HOUSSE forms for state use.
as veteran teachers had been given adequate time to move to the HQT rolls (Keller, 2006). In May 2006, the USDOE required SEAs to submit, in their revised HQT plans, how they would utilize the HOUSSE procedures for teachers already hired and how they would limit use of HOUSSE for teachers hired after the end of the 2005-2006 school year. The USDOE determined that experienced teachers no longer needed HOUSSE to become highly qualified after 2006 and found that state HOUSSE procedures were less rigorous than other ways of assessing content knowledge (Spelling, 2006, September 5).
HQT in Arkansas and ARHOUSSE.To attain highly qualified status in Arkansas, first, a teacher must have one of the four Arkansas teaching licenses: 1) initial, 2) standard,
3) Non-Traditional Licensure Program (NTLP) provisional, or 4) reciprocity provisional. The actual inventory that enumerated HQT options was the Highly Qualified Teacher Designation Form. It held three options for attaining the HQT status: 1) passing Praxis II content and professional knowledge assessments, 2) being a veteran Middle or Secondary teacher with a college major or its equivalent in the content area, or 3) being a veteran teacher with 100 or more points on Arkansas’s version of the HOUSSE form, the ARHOUSSE (Williams, 2006). A graduate degree or National Board Certification in a teacher’s content area also served to establish experienced teachers as highly qualified.
All new Arkansas teachers are deemed highly qualified by passing the Educational Testing Service (ETS) Praxis II examinations for content area and professional
knowledge. This met the federal mandate that all new hires, beginning with the 2002- 2003 school year, are required to be highly qualified if the teachers participate in Title I school-wide programs (“No Child Left Behind: A Toolkit,” 2006).
Addressing content knowledge is essential for Secondary schools where teachers most often instruct in a single content area. In contrast, having Elementary teachers meet HQT was not as straightforward because they teach subject matter across the entire grade-level curriculum. To become highly qualified, new Elementary teachers were required to pass a rigorous state test on multiple core subject areas and teaching skills, as mandated by NCLB (Spelling, 2006).
In Arkansas, HQT can be gained for three levels, grades K – 6, grades 4 – 8, and grades 7 – 12. For all three levels, Arkansas requires the Praxis I “Pre-Professional Skills Test,” an assessment of basic skills in reading, writing, and mathematics. In many states, Arkansas included, students are required to pass this exam to fulfill conditions of their degree program (“State Requirements,” 2010). In addition, all teaching levels require the
level-appropriate Praxis II Principles of Learning and Teaching (PLT) examination. This examination uses a case study design with constructed response and multiple choice items to measure general pedagogical knowledge (“Praxis II Overview,” 2006).
Before 2007, Arkansas required passing the Praxis II “Education of Young Children” examination for Elementary certification. This examination assesses what teachers know about child development, the learning environment, relationships with families, and other teaching-related areas. Arkansas moved away from only testing pedagogy on the Elementary level with the introduction of a new content examination in 2007. The Praxis II “Early Childhood: Content Knowledge” exam is presently used to measure teacher knowledge of language/literacy, mathematics, social studies, science, health and physical education, and the creative and performing arts. A synopsis of the examination specifically stated that pedagogy was not emphasized. The exam measures the major concepts, how they were related, applications of knowledge, and the structure of the content areas (“Early Childhood,” 2007). According to
ETS documentation in 2010, eleven other states employ this examination (“The Praxis Series Passing,” 2010).
Besides the basic skills and pedagogy examination required, all Arkansas Secondary teachers must show proficiency in a content area (e.g. mathematics, language arts, science) for HQT status. The Praxis II content areas examinations, with associated cut scores, are utilized to measure teacher knowledge. An examination measuring content area for middle grades 4-8 has been required since 2001 (“Praxis Series Testing,” 2008). Arkansas also required that all new teachers pass the Praxis III, a performance assessment, as an additional requirement for standard licensure until May 2011 (Tolson, 2011).
The College of Education and Health Professions (COEHP) at the University of Arkansas requires that future educators pass the Praxis I and Praxis II content area exams prior to their student teaching internships (“Test Requirements,” 2007). It is recommended that students attempt the Praxis I after completing College Algebra and both semesters of freshman English. The Praxis II pedagogy exams are to be completed during the internship phase of the M.A.T. program.
Most experienced Arkansas teachers met HQT because of attainment of a college degree in a subject specific to a content area. The ARHOUSSE form was used in the early NCLB years as evidence of content knowledge if there was no college degree or content area assessment to demonstrate adequate training. Of the 100 points necessary, 10 points per year of subject area teaching could be credited, up to a maximum of 50 points (“Arkansas Department of Education,” 2006). Content-based professional development could accumulate to a maximum of 40 points. Other ways to acquire credits were through university coursework (i.e. three points per credit hour), acting as lead teacher or in an administrative capacity in the content area (i.e. 10 points per
year, 30 points maximum), or serving on a curriculum committee either locally, statewide, or nationally. Additionally, service on a textbook adoption committee, publishing in a content area, presenting at or attending content area conferences, and service as a mentor could apply. Several other specialized reading and mathematics curricular training courses were accepted as well. An example of a way that an experienced English teacher, without an English degree, could have attained the 100 points was with five years of teaching experience in English, two years of mentoring, being on the textbook adoption committee, and having completed one college course in English.
Of those who did not meet HQT in Arkansas, 74% of non-qualifiers were Secondary teachers who were teaching out-of-field (those not teaching in their certification field) and had no professional history to obtain the 100 points (James, 2006). Twenty percent were general education teachers in Elementary schools, with a college degree, who did not pass a content area test or could not meet the required 100 points on the ARHOUSSE.
State reporting of highly qualified teacher statistics.September 2003 was the original date that states were to file baseline data on highly qualified teachers in their states. However, seven states or jurisdictions failed to comply. Some cited an inability to collect even rudimentary information, while others appeared to be acting in good faith. Suspicions as to the validity of the data arose when the Education Trust analyzed the reported data. Wisconsin’s Department of Public Instruction reported the largest percentage of highly qualified teachers, 98.6% in aggregate and 96.9% in the high-poverty schools (Carey et al., 2003). The diversity in percentages of highly qualified teachers among the states was underscored by Wisconsin’s disclosure that they had no content area testing for new teachers until 2004, well after this survey of states. Before 2004, Wisconsin approved all current Middle and Secondary teachers as
meeting HOUSSE requirements. Since then, they have utilized ETS Praxis II content area exams for Secondary certification (“Testing Prospective,” 2004).
Of the 45 states or jurisdictions responding to the federal request for state data, twenty reported that at least 90% of their classrooms were taught by highly qualified teachers (Carey et al., 2003). Seventeen claimed that 70-89% of their teachers, in content areas, were highly qualified. Five, including California and Maryland, reported proportions between 40 and 69%. The remainder had very low proportions of highly qualified teachers. These numbers should be interpreted cautiously, as many states included a disclaimer or footnote about the limitations of their data. Examples of footnotes ranged from percents being based solely on Secondary classrooms to only core subjects being reported. Mostly, states presented favorable percentages of highly qualified teachers.
Since 2003, less optimistic numbers have been presented by several states. Arkansas reported in 2003 that 97% of classes were taught by highly qualified teachers (Carey et al., 2003). After revisions to their HQT plan in 2006, the ArkansasState Report Card revealed that a lower 92.6% of classes were taught by highly qualified teachers in the state (“School Report Cards,” 2006). The Arkansas State Report Card 2009 revealed a higher 97.6% of classes taught by highly qualified teachers (“Arkansas State,” 2010).
HQT data for Elementary and Secondary schools by high- and low-poverty are attainable from the U.S. Department of Education website (“HQT Data,” 2008). The levels of HQT in Elementary schools ranged from a low of 70.9% in Idaho to 100% in North Dakota. On the Secondary level, Hawaii disclosed that 60.2% of its core academic classes were taught by highly qualified teachers. Again, North Dakota reported that all Secondary core academic courses were taught by highly qualified teachers. For states, the average percentage of Elementary core
academic courses taught by highly qualified teachers was 95.9% while the corresponding statistic on the Secondary level was a lower 93% (Figure 1). Percents increased by the 2008-2009 school year to 97% and 95%, respectively (“A Summary,” 2010).
Elementary Secondary All Schools High-Poverty Low-Poverty Total Elem. High-Poverty Low-Poverty Total Second. Alabama 94.5 95.2 98.1 97.1 79.3 93.2 90.1 Alaska 80.9 70.7 68.1 74.6 80.0 86.2 85.4 Arizona 94.7 92.2 97.7 94.7 94.4 96.2 94.7 Arkansas 97.6 95.8 98.9 97.8 95.9 98.6 97.3 California 90.9 94.9 97.4 95.7 86.3 93.4 89.4 Colorado 98.1 98.3 98.3 98.3 96.2 97.8 97.2 Connecticut 98.0 96.9 99.1 98.5 95.2 98.8 97.9 Delaware 90.7 92.4 97.0 96.3 78.1 91.3 89.6 D.C. 56.6 76.1 68.8 73.8 55.7 57.1 52.5 Florida 89.8 90.7 88.5 91.5 91.2 89.6 87.9 Georgia 96.2 94.3 98.1 97.1 91.5 98.0 95.9 Hawaii 64.9 82.7 89.6 86.2 58.1 63.4 60.2 Idaho 71.3 72.6 72.6 70.9 74.1 68.2 71.0 Illinois 96.8 83.3 99.8 96.1 96.5 99.9 98.9 Indiana 92.6 90.1 89.2 90.9 94.0 95.9 95.2 Iowa 99.2 99.6 99.6 99.5 98.7 99.3 99.0 Kansas 88.3 94.6 97.7 97.4 72.3 91.2 86.3 Kentucky 98.0 98.9 99.4 99.1 96.7 97.6 97.2 Louisiana 83.7 85.3 95.6 90.3 66.7 88.3 77.8 Maine 94.9 95.3 97.1 96.0 93.3 95.1 94.4 Maryland 82.2 66.2 94.8 84.3 63.4 89.1 81.8 Massachusetts 94.9 91.5 98.0 95.7 84.7 95.8 93.1 Michigan 99.6 99.6 99.8 99.8 98.9 99.8 99.6 Minnesota 97.7 97.4 98.2 98.2 94.1 98.4 97.5 Mississippi 94.9 91.2 97.5 95.9 87.1 95.5 92.5
Figure 1(continued) Elementary Secondary All Schools High-Poverty Low-Poverty Total Elem. High-Poverty Low-Poverty Total Second. Missouri 96.7 93.9 98.8 96.9 91.8 98.1 96.5 Montana 99.4 99.9 99.9 99.9 98.7 99.3 99.3 Nebraska 97.5 98.6 96.9 98.4 96.1 97.7 97.1 Nevada 86.6 86.0 93.3 90.0 80.0 87.6 85.4 New Hampshire 98.7 98.0 99.8 99.3 98.1 98.8 98.5 New Jersey 98.8 97.8 98.4 98.9 97.2 99.1 98.7 New Mexico 91.7 93.8 96.7 93.4 90.8 94.1 91.1 New York 95.0 94.9 99.1 97.4 83.9 97.1 93.2 North Carolina 97.2 98.3 99.2 98.6 92.5 96.7 95.5 North Dakota 100.0 100.0 100.0 100.0 100.0 100.0 100.0 Ohio 96.5 89.5 99.2 97.1 87.2 98.8 95.8 Oklahoma 93.7 95.3 97.6 96.8 85.4 93.1 91.8 Oregon 89.9 96.8 90.2 94.8 87.5 89.8 88.6 Pennsylvania 96.5 90.5 99.3 96.6 87.2 98.4 96.3 Rhode Island 94.9 97.1 98.0 97.7 89.1 94.5 92.5 South Carolina 95.7 92.3 97.7 96.3 87.8 96.8 93.8 South Dakota 97.9 98.9 98.5 99.1 95.1 97.0 97.3 Tennessee 97.4 98.1 99.1 98.9 93.7 97.9 96.2 Texas 98.1 98.9 99.6 99.3 96.7 98.7 97.7 Utah 78.8 89.2 84.4 87.4 75.7 85.1 77.5 Vermont 92.8 92.0 92.2 92.2 91.3 94.0 93.1 Virginia 96.8 96.6 98.5 97.9 93.5 98.1 96.5 Washington 98.2 99.2 99.7 99.5 96.2 98.4 97.9 West Virginia 90.9 94.2 95.9 95.3 82.8 87.2 87.8 Wisconsin 98.4 97.2 99.3 98.7 95.2 99.1 98.1 Wyoming 95.6 95.6 96.1 96.8 93.2 97.4 95.3 Average 94.2 93.5 96.6 95.9 88.7 95.4 93.0
Summary of Diversity
States have developed their own definitions of Highly Qualified Teacher in compliance with the NCLB requirements that highly qualified teachers should hold a bachelor’s degree, have full state certification, and possess demonstrable content knowledge in their content areas. In order for veteran teachers to meet the HQT requirements, states employed the HOUSSE which afforded teachers the opportunity to evince content knowledge without a college major or licensing exams in their teaching field. To meet HQT in Arkansas, a teacher must hold an
Arkansas teaching license, have passed the appropriate Praxis I and II exams in pedagogy as well as in content area. In the early years of NCLB, Arkansas teachers could fulfill the requirements through a combination of teaching-specific activities on the ARHOUSSE.
States, originally, were to report percentages of teachers highly qualified in 2003. Of the 45 states or jurisdictions reporting, twenty reported that at least 90% of classrooms were taught by highly qualified teachers. By the 2008-2009 school year, 97% of core academic classes on the Elementary level and 95% on the Secondary level where taught by highly qualified teachers.
Teacher Shortages and Out-of-field Teaching
In discussions of NCLB, certain points have recurred with paucity of qualified teachers often identified. Teacher shortages in certain fields and staffing in rural and inner-city schools have been identified as making HQT even more difficult to achieve (Spelling, 2005). The shortages that exist ultimately hurt disadvantaged students, such as those in high-poverty schools where hiring and retention are the most problematic (Spelling, 2006). The states’ challenge is to meet the issue of shortages without lowering their HQT standards.
Secretary Spelling (2005) claimed that the U.S. does not have an overall shortage of qualified teachers. Further, she stated that the nation prepares an excess of Elementary teachers but not
nearly enough Secondary teachers in critical areas like mathematics, the sciences, limited English proficient, and special education. The U.S. Department of Education revealed that as many as one in four high school mathematics teachers and one in five science teachers did not major or minor in their content area (Rotherham & Mead, 2003). Other research revealed that 8th grade students in the U.S. and Hong Kong were less likely than their peers in England, Japan, the Netherlands, Korea, Singapore and Australia to have teachers with a college major in
mathematics or science (Wang, Ashaki, Coley, & Phelps, 2003).
In his 2006 study, Ingersoll reported on teacher qualifications in seven countries: China, Hong Kong, Japan, South Korea, Singapore, Thailand, and the U.S. Only China, Hong Kong, and Singapore did not require a bachelor’s degree for some level of teaching and were the only countries of the seven to allow teaching with an associate’s degree. The lowest qualification in the seven nations was the requirement of a high school diploma for Chinese Elementary teachers. But, for Secondary teaching, all except Hong Kong required at least a bachelor’s degree. For licensure, all systems except Hong Kong required expertise in both subject matter and pedagogy, both obtained in undergraduate coursework with the possible addition of a post-baccalaureate year.
Ingersoll (2006) identified that the U.S., Korea, and Thailand had the greatest percentage of teachers with master’s degrees or higher. The U.S. far surpassed the other countries, with 49% of Secondary teachers holding master’s degrees or higher.1 However, the U.S. trailed Korea,
Thailand, Singapore, and Japan in the percentage of fully certified Secondary teachers with a degree. On the Elementary level, Hong Kong and Thailand both exceeded the U.S. in the percentage with degrees and certification. A surprising result was that the U.S. far exceeded Japan, Korea, and Hong Kong in the proportion of teachers instructing out-of-field in their native
language, math, science and social studies. In Japan, out-of-field teaching was virtually nonexistent.
Out-of-field teaching, the direct result of qualified teacher shortages and understaffing, may be a contributor to the U.S. student shortfall on international achievement tests. Fifteen-year-old American students scored near the international average on the 2009 Program for International Student Assessment (PISA) reading literacy section (“Reading Literacy,” 2010). Six countries including Japan and Korea outscored U.S. students. Seventeen countries performed higher than the U.S. on the mathematics section with the U.S. mean registering below the international average (“Mathematics Literacy,” 2010). U.S. fifteen year olds scored close to the international average on the science literacy section of the PISA. Twelve countries including Japan, Korea, and the United Kingdom, outscored the U.S. students (“Science Literacy,” 2010).
The Trends in International Mathematics and Science Study (TIMSS) of 2003 revealed U.S. students lagging behind in the tested content areas. In science, U.S. fourth-graders ranked sixth behind Singapore, Japan, and Hong Kong, and ninth in eighth-grade science. In fourth-grade mathematics, the U.S. ranked 12th and in eighth-grade math, 15th, both behind Singapore, Hong Kong, Japan, and other countries (“TIMSS 2003,” 2003).
In the 2007 TIMSS results, U.S. fourth-graders ranked 11th in math, again with an average score below Asian countries. Eighth-grade mathematics results placed U.S. scores 9th in the list of 48 countries. Though still falling behind Asian students in math scores, U.S. students had improved their average scores significantly since 1995. Science results were not measurably different. Again, participating Asian countries outscored U.S. students in science (Gonzales et al., 2008). U.S. fourth-graders ranked 8th while eighth-graders ranked 11th.
These international student results were seemingly opposite what would be expected from highly degreed teachers. The U.S. was a leader in the percentage of teachers with advanced degrees, but student scores in science and mathematics did not reflect this. Ingersoll (2006) suggested that entry into the teaching field in the U.S. was not especially restrictive nor difficult. In the other countries of his study, teaching was a highly desirable occupation for salary and status reasons and was, thus, more selective. Other explanations offered by Ingersoll for lagging international test scores were that Asian teachers experience more professional development and preparation than U.S. teachers and that students in those high ranking countries are more likely to be taught by teachers who attained a college major in their content area.
Akiba, LeTendre, and Scribner (2007) revealed similar results to Ingersoll. Higher achieving countries had higher percentages of students taught by fully certified, experienced mathematics teachers. Their research focused on eighth-grade student achievement on the 2003 TIMSS and socioeconomic achievement gaps. Authors reported that of 46 countries, the U.S. was ranked 15th in national student achievement and 10th in the size of achievement gaps. They revealed that only 47.3% of U.S. eighth-grade students were taught by teachers with a mathematics
degree. The international average was 70.9%. Though average student achievement rose with the level of HQT among countries, socioeconomic achievement gaps were not significantly related to qualified teacher opportunity gaps. Discussed was the role of professional development and equalization of instructional resources to narrow the achievement gaps.
In the U.S., disparity among states exists in the number of teachers trained annually. Five states, California, New York, Texas, Illinois, and Pennsylvania produced about 39% of the nation’s teachers in 2004-2005 (Duncan, 2009). In 2005, New York, California, and Texas alone prepared over half of the alternative program completers. Other states, like Nevada and