Edith L. Parrott and Karen J. Weiland
Glenn Research Center, Cleveland, Ohio
Using Model-Based Systems Engineering To
Provide Artifacts for NASA Project Life-Cycle
and Technical Reviews
NASA/TM—2017-219575
AIAA–2017–5299
NASA STI Program . . . in Profi le
Since its founding, NASA has been dedicated to the advancement of aeronautics and space science. The NASA Scientifi c and Technical Information (STI) Program plays a key part in helping NASA maintain this important role.
The NASA STI Program operates under the auspices of the Agency Chief Information Offi cer. It collects, organizes, provides for archiving, and disseminates NASA’s STI. The NASA STI Program provides access to the NASA Technical Report Server—Registered (NTRS Reg) and NASA Technical Report Server— Public (NTRS) thus providing one of the largest collections of aeronautical and space science STI in the world. Results are published in both non-NASA channels and by NASA in the NASA STI Report Series, which includes the following report types:
• TECHNICAL PUBLICATION. Reports of completed research or a major signifi cant phase of research that present the results of NASA programs and include extensive data or theoretical analysis. Includes compilations of signifi cant scientifi c and technical data and information deemed to be of continuing reference value. NASA counter-part of peer-reviewed formal professional papers, but has less stringent limitations on manuscript length and extent of graphic presentations.
• TECHNICAL MEMORANDUM. Scientifi c and technical fi ndings that are preliminary or of specialized interest, e.g., “quick-release” reports, working papers, and bibliographies that contain minimal annotation. Does not contain extensive analysis.
• CONTRACTOR REPORT. Scientifi c and technical fi ndings by NASA-sponsored contractors and grantees.
• CONFERENCE PUBLICATION. Collected papers from scientifi c and technical
conferences, symposia, seminars, or other meetings sponsored or co-sponsored by NASA.
• SPECIAL PUBLICATION. Scientifi c, technical, or historical information from NASA programs, projects, and missions, often concerned with subjects having substantial public interest.
• TECHNICAL TRANSLATION. English-language translations of foreign scientifi c and technical material pertinent to NASA’s mission.
For more information about the NASA STI program, see the following:
• Access the NASA STI program home page at http://www.sti.nasa.gov
• E-mail your question to [email protected]
• Fax your question to the NASA STI Information Desk at 757-864-6500
• Telephone the NASA STI Information Desk at 757-864-9658
• Write to:
NASA STI Program Mail Stop 148
NASA Langley Research Center Hampton, VA 23681-2199
Edith L. Parrott and Karen J. Weiland
Glenn Research Center, Cleveland, Ohio
Using Model-Based Systems Engineering To
Provide Artifacts for NASA Project Life-Cycle
and Technical Reviews
NASA/TM—2017-219575
AIAA–2017–5299
National Aeronautics and
Space Administration
Glenn Research Center
Cleveland, Ohio 44135
Prepared for the
Space Forum
sponsored by AIAA
Available from
Trade names and trademarks are used in this report for identifi cation only. Their usage does not constitute an offi cial endorsement,
either expressed or implied, by the National Aeronautics and Space Administration.
Level of Review: This material has been technically reviewed by technical management.
Using Model-Based Systems Engineering To Provide Artifacts for
NASA Project Life-Cycle and Technical Reviews
Edith L. Parrott and Karen J. Weiland National Aeronautics and Space Administration
Glenn Research Center Cleveland, Ohio 44135
Abstract
The ability of systems engineers to use model-based systems engineering (MBSE) to generate self-consistent, up-to-date systems engineering products for project life-cycle and technical reviews is an important aspect for the continued and accelerated acceptance of MBSE. Currently, many review
products are generated using labor-intensive, error-prone approaches based on documents, spreadsheets, and chart sets; a promised benefit of MBSE is that users will experience reductions in inconsistencies and errors. This work examines features of SysML that can be used to generate systems engineering products. Model elements, relationships, tables, and diagrams are identified for a large number of the typical systems engineering artifacts. A SysML system model can contain and generate most systems engineering products to a significant extent and this paper provides a guide on how to use MBSE to generate products for project life-cycle and technical reviews. The use of MBSE can reduce the schedule impact usually experienced for review preparation, as in many cases the review products can be auto-generated directly from the system model. These approaches are useful to systems engineers, project managers, review board members, and other key project stakeholders.
1.0
Introduction
The institutional requirements for how NASA performs systems engineering are in the NASA Procedural Requirements (NPR) 7123.1, “NASA Systems Engineering Processes and Requirements,” (Ref. 1). The NPR defines a set of required systems engineering products for program and project life-cycle and technical reviews. It also describes the 17 common technical processes for space flight, research and technology, and institutional programs and projects. These processes, which are used throughout all life-cycle phases, form what is called the NASA “systems engineering engine”. The NPR describes typical best practices, with inputs, activities, and outputs, for each process. The NPR also contains the roles and responsibilities for implementing the requirements and processes, guidance on tailoring and customization of requirements and processes, activities and requirements for contractor oversight, and life-cycle and technical review requirements. Supplementary information on all these topics is available in the “Expanded Guidance for NASA Systems Engineering, Volume 1and Volume 2,” (Refs. 2 and 3). To date, NASA systems engineers have used primarily a document-centric approach to producing systems engineering artifacts and deliverables, although the NPR does not explicitly require this.
Currently, many systems engineers produce artifacts in the form of electronic records using office productivity software. The records are comprised of electronic documents, workbooks, diagrams, and chart sets. Since the contents of the electronic records are not related together in an organized fashion, several immediate and long-term problems can arise. Because each record is developed independently, the collection of records often contains inconsistencies in the detailed contents, despite intentional effort to find and correct errors. Identifying inconsistencies, determining all the affected electronic records, processing change requests to approve corrections, and making the updates are labor-intensive.
System-level queries and analyses are also labor-intensive as manual effort is often needed to synthesize the information residing in a multitude of unrelated sources and dissimilar formats.
The systems engineering community is moving toward a model-based approach that offers many benefits, including eliminating inconsistencies. Models can be descriptive of the system or used to analyze its performance. This paper primarily discusses the descriptive modeling aspects. There are multiple tools, languages, and methods that can be employed to create models; this paper focuses on the application of SysML.
Over the past decade, NASA has investigated model-based systems engineering (MBSE) and the Systems Modeling Language (SysML) (Ref. 4) through exploratory usage, training, and working groups. Hundreds of systems engineers have been trained in the language and tools, and some projects are using MBSE; however there is not yet widespread use of MBSE. After receiving training, engineers are often unsure of how to apply it to their projects, and how MBSE fits within the NASA systems engineering processes. The NPR neither mentions nor prohibits the use of MBSE. The recently issued expanded guidance supplement to the NASA Systems Engineering Handbook, Volume 2 (Ref. 3) contains a section of introductory material about MBSE and efforts are underway as part of a MBSE Pathfinder to develop and evaluate how to use MBSE within the NASA systems engineering processes (Ref. 5).
A previous MBSE effort related to the NPR was the modeling performed by the Agency-level Systems Engineering Working Group, the NASA Langley Research Center, and the NASA Integrated Model-Centric Architecture teams. This effort modeled the 17 systems engineering processes themselves, with the internal inputs and outputs, to find inconsistencies within the NPR and have them corrected for a future revision.
This paper provides a guide and some examples of how to use MBSE, specifically with SysML, to produce the primary systems engineering products required for project life-cycle and technical reviews. These products are of value to key stakeholders on the project such as the Lead Systems Engineer, Project Chief Engineer, Project Manager, Customer, Review Board, and others. The user may need to discuss the format of the artifacts with the key stakeholders, as the format may be different from what has been previously provided. The guidance in this paper is useful to system modelers and to people who are unfamiliar with MBSE, in illustrating how MBSE can be used to implement systems engineering processes.
2.0
Approach
The NASA systems engineering engine in the NPR identifies the processes that systems engineers use for their work. Each process has outputs, some of which are products that are required products for reviews. The NPR contains a table that lists the required products and their maturity at each of the major reviews. A few additional products not listed as required, such as interface definitions and implementation plans, are considered primary products. Since a multitude of systems engineering products can be
generated through the course of a project above and beyond those needed for major reviews, the scope of the effort presented in this paper is that of the required and primary systems engineering products for NASA project life-cycle and technical reviews. The required systems engineering products are listed below, by review:
1. Mission Concept Review: baselined stakeholder identification and expectations definitions; baselined concept definition; approved measures of effectiveness definition.
2. System Requirements Review: baselined systems engineering management plan for projects, single-project programs, and one-step Announcement of Opportunity programs; baselined requirements. 3. Mission Definition Review/System Definition Review: approved technical performance measure
definitions; baselined architecture definition; baselined allocation of requirements to next lower level; initial trend of required leading indicators; baseline systems engineering management plan for
7. Operational Readiness Review: updated operational plans; updated operational procedures; preliminary decommissioning plans.
8. Flight Readiness Review: baseline disposal plans; baseline verification and validation results; final certification for flight/use.
9. Decommissioning Review: baseline decommissioning plans. 10. Disposal Readiness Review: updated disposal plans.
Sections 3.0 to 16.0 contain information for each of the major systems engineering products listed above. Each of these sections contains subsections that identify artifacts necessary to produce the products and is displayed in the following format: artifacts, model elements and relationships, model validation, and additional details. The artifacts subsection lists products commonly generated for reviews and the SysML equivalent artifacts. The model elements and relationships subsection explains which SysML table, matrix, model element, diagram, relationships, or other elements would generate or contribute to this artifact. The model validation subsection has common questions that can be considered to evaluate completeness and accuracy of model artifacts relative to the model’s intent using basic SysML modeling queries. There are many validation techniques not described here, such as scripting and
visualizations, that can be used; the ones listed are suggestions.
Since many of the system model elements are used across the system life-cycle and in multiple artifacts, duplicative information is referenced and not repeated. Some of the model elements may be put into a system model earlier than necessary for a particular review and serve as placeholders for later use. The maturity of the model elements, diagrams, and information in a system model depends on where the project is in its lifecycle. In the beginning, the model incorporates high level information as the project is still being developed. During this phase, development of stakeholder identification and expectations definition, concept definition, measures of effectiveness, cost and schedule, system engineering management plan, and requirements are modeled. Many model elements will contain only key or
placeholder information. As the project matures, more information is added to the model such as technical performance measures, architecture, lower level requirements, interfaces, and activity flows, to name a few. These all come together to support testing, verification and validation, flight certification, mission scenarios, and mission operations.
3.0
Stakeholder Identification and Expectations Definition
The stakeholders are identified within the model, linked to their needs, goals, and objectives (NGOs); wants; and constraints. This is useful during change impact assessments, as the systems engineer can determine which stakeholders will be affected if a NGO changes or cannot be satisfied.
3.1
Artifacts
The artifacts used to identify the stakeholders and their expectations, in general, are listed in Table 1.
TABLE 1.—STAKEHOLDER AND EXPECTATIONS ARTIFACTS Stakeholder and Expectations artifacts Model artifact List that identifies customers and stakeholders Table.
List of expectations (needs, wants, desires, capabilities, and constraints) Table or matrix. Traceability of stakeholder expectations to stakeholders Table or matrix. List of expectation allocated to stakeholders Table or matrix.
Priority of the expectation Table.
3.2
Model Elements and Relationships
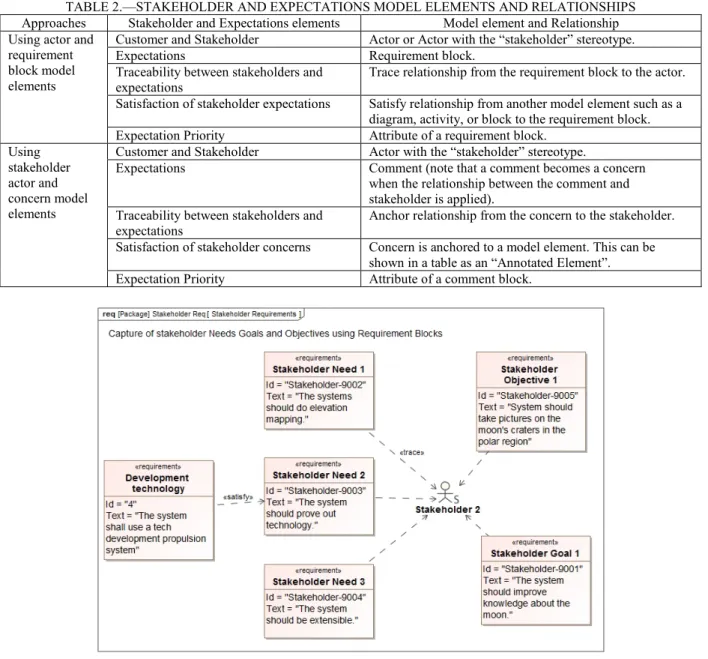
This section discusses two possible ways to capture stakeholder information. The first is to use the SysML elements of an actor and a requirement block. The second is to use the SysML elements of a stakeholder actor and a concern. There are advantages and disadvantages to both approaches that are not discussed here as it is beyond the scope of this paper. The model elements and relationships for both approaches are listed in Table 2.
Figure 1 shows an example using requirement blocks to capture the NGO and then traced to the corresponding stakeholder that established the NGO. It also shows how the satisfy relationship indicates that a requirement is developed to satisfy a NGO.
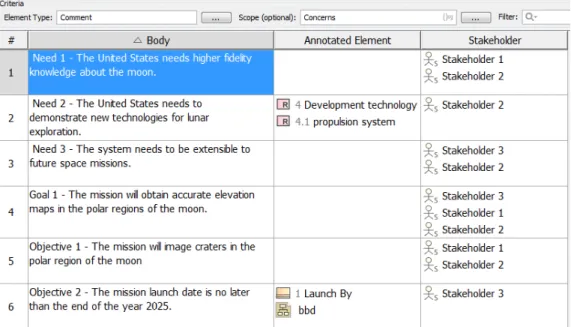
Figure 2 shows an example of how the comments or concerns are displayed in a table. It also shows how the stakeholder NGOs are being satisfied as noted in the annotated element column and which stakeholder is interested. The Annotated Element column shows the model elements that are anchored to the concern and in turn satisfy it.
TABLE 2.—STAKEHOLDER AND EXPECTATIONS MODEL ELEMENTS AND RELATIONSHIPS Approaches Stakeholder and Expectations elements Model element and Relationship Using actor and
requirement block model elements
Customer and Stakeholder Actor or Actor with the “stakeholder” stereotype.
Expectations Requirement block.
Traceability between stakeholders and
expectations Trace relationship from the requirement block to the actor. Satisfaction of stakeholder expectations Satisfy relationship from another model element such as a
diagram, activity, or block to the requirement block. Expectation Priority Attribute of a requirement block.
Using stakeholder actor and concern model elements
Customer and Stakeholder Actor with the “stakeholder” stereotype.
Expectations Comment (note that a comment becomes a concern when the relationship between the comment and stakeholder is applied).
Traceability between stakeholders and
expectations Anchor relationship from the concern to the stakeholder. Satisfaction of stakeholder concerns Concern is anchored to a model element. This can be
shown in a table as an “Annotated Element”. Expectation Priority Attribute of a comment block.
Figure 2.—Stakeholder requirements captured using comments.
TABLE 3.—STAKEHOLDER IDENTIFICATION AND EXPECTATIONS DEFINITION VALIDATION
Validation question Validation method
Does every expectation have at least one
associated stakeholder? Use an allocation matrix that contains stakeholders, expectations, and the allocation relationships to evaluate whether each expectation is allocated to a stakeholder.
For later in the life cycle, have all the
expectations been satisfied? This can be shown two ways: (1) a satisfy matrix that contains expectations and the satisfy relationships to model elements; or (2) a table that lists all the expectations and model elements that satisfy the expectations.
3.3
Model Validation Information
Validation is captured in many ways and at various levels of maturity. The main ways to show compliance are described in Table 3. These questions are only a starting point and they can be performed using model-generated tables and diagrams.
3.4
More Detail
Expectations can be major and minor concerns. Minor expectations can be smaller tasks or analyses that need to be completed later in the project life-cycle, and if useful to the systems engineering planning effort, may be captured within the model.
4.0
Concept Definition
In starting any project a concept of operations (ConOps) for the mission or system is needed to detail the mission lifecycle and objectives. It is necessary to have an understanding of the whole mission and project timeline to design the system. The ConOps also helps define the high-level architectural structure, requirements, activities, and functions the system must address or perform and establishes trade space boundaries. To begin a project, an overview of the project scenario is created at a very high level. This overview could include events or activities, such as launch, payload separation, travel to locations, perform science, etc. These events are decomposed into smaller activities or functions. For example, the launch event might be decomposed into smaller activities such as install payload, load propellant, and trickle charge batteries. The ConOps is updated with greater fidelity as the project progresses and as more details of the mission, objectives, and functions are defined.
For clarity, for this document, an activity can be decomposed into multiple functions, where a function is at its lowest level of decomposition for either the function or modeling level. For simplicity, the term function is used, in this section, to represent both activities and functions and not to get it confused with activity diagrams.
4.1
Artifacts
The artifacts for concept definition, in general, are listed in Table 4.
4.2
Model Elements and Relationships
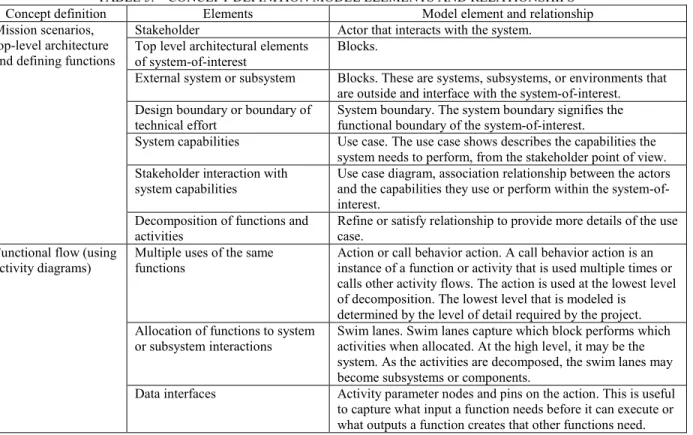
The model elements and relationships commonly utilized in the development of concept definition are listed in Table 5. The table is broken into four groups: mission scenarios, top-level architecture and defining functions; functional flow using activity diagrams; functional decomposition; and common element and relationship.
TABLE 4.—CONCEPT DEFINITION ARTIFACTS Concept definition artifacts Model artifact Mission scenario and functions Use case diagram.
Top-level system architecture concept Block definition diagram.
System functions Use case diagram and activity diagram. System functional flows (data and activity) Activity diagram.
Functional decomposition Block definition diagram or activity tree diagram. TABLE 5.—CONCEPT DEFINITION MODEL ELEMENTS AND RELATIONSHIPS Concept definition Elements Model element and relationship Mission scenarios,
top-level architecture and defining functions
Stakeholder Actor that interacts with the system. Top level architectural elements
of system-of-interest Blocks.
External system or subsystem Blocks. These are systems, subsystems, or environments that are outside and interface with the system-of-interest. Design boundary or boundary of
technical effort System boundary. The system boundary signifies the functional boundary of the system-of-interest. System capabilities Use case. The use case shows describes the capabilities the
system needs to perform, from the stakeholder point of view. Stakeholder interaction with
system capabilities Use case diagram, association relationship between the actors and the capabilities they use or perform within the system-of-interest.
Decomposition of functions and
activities Refine or satisfy relationship to provide more details of the use case. Functional flow (using
activity diagrams) Multiple uses of the same functions Action or call behavior action. A call behavior action is an instance of a function or activity that is used multiple times or calls other activity flows. The action is used at the lowest level of decomposition. The lowest level that is modeled is determined by the level of detail required by the project. Allocation of functions to system
or subsystem interactions Swim lanes. Swim lanes capture which block performs which activities when allocated. At the high level, it may be the system. As the activities are decomposed, the swim lanes may become subsystems or components.
Data interfaces Activity parameter nodes and pins on the action. This is useful to capture what input a function needs before it can execute or what outputs a function creates that other functions need.
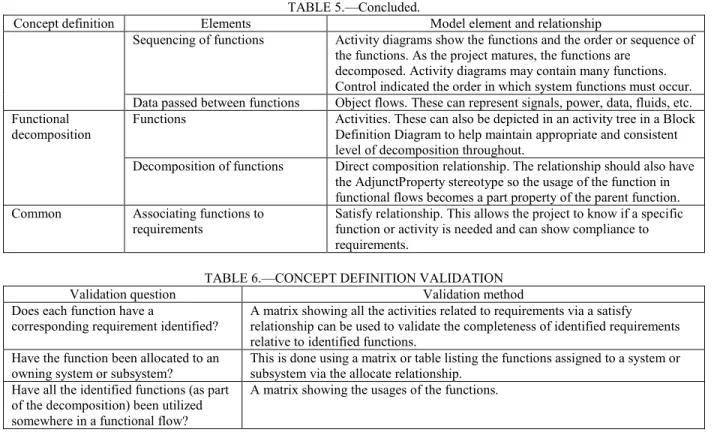
TABLE 5.—Concluded.
Concept definition Elements Model element and relationship
Sequencing of functions Activity diagrams show the functions and the order or sequence of the functions. As the project matures, the functions are
decomposed. Activity diagrams may contain many functions. Control indicated the order in which system functions must occur. Data passed between functions Object flows. These can represent signals, power, data, fluids, etc. Functional
decomposition Functions Activities. These can also be depicted in an activity tree in a Block Definition Diagram to help maintain appropriate and consistent level of decomposition throughout.
Decomposition of functions Direct composition relationship. The relationship should also have the AdjunctProperty stereotype so the usage of the function in functional flows becomes a part property of the parent function. Common Associating functions to
requirements Satisfy relationship. This allows the project to know if a specific function or activity is needed and can show compliance to requirements.
TABLE 6.—CONCEPT DEFINITION VALIDATION
Validation question Validation method
Does each function have a
corresponding requirement identified? A matrix showing all the activities related to requirements via a satisfy relationship can be used to validate the completeness of identified requirements relative to identified functions.
Have the function been allocated to an
owning system or subsystem? This is done using a matrix or table listing the functions assigned to a system or subsystem via the allocate relationship. Have all the identified functions (as part
of the decomposition) been utilized somewhere in a functional flow?
A matrix showing the usages of the functions.
4.3
Model Validation Information
The main ways to show compliance are described in Table 6. These questions are only a starting point and they can be performed using model-generated tables and diagrams.
4.4
More Detail
Top-level capabilities of the system-of-interest are modeled as use cases. Use cases refine stakeholder expectations (requirements). Relationships among use cases, actors, the system-of-interest, boundaries, constraints, and environments are modeled in use case diagrams or in a block definition diagram as a system context. System behaviors, are modeled as actions. Actions can be allocated to other model elements and defined as activities. Relationships among functions, e.g., the order in which they should occur or functional interfaces, are shown on activity diagrams.
5.0
Measures of Effectiveness (MOE), Measures of Performance (MOP),
and Technical Performance Measures (TPM)
MOE, MOP, and TPM are all captured the same in the modeling world. The only difference is in the calculations performed with them and the relationships among the model elements. MOE are the
operational measures of success and are intended to focus on how well the mission operational objectives are can be achieved from the mission success criteria and are derived from the stakeholder’s expectations. MOP are measures that characterize physical or functional attributes relating to the system and are typically derived from MOE. TPM are derived from the MOE and MOP. They are critical or key for mission success. TPM are measures such as mass, availability, mobility, user or operator comfort, CPU capacity, and parameters associated with critical events during operations.
5.1
Artifacts
The artifacts used for MOE, MOP and TPM, in general, are listed in Table 7.
5.2
Model Elements and Relationships
Creating MOE, MOP and TPM using parametrics may be difficult to set up. Once accomplished, it is easier to collect, manage, and see trends. Many of the model elements and relationships in this section are setting up parametrics. It is beneficial to reference the MBSE tool-of-choice user guide. Start off small and then increase the parametric detail as needed, rather than starting off too large with too many variables to troubleshoot initially. The model elements and relationships for MOE, MOP, and TPM are listed in Table 8.
TABLE 7.—MOE, MOP, AND TPM ARTIFACTS Measures of Effectiveness (MOE), Measures of Performance (MOP)
and Technical Performance Measures (TPM) artifacts Model artifact
Metric (MOE, MOP, or TPM) Instance.
Metric (MOE, MOP, or TPM) to NGO(s) traceability Table. Metric (MOE, MOP, or TPM) to requirements traceability Table.
MOE, MOP and TPM decomposition Matrix.
Tracking trends See Section 10.0, Required Leading Indicator Trends.
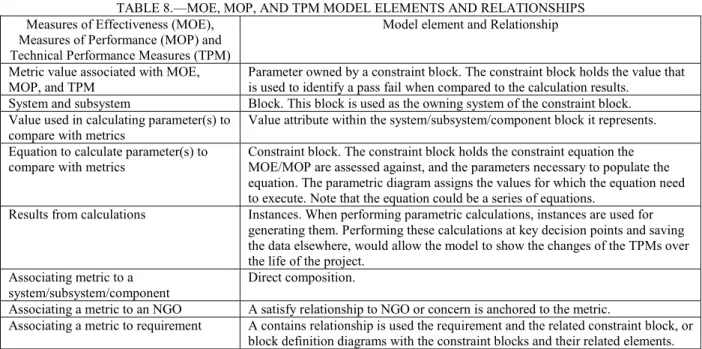
TABLE 8.—MOE, MOP, AND TPM MODEL ELEMENTS AND RELATIONSHIPS Measures of Effectiveness (MOE),
Measures of Performance (MOP) and Technical Performance Measures (TPM)
Model element and Relationship Metric value associated with MOE,
MOP, and TPM Parameter owned by a constraint block. The constraint block holds the value that is used to identify a pass fail when compared to the calculation results. System and subsystem Block. This block is used as the owning system of the constraint block. Value used in calculating parameter(s) to
compare with metrics Value attribute within the system/subsystem/component block it represents. Equation to calculate parameter(s) to
compare with metrics Constraint block. The constraint block holds the constraint equation the MOE/MOP are assessed against, and the parameters necessary to populate the equation. The parametric diagram assigns the values for which the equation need to execute. Note that the equation could be a series of equations.
Results from calculations Instances. When performing parametric calculations, instances are used for generating them. Performing these calculations at key decision points and saving the data elsewhere, would allow the model to show the changes of the TPMs over the life of the project.
Associating metric to a
system/subsystem/component Direct composition.
Associating a metric to an NGO A satisfy relationship to NGO or concern is anchored to the metric.
Associating a metric to requirement A contains relationship is used the requirement and the related constraint block, or block definition diagrams with the constraint blocks and their related elements.
5.3
Model Validation Information
Validation is captured in many ways and at various levels of maturity. The main ways to show compliance are described in Table 9. These questions are only a starting point and they can be performed using model-generated tables and diagrams.
5.4
More Detail
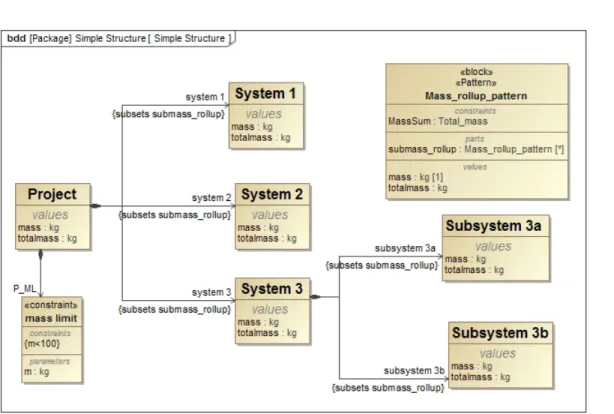
Quantitative TPM can be used in parametric diagrams. Figure 3 shows an example of a block definition diagram that would be used to perform a system mass roll-up. The system blocks have value properties of mass and total mass. The mass value is the mass for the block that is contained only within that block and not in lower-level blocks. Total mass for a block is the mass of the block added to the rolled-up mass from lower-level system blocks. For example, the total mass for System 3 is the rolled-up mass value from lower-level blocks Subsystems 3a and 3b, and the mass of System 3 that is not within Subsystems 3a and 3b. The Mass_rollup_pattern has a generalization relationship to all model elements associated within the calculation which is not shown.
TABLE 9.—MOE, MOP AND TPM VALIDATION
Validation question Validation method
Which MOE, MOP or TPM satisfy a
concern? Table showing the MOP and TPM with their related model elements via the satisfy relationship. Which MOP and TPM are related to a
requirement, system or subsystem? Table showing the MOP and TPM with their related model elements. The relationship used is dependent on the project. Have the constraint equations been
implemented correctly in the model? Run a known configuration to show that the model configuration produces the expected results.
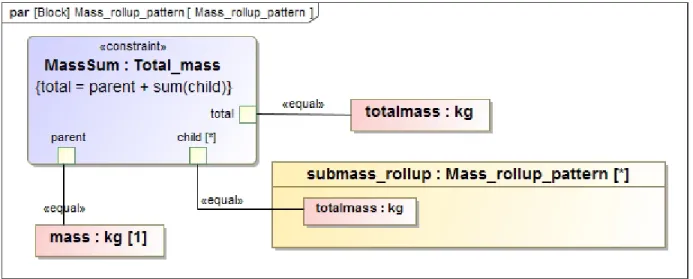
Figure 4 shows the parametrics based on the Mass_rollup_pattern. The parametric diagram is where the value properties are assigned to parameters on the constraint. The model has a constraint block for the mass roll-up equation.
Based on Figure 3 and Figure 4, calculations on instances are performed. Table 10 shows the mass roll-up instances over the course of 10 days of work. An additional constraint block, not shown, performs trending and validates that the mass margins are met. For this example, the mass limit is 100 kg. The table allows the project personnel to see trends and know when there is a failure to meet a metric.
Figure 4.—Parametric diagram for a mass roll-up.
TABLE 10.—MASS ROLL-UP INSTANCE FOR MASS TRENDS
# Name P_ML: mass limit totalMass: kg 1.totalMass: system kg system 2.totalMass: kg system 3.totalMass: kg system 3.subsystem 3a.totalMass: kg system 3.subsystem 3b.totalMass: kg 1 Project 06-01-2016 pass 75.0 10.0 15.0 50.0 25.0 25.0 2 Project 09-01-2016 pass 95.0 10.0 25.0 60.0 25.0 35.0 3 Project 06-05-2017 pass 93.0 10.0 25.0 58.0 21.0 37.0 4 Project 06-06-2017 pass 97.0 14.0 25.0 58.0 21.0 37.0 5 Project 06-10-2017 fail 105.0 17.0 28.0 60.0 21.0 39.0
6.0
Cost and Schedule for Technical Implementation
Cost and schedule currently are usually kept in an external tool because of the amount of detail. However, some information can be kept within the model. The data can be exported to be combined with external data. This section will describe how the data can be stored within the MBSE tool and how the data can be shown. It does not go into how the information can be imported or exported from the model. This section does not show the full extent of all the cost and schedule artifacts, but gives an overall idea of how to capture the data. Section 7.0, System Engineering Management Plan, has some additional information on this topic.
6.1
Artifacts
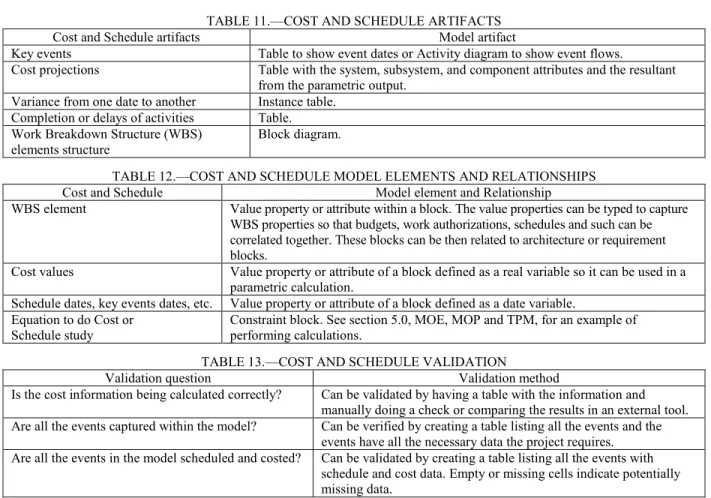
The artifacts used for cost and schedule artifacts, in general, are listed in Table 11.
6.2
Model Elements and Relationships
The model elements that would be used are listed in Table 12. Some of the elements listed below are attributes. Depending on how the model is structured, these attributes could be part of a stereotype, generalization from another block, or block specific. How the attribute is defined is not discussed.
6.3
Model Validation Information
Validation is captured in many ways and at various levels of maturity. The main ways to show
compliance are described in Table 13. These questions are only a starting point and they can be performed using model-generated tables and diagrams.
TABLE 11.—COST AND SCHEDULE ARTIFACTS
Cost and Schedule artifacts Model artifact
Key events Table to show event dates or Activity diagram to show event flows.
Cost projections Table with the system, subsystem, and component attributes and the resultant from the parametric output.
Variance from one date to another Instance table. Completion or delays of activities Table. Work Breakdown Structure (WBS)
elements structure Block diagram.
TABLE 12.—COST AND SCHEDULE MODEL ELEMENTS AND RELATIONSHIPS
Cost and Schedule Model element and Relationship
WBS element Value property or attribute within a block. The value properties can be typed to capture WBS properties so that budgets, work authorizations, schedules and such can be correlated together. These blocks can be then related to architecture or requirement blocks.
Cost values Value property or attribute of a block defined as a real variable so it can be used in a parametric calculation.
Schedule dates, key events dates, etc. Value property or attribute of a block defined as a date variable. Equation to do Cost or
Schedule study Constraint block. See section 5.0, MOE, MOP and TPM, for an example of performing calculations. TABLE 13.—COST AND SCHEDULE VALIDATION
Validation question Validation method
Is the cost information being calculated correctly? Can be validated by having a table with the information and manually doing a check or comparing the results in an external tool. Are all the events captured within the model? Can be verified by creating a table listing all the events and the
events have all the necessary data the project requires. Are all the events in the model scheduled and costed? Can be validated by creating a table listing all the events with
schedule and cost data. Empty or missing cells indicate potentially missing data.
6.4
More Detail
When doing cost and schedule, it is important to make sure that the data is changed in only a single location, and that all calculations pull the information the same way. If updates are done in multiple locations, then data can become obsolete, knowing which is correct can be difficult, and finding the source of any errors can be difficult.
Using the model to capture cost or schedule information, each update can be captured and
documented as an instance in the model. These instances can be shown in an instance table to can be used to perform trending analysis and for status.
7.0
System Engineering Management Plan (SEMP)
The SEMP is a living document that the project generates to define the technical integration methodologies and activities. The SEMP captures the processes the project uses and identifies the responsible party. The model may not contain all the information in its entirety that is in the SEMP. However, the system model can be used to generate sections of the document. Below are suggestions on how certain information is kept within the model.
7.1
Artifacts
The artifacts used for the SEMP, in general, are listed in Table 14.
7.2
Model Elements and Relationships
The model elements and relationships that are used in creating the SEMP artifacts are listed in Table 15.
7.3
Model Validation Information
Validation is captured in many ways and at various levels of maturity. The main ways to show
compliance are described in Table 16. These questions are only a starting point and they can be performed using model-generated tables and diagrams.
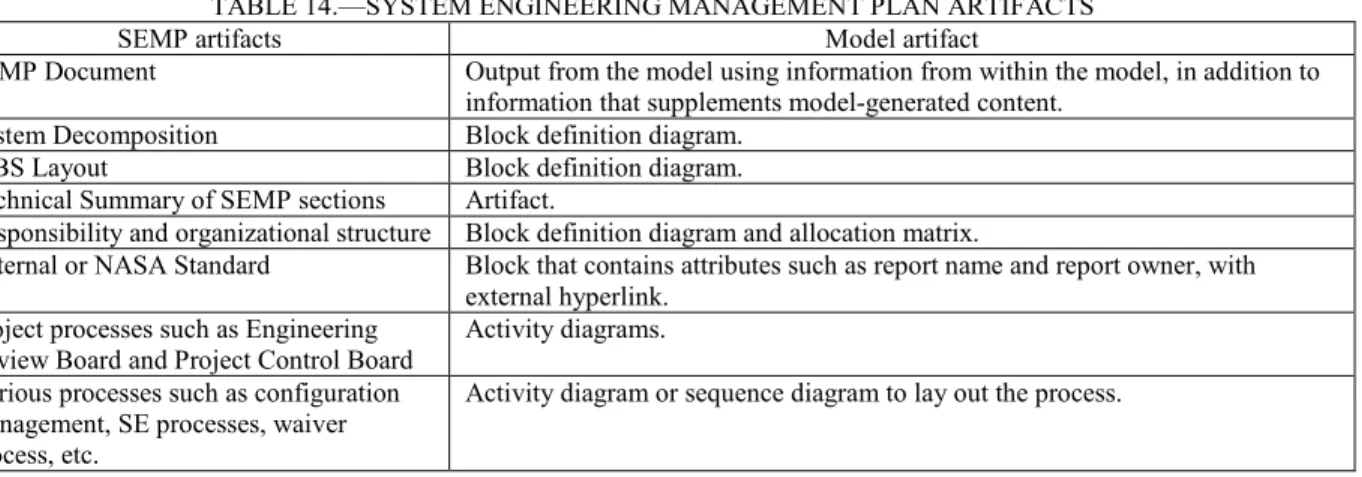
TABLE 14.—SYSTEM ENGINEERING MANAGEMENT PLAN ARTIFACTS
SEMP artifacts Model artifact
SEMP Document Output from the model using information from within the model, in addition to information that supplements model-generated content.
System Decomposition Block definition diagram.
WBS Layout Block definition diagram.
Technical Summary of SEMP sections Artifact.
Responsibility and organizational structure Block definition diagram and allocation matrix.
External or NASA Standard Block that contains attributes such as report name and report owner, with external hyperlink.
Project processes such as Engineering
Review Board and Project Control Board Activity diagrams. Various processes such as configuration
management, SE processes, waiver process, etc.
TABLE 15.—SYSTEM ENGINEERING MANAGEMENT PLAN MODEL ELEMENTS AND RELATIONSHIPS
SEMP Model element and Relationship
SEMP Package or content diagram. These diagrams contains folders or package information that can be found elsewhere in the model in a single diagram. Textual content Artifact or comment. In the document world, it is the text part of the document that
describes a section. When sections are repeated in other sections, it is better to capture the information in an artifact for easy reference. Comments and text boxes can be used when information is used for a single diagram. The textual content can be used to generate an external document if necessary.
Personnel and organizations associated
with the project Actors. These actors use an allocation relationship to the WBS structure. System component Block. See Section 9.0, Architecture Definition, for more information.
WBS structure Block. The structure is very similar to defining the system components, but instead of system and part, the blocks represent work packages. The direct composite relationship is used to show the breakdown of the work to system components. The black diamond is on the higher level and points to the next level down.
Project process activities Action block or call behavior action block. A control flow relationship is used to between action blocks, to show the process flow.
Organizational task allocation Swim lanes. Swim lanes capture which organization, such as project level or team, performs the process function.
Data interactions Activity parameter nodes and pins on the action block. This is useful when showing what input is needed before the process activity can proceed such as a change package and the outcome of that activity such as a scheduled review date, for the process to continue.
TABLE 16.—SYSTEM ENGINEERING MANAGEMENT PLAN VALIDATION
Validation question Validation method
Does the model have all the processes that
are required in a SEMP? Package diagram or content diagram and verify that all required sections contain the pertinent information. Do the WBS elements have allocations to an
organization or role? Matrix with all the WBS allocated to an organization or role? Do the process elements have owners
(personnel or system) associated with them? Matrix.
7.4
More Detail
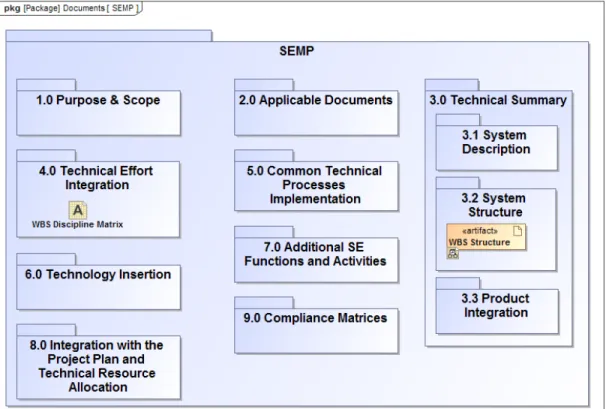
There are two ways of capturing the information necessary for creating a SEMP; a package diagram method as shown in Figure 5 or a content diagram shown in Figure 6. The SEMP outline used in Figure 5 and Figure 6 is based on the guidance in Appendix D of NPR 7123.1B (Ref. 1). As shown, it displays that a WBS structure diagram is created and associated with Section 3.2 of the SEMP and the WBS allocation matrix diagram associated with Section 4.0 of the SEMP. The difference between the two options is how the artifacts that satisfy the SEMP section are kept. In a package diagram, the SEMP information can be stored two ways: (1) an artifact is created inside the package and then the artifact is hyperlinked to the artifact within the model as shown in package 3.2 System Structure or (2) the artifact is stored within the package as shown in package 4.0 Technical Effort Integration. The artifact will not appear unless it is kept within the package location.
In a content diagram the artifact is dragged and dropped onto associated package which creates a hyperlink to the artifact within the model. Either way is acceptable and is a project decision on which to use.
The WBS structure diagram shown in Figure 7 is an example WBS structure that based on a space-flight project from Work Breakdown Structure (WBS) Handbook, Appendix C, (Ref. 6). Details associated with the WBS elements can be added using generalization or stereotype to add attributes that are required by the project. Figure 8 shows the allocation of work to the organizations. Figure 7 and Figure 8 are the artifacts that are shown in Figure 5 and Figure 6.
Figure 7.—WBS package diagram.
8.0
Requirements and Allocation of Requirements to Next Lower Level
Requirements are a way to state the physical and functional capabilities that a particular design, product or process must be able to perform. The requirement work starts at the very beginning during mission concept followed by decomposition. Requirement decomposition ends when the project is ready to make, buy or build. Requirements not only include the high level project and mission requirements, but also include technical, performance, interface, environmental, operational, reliability, safety, specialty and human factors. The requirements become more specific as they are further decomposed. The approach here is for text-based requirements.
8.1
Artifacts
The artifacts used to state, trace, and allocate requirements, in general, are listed in Table 17.
8.2
Model Elements and Relationships
The model elements and relationships that capture requirements artifacts are listed in Table 18.
8.3
Model Validation Information
Validation is captured in many ways and at various levels of maturity. The main ways to show
compliance are described in Table 19. These questions are only a starting point and they can be performed using model-generated tables and diagrams.
TABLE 17.—REQUIREMENTS ARTIFACT
Requirement artifact Model artifact
Requirements at various levels Requirement diagrams.
Requirement traceability Requirement diagram or matrix.
Requirement allocation to systems, events, functions and other relationships Matrix.
TABLE 18.—REQUIREMENT MODEL ELEMENTS AND RELATIONSHIPS
Requirement Model element and Relationship
Technical and programmatic requirement Requirement block.
Parent to child relationship Derive, trace, or containment relationship. Requirement to other model elements Satisfy or refine relationship.
Allocation of requirements to the next level
down system or subsystem Allocate relationship. The allocation relationship allows the next level down to know which requirements are assigned to them and which are not. Requirements verified by a verification event Verify relationship. A verification event can verify multiple requirements. Additional attributes of a requirement block Requirement block stereotype. This stereotype is commonly used when extra
attributes are required for all requirements. Types of attributes that could be added are: requirement status (draft, preliminary, baselined); verification status (open, closed), and rationale to name a few.
Measuring value in a requirement Value attribute within a block or requirement (if set as an attribute). This value can be in a requirement field and then placed or referenced in a constraint block for performing a mathematical relationship.
Associating requirements to NGO See Section 3.0, Stakeholder Identification and Expectations Definition. Associating functions to requirements Satisfy relationship.
TABLE 19.—REQUIREMENT VALIDATION
Validation question Validation method
Does every requirement have a parent or a child depending on the requirement level? Matrix.
Have the requirements been allocated to the physical structure elements? Allocation Matrix.
Figure 9.—General requirements stereotype profile.
8.4
More Detail
Requirement blocks are usually related to the following model elements: concerns, activity, functions, verification events, and blocks. These model elements are described in other sections within this paper. Relationships between the requirements and other model elements are created as the requirements are reviewed and baselined, and as more detail is added within the model.
Figure 9 shows an example of how attributes can be added to requirements and what they look like in the SysML requirement element after the stereotype is applied. The GenReqTypes stereotype is applied to a requirement block by a generalization relationship. When the “Launch By” requirement has the
stereotype <<GenReqTypes>>, the attributes of the GenReqTypes are applied. Figure 9 shows selected attributes but more are available.
9.0
Architecture Definition
Architecture definition is the system physical and logical structure and interconnections. This is not the WBS structure, but uses a similar construct. The architecture definition defines and breaks down the system into subsystems, and subsystems into assemblies or components, and so on until it is decomposed to the level the project needs. Depending on the project, the architecture may use three levels or less, or may have more levels if necessary. How the system and subsystems interface among each other is described in Section 11.3, Interface Definition. Having the architecture defined can make it easier to identify functions prior to allocating them to subsystems.
9.1
Artifacts
The artifact used for architecture definition, in general, are listed Table 20.
9.2
Model Elements and Relationships
The model elements and relationships that are used in architecture definition artifacts are listed in Table 21.
TABLE 20.—ARCHITECTURE DEFINITION ARTIFACTS
Architecture definition artifacts Model artifact
System structure Package diagram, block definition diagram or architecture block definition diagram TABLE 21.—ARCHITECTURE DEFINITION MODEL ELEMENTS AND RELATIONSHIPS
Architecture definition Model element and Relationship System, subsystem, and components Block. This can be physical or logical structure elements. Relationships among the system,
subsystem and components Composition relationship. Part of a system Part property (solid diamond). Part that contributes to the system
architecture but exists independently Reference property (open diamond).
Specific use of a part Instantiation of block. This can be for specific choices, such as a model number or part option.
TABLE 22.—ARCHITECTURE DEFINITION VALIDATION
Validation question Validation method
Does the physical and logical structure decomposition go down to the correct level? Block definition diagram. Does the physical and logical structure have the right components at the right level? Block definition diagram. Does every architectural element perform a function? Matrix.
9.3
Model Validation Information
Validation is captured in many ways and at various levels of maturity. The main ways to show
compliance are described in Table 22. These questions are only a starting point and they can be performed using model-generated tables and diagrams.
9.4
More Detail
This structure is used in the allocation of requirements. It is also used in the allocation of functions to architectural elements via activity swim lanes. See Section 4.0, Concept Definition, and Section 8.0, Requirements and Allocation of Requirements to Next Lower Level.
10.0
Required Leading Indicator Trends
The required leading indicator trends are items such as mass margin, power margin, and the number of actions from reviews. For the trends that can be calculated within the model, go to Section 5.0, MOE, MOP and TPM, for more information on performing parametrics (calculation) within the model. This section will only address value properties.
10.1
Artifacts
The artifacts used for required leading indicator trends, in general, are listed in Table 23.
10.2
Model Elements and Relationships
The model elements and relationships that are used in creating required leading indicator trend artifacts are listed in Table 24.
TABLE 23.—REQUIRED LEADING INDICATOR ARTIFACTS Required leading indicator artifacts Model artifact
Product leading indicator trends Simulation results. See Section 5.0, MOE, MOP, and TPM. TABLE 24.—REQUIRED LEADING INDICATOR MODEL ELEMENTS AND RELATIONSHIPS Required leading indicator Model element and Relationship
Project Metrics Value property within a block. To show trends, an instance is created at every milestone. These are placed in an instance table to show trends.
TABLE 25.—REQUIRED LEADING INDICATOR VALIDATION
Validation question Validation method
Are the trends current and up-to-date? Check the latest instance date that was created and simulated.
10.3
Model Validation Information
Validation is captured in many ways and at various levels of maturity. The main ways to show
compliance are described in Table 25. These questions are only a starting point and they can be performed using model-generated tables and diagrams.
10.4
More Detail
Another way to get information that is not currently in the model is to use scripts to pull the
information and then populate the model from an authoritative source of truth. A set of leading indicators that might exist within a model include: mass, power profile, power margin, number of requirements, number of requirement changes, number of tbd/tbr in requirements, requirements compliance, milestone review artifacts (model related), and verification burndown status. These are leading indicators that could be populated within the model using parametrics (see Section 5.0, MOE, MOP, and TPM) or by simple scripting techniques. Other, such as review actions status, drawing percent released, number of defects, and schedule slippage would need scripting or manual entry of the information.
Table 10 shows how the mass roll-up instances can be used for trending. It is easy to follow how the mass of a system changes over time so one can predict whether there would be a risk of failing a metric.
11.0
Design Solution Definition
The design solution definition process is used to generate and evaluate alternative solutions, and select one or more for further work. This process is also known as doing trade studies. Many facets may need to be considered for a comprehensive solution. The alternative solutions artifacts are captured as options in the model, and then the base model is updated based on the decisions. A wide variety of alternative solutions are possible for mission to system to subsystem, etc., so not all of the artifacts are described. Below are just a few to give a feel for what is possible.
11.1
Artifacts
The artifacts used for design solution definition, in general, are listed in Table 26.
11.2
Model Elements and Relationships
TABLE 26.—DESIGN SOLUTION DEFINITION ARTIFACTS Design solution definition artifacts Model artifact
Scenarios of alternative solutions Use cases, activity flows. See Section 4.0, Concept Definition, as alternative solutions are different ways to accomplish a task or mission.
Effects of alternative solutions Instances, parametrics. These are used to collect information for an alternative solution, such a mass, fuel, or temperature deltas. See Section 5.0, MOP, MOE, and TPM.
Make-buy-reuse specification requirements See Section 13.0, Technical Plans.
11.3
Model Validation Information
Model validation information is covered in the sections identified in Table 26.
11.4
More Detail
Each of the sections referred to in Table 26 describes the artifacts, model elements and relationships and model validation in more detail.
12.0
Interface Definition
Interface definition describes the interfaces items at each level of the architecture, for example external interfaces at the system level, subsystems to subsystem interfaces at the next level, and continues down to the desired level. This includes both logical and physical interfaces with the associated detail.
12.1
Artifacts
The artifacts used for interface definition, in general, are listed in Table 27.
12.2
Model Elements and Relationships
The model elements and relationships that are used in creating interface definition artifacts are listed in Table 28.
12.3
Model Validation Information
Validation is captured in many ways and at various levels of maturity. The main ways to show compliance are described in Table 29.
These questions are only a starting point and they can be performed using model-generated tables and diagrams.
12.4
More Detail
The way interfaces are represented is rapidly changing due to modeling tools having more capability to handle the information associated with them. It is important to look at vendor software and identify its capabilities for identifying and validating interfaces.
TABLE 27.—INTERFACE DEFINITION ARTIFACTS Interface definition artifacts Model artifact Interface diagrams Interface block diagrams. Interface control documents Tables.
TABLE 28.—INTERFACE DEFINITION MODEL ELEMENTS AND RELATIONSHIPS Interface definition Model element and Relationship
System, subsystem, parts, component Block. The use of blocks is defined in Section 9.0, Architecture Definition, and are re-used and elaborated for interface definition.
Internal system interconnections Full ports and proxy ports. External system interconnections Full ports and proxy ports. Type of matter, data information, or
other entity flowing between interconnections
Item flows. The item flows can represent power, fluids, or something else such as mechanical load.
Units of what is flowing between
interconnections Value types such as kg, Watts, or bits per second. TABLE 29.—INTERFACE DEFINITION VALIDATION
Validation question Validation method
Are all the interfaces are identified? The model can help by producing tables and matrixes showing the relationships between elements. The use of scripts with full ports having attributes for identifying the interface can be used to validate whether the system blocks have a least one interface identified. Additional work would be needed to validate that all the interfaces are correct and that all interfaces have been identified.
Are all the interfaces typed correctly? Table showing the ports, with item flows typed. Do the interfaces have the correct units? Examine the value type for each type of port.
13.0
Technical Plans
System engineers develop many plans, including Implementation, Verification and Validation, Integration, Operational Plan and Procedure, Decommissioning and Disposal plans. Even though the plans have specific uses, the types of modeling elements utilized are mostly the same. The main
differences among them are the content. For this reason, the discussion of these plans is combined in this section. Details associated with these plans, and their functions are captured in NPR 7123.1B (Ref. 1).
13.1
Artifacts
The artifacts used for technical plans, in general, are listed in Table 30.
13.2
Model Elements and Relationships
Most of the model elements and relationships can be shown in a generic table or matrix. The desired content is selected for display. A matrix often shows relationships among different model elements. The model elements and relationships that are used in creating technical plan artifacts are listed in Table 31.
13.3
Model Validation Information
Validation is captured in many ways and at various levels of maturity. The main ways to show compliance are described in Table 32. These questions are only a starting point. The validation method for the question can be performed using model-generated tables, matrices and diagrams; the details are not captured.
TABLE 30.—TECHNICAL PLAN ARTIFACTS
Plan Artifacts Model artifact
Common to all Technical plans Plan Output from the model using information from within the model, in addition to information that supplements model-generated content.
List of detailed plans or procedures Table or package diagram. List of Personnel, skill mix and training Table or matrix.
Requirements and interfaces for
enabling systems See Section 8.0, Requirements and Allocation of Requirements to Next Lower Level, and Section 11.3, Interface Definition.
Implementation plan Implementation approach for end
product Table or matrix.
Tools and equipment, raw materials,
and specialized services list Table or matrix.
Vendor list Table or matrix.
Constraints from the strategy on the end product requirements, architecture, or design
Table with constraint blocks listed. Verification and Validation plan Verification approach for each
requirement Table or matrix.
List of analyses, tests, inspections, and
demonstrations during V&V Table or verify matrix. List of requirements to be verified with
approach Table or verify matrix.
List of stakeholder expectations to be
validated with approach Table or matrix. List of special equipment, conditions, or
procedures Table or matrix.
Integration plan List of integration area or facility, and
storage areas Table or matrix.
List of test equipment, tooling, and
recording devices Table or matrix. List of analyses, tests, inspections, and
demonstrations during integration Table or matrix. Operational plan and Procedure Operational approaches and scenarios
for nominal operations Activity diagrams, state machine diagrams. Operations approaches and scenarios for
contingency, off-nominal, and degraded operations
Activity diagrams, state machine diagrams.
List of operational states and modes Table or matrix. Decommissioning and Disposal plans Approach for end product Table or matrix.
Tools and equipment, raw materials,
and specialized services list Table or matrix. Constraints from the strategy on the end
product requirements, architecture, or design
TABLE 31.—TECHNICAL PLAN MODEL ELEMENTS AND RELATIONSHIPS
Plan Elements Model element and Relationship
Common to
all plans Plan Package or content diagram. These diagrams contains folders or package information that can be found elsewhere in the model in a single diagram. See Section 7.0, Systems Engineering Management Plan, for more details about these diagrams.
Textual content Artifact or comment. In the document world, it is the text part of the document that describes a section. When sections are needed repeated for other sections, it is better to capture the information in an artifact for easy reference. Comments and text boxes can be used, when information is used for a single diagram. The textual content can be used to generate external document if necessary.
Implementation approach for
end product Block from the design solution definition. Each block will have attributes that specify whether it is acquire new, build new, reuse without modification, or reuse with modification and any special considerations. The block multiplicity specifies how many of each are needed.
Detailed procedure Use case diagrams, activity diagrams and hyperlinked artifacts or block to an external procedure. The use case diagram depicts how an enabling system interacts with the actors to perform the procedure. The activity diagrams depicts how the procedure will flow. Many plans and procedures that are developed are kept in an outside repository and an artifact can be used as a means to hyperlink the document repository. Artifacts can have attributes associated with them such as procedural name, date, or author. However, it is easier to capture this information using a block.
Spares, tools and equipment, raw material, or specialized service
Block. The details of these can be captured in value property attributes. The blocks can have allocation relationships with activities and end products.
Vendor and Personnel Actor and block. Each vendor or person can be depicted as an actor, which can be refined by a block.
Skills and training Block, but also be used as a part property for personnel block doing product implementation
Requirement for enabling
systems See Section 8.0, Requirements and Allocation of Requirements to Next Lower Level. Interface for enabling systems See Section 12.0, Interface Definition.
Constraints Constraint blocks. These blocks are used to perform analysis such as validating that a requirement can still be met due to the implementation strategy on the end product requirements, architecture, or design. See Section 5.0, MOE, MOP and TPM.
Integration area or facility, and
storage areas Block.
Analyses, tests, inspections, and demonstrations during
integration
TestCase activity.
Operational states and modes State machines and state machine diagrams. Verification
and Validation plan
Requirements to be verified See Section 8.0, Requirements and Allocation of Requirements to Next Lower Level, and Section 12.0, Interface Definition. Each requirement has a relationship with one or more verification events. A Verify matrix shows the relationships between requirements and the verification events. Stakeholder expectations to be
validated See Section 3.0, Stakeholder Identification and Expectations Definition. Each expectation that is to be validated has a relationship with one or more validation events.
Verification approach or method
for each requirement Value property of a requirement block named VerifyMethod. The property has an enumerated value type such as VerificationMethodKind. The allowed enumerated value types are user defined, and typically are analysis, test, demonstration, inspection, roll-up, synthesis, or combinations.
Verification or validation event Activity with the stereotype <<testcase>>. Each event can be represented as a <<test case>> that is related to the requirement block through a verify relationship. The different test cases can be depicted on a requirement diagram showing the details of the test cases within a particular test procedure.
TABLE 32.—TECHNICAL PLAN VALIDATION
Plan Validation question
Common to all plans Do all plans and procedures have an owner and status?
Do all completed plans and procedures have a hyperlink to an external location or links to table and diagrams within the model?
Does each end product have an approach, plan, procedure or sequence? Does each end product have a responsible organization?
Are specialized skills, tools, and training identified?
Implementation Plan Are requirements and interfaces to enabling systems identified? Verification and Validation Plan Do all requirements have a verification approach?
Do all analyses, tests, inspections, and demonstrations have an owner? Are V&V areas, test equipment, tools, and training identified?
Does each verification indicate when it is necessary to be completed, such as prior to system integration or product transition?
Integration Plan Are integration areas, test equipment, tools, and training identified?
Are analyses, tests, inspections, and demonstrations occurring during integration identified?
Operational Plan Are contingency, off-nominal, and degraded operation scenarios addressed? Have the operational states and modes been identified?
Operational Procedure Have contingency, off-nominal, and degraded operation scenarios been developed? Decommission Plan Have decommission of product being included into the design of the mission? Disposal Plan Are specialized skills, tools, and training identified?
Are requirements and interfaces to enabling systems identified?
14.0
Verification and Validation (V&V) Results
The results from V&V include the outcomes of product verification and validation and reports providing the evidence of conformance with the requirements or expectations. V&V results also include work products such as records of procedural steps, failures or anomalies, corrective actions, and waivers.
14.1
Artifacts
The artifacts used for verification and validation results, in general, are listed in Table 33.
14.2
Model Elements and Relationships
The following model elements and relationships are often found in a verification report and can be represented by model elements and relationships as listed in Table 34.
14.3
Model Validation
Validation is captured in many ways and at various level of maturity. The main ways to show compliance are described in Table 35. These questions are only a starting point and they can be performed using model-generated tables and diagrams.
14.4
More Detail
The Expanded Guidance Document Volume 1, Section 5.3 (Ref. 2) contains additional information on performing product verification and Section 5.4 for additional information on performing product validation.
Figure 10 shows a verification requirement (Id and Name) that is similar to requirements, but has specific attributes such as verification status. The figure also shows the requirement (Requirement Id and
TABLE 33.—V&V ARTIFACTS
Verification and Validation artifacts Model artifact Verification report for each specified requirement Table or requirement diagram. Verification and validation event metrics (number complete,
number remaining) Parametric results.
Requirement metrics (number verified, number remaining) Parametric results. Expectation metrics (number validated, number remaining) Parametric results. List of results for each verification and validation event Table or matrix.
List of external reports Table or matrix with hyperlinks. List of verification events and as-performed procedures Table or matrix.
List of failures, anomalies, and corrective actions Table or matrix of events that meet this criteria. List of waivers Table or matrix of requirements that meet this criteria.
TABLE 34.—V&V MODEL ELEMENTS AND RELATIONSHIPS Verification and Validation Model element and Relationship
Requirement See Section 8.0, Requirements and Allocation of Requirements to Next Lower Level.
Requirement traceability See Section 8.0, Requirements and Allocation of Requirements to Next Lower Level.
Verification method See Section 8.0, Requirements and Allocation of Requirements to Next Lower Level, and Section 13.0, Technical Plans.
Special equipment, conditions, or procedures See Section 8.0, Requirements and Allocation of Requirements to Next Lower Level, and Section 13.0, Technical Plans.
Result or status of each verification event Output activity parameter for a Test Case, with user-defined name such as verdict. The parameter would have an enumerated value type with user-defined name such as VerdictKind that can have legal values such as Not Started, In Work, Pass, Fail, etc.
Existence of a variation, anomaly, or
out-of-compliance result Output activity parameter for a Test Case, with user-defined name such as variation, anomaly, or out-of-compliance. The parameter would have a value type of Boolean (false or true).
Variation, anomaly, or out-of-compliance result Block that has the appropriate information. The block is a reference property of the requirement block and has a hyperlink to external information.
Corrective action and result of corrective action Each action or result is represented as a block that contains attributes such as the owner. The block has a relationship to the test case and has a hyperlink to the external corrective action or result.
Verification or validation status Attribute of a requirement block. A parametric diagram can be used to calculate metrics such as adding up the total number of requirements, the number of requirements verified, and the number remaining. External Report Block that contains attributes such as report name and report owner.
The block has a relationship to the requirement block and has a hyperlink to external information.
Record of procedural steps Block that contains attributes such as as-run procedure name and owner. The block has a relationship to the test case and has a hyperlink to the completed as-run procedure.
Waiver Block that contains attributes such as the owner. TABLE 35.—V&V VALIDATION
Validation question Validation method
Does each TestCase have a status or result? Table.
Figure 10.—Verification status information diagram.
15.0
Transportation Criteria and Instructions
The criteria for transportation can be stated as the requirements for transporting a product during manufacturing, assembly, integration, test and evaluation, or delivery to the customer. Requirements for packaging, special containers, handling equipment and fixtures, storage facilities, and transportation facilities fall in this category. Sensitive or hazardous products may have additional requirements to cover safety and environmental conditions during storage and transportation.
The aspects of transportation that cover the tracking of the configuration of the product, along with the data package, are not covered here. Those are typically handled by configuration and data
management analysts.
Transportation instructions may be for procedures or other tasks associated with the handling and storage of a product.
15.1
Artifacts
The artifacts used for transportation criteria and instructions, in general, are listed in Table 36.
15.2
Model Elements and Relationships
The model elements and relationships that are used in creating transportation artifacts are listed in Table 37.
15.3
Model Validation Information
Validation is captured in many ways and at various level of maturity. The main ways to show
compliance are described in Table 38. These questions are only a starting point and they can be performed using model-generated tables and diagrams.
15.4
More Detail
See the Expanded Guidance Document Volume 1, Section 5.5, (Ref. 2) for additional information on performing transportation.