Construct Validity of the WISC – IV
UK
With a Large
Referred Irish Sample
Marley W. Watkins
Department of Educational Psychology, Baylor University, Waco, Texas, USA
Gary L. Canivez
Department of Psychology, Eastern Illinois University, Charleston, Illinois, USA
Trevor James, Kate James, and Rebecca Good
E
´ irim: The National Assessment Agency, Ltd., Dublin, Ireland
Irish educational psychologists frequently use the Wechsler Intelligence Scale for Children –
Fourth U.K. Edition (WISC – IV
UK) in clinical assessments of children with learning
difficulties. Unfortunately, reliability and validity studies of the WISC – IV
UKhave not yet
been reported. This study examined the construct validity of WISC – IV
UKcore subtest scores
obtained from evaluations to assess learning difficulties in 794 Irish children (494 boys and
300 girls). One through four first-order factor models and indirect (higher-order) versus direct
(bi-factor) hierarchical models were examined and compared using confirmatory factor
analyses. The oblique four-factor Wechsler model provided the best fit to these data, but
meaningful differences in fit statistics were not observed between this oblique four-factor
model and rival indirect hierarchical and direct hierarchical models. For theoretical reasons,
the direct (bi-factor) hierarchical model provided the best explanation of the WISC – IV
UKfactor structure. The general factor accounted for 63.7% of the common variance, whereas
first-order factors each accounted for 8.6% to 9.6% of the common variance. Thus, the results
with referred Irish children were similar to those from other investigations, further
demonstrating the replication of the Wechsler Intelligence Scale for Children – Fourth Edition
factor structure across cultures and the importance of focusing primary interpretation on the
Full Scale Intelligence Quotient.
Keywords:
Clinical assessment, cognitive assessment, intelligence, intelligence test,
measurement/statistics
Wechsler intelligence scales have enjoyed immense
popularity among educational (school) psychologists and
clinical psychologists (Alfonso, Oakland, LaRocca, &
Spanakos, 2000; Alfonso & Pratt, 1997; Belter &
Piotrowski, 2001; Goh, Teslow, & Fuller, 1981; Hutton,
Dubes, & Muir, 1992; Kaufman & Lichtenberger, 2000;
Oakland & Hu, 1992; Pfeiffer, Reddy, Kletzel, Schmelzer,
& Boyer, 2000; Stinnett, Havey, & Oehler-Stinnett, 1994;
Watkins, Campbell, Nieberding, & Hallmark, 1995).
Wechsler scales have been translated, adapted, and normed
for use in other countries with different languages and
cultures (Georgas, van de Vijver, Weiss, & Saklofske, 2003)
and some evidence of factor invariance has been reported
across cultures and between standardization and clinical
samples (Chen, Keith, Weiss, Zhu, & Li, 2010; Chen & Zhu,
2012; Weiss, Keith, Zhu, & Chen, 2013a, 2013b).
During the U.S. revision of the Wechsler Intelligence
Scale for Children – Third Edition (Wechsler, 1991), the
British version was simultaneously revised and normed for
use in the United Kingdom. The Wechsler Intelligence
Scale for Children – Fourth Edition (WISC – IV; Wechsler,
Submitted January 21, 2013; accepted April 7, 2013.
Correspondence should be addressed to Marley W. Watkins, Department of Educational Psychology, Baylor University, One Bear Place #97301, Waco, TX 76798-7301, USA. E-mail: tmarley_ [email protected]
ISSN 2168-3603 print/ISSN 2168-3611 online DOI: 10.1080/21683603.2013.794439
2003a) was a major revision that included the addition of
new subtests (Picture Concepts, Letter – Number
Sequen-cing, Matrix Reasoning, Cancellation, and Word
Reason-ing) and the deletion of others (Picture Arrangement, Object
Assembly, and Mazes). Although the Full Scale Intelligence
Quotient (FSIQ) was retained as an estimate of general
intelligence, the Verbal and Performance IQs were deleted,
and greater emphasis was placed on interpretation of factor
index scores (Verbal Comprehension [VC], Perceptual
Reasoning [PR], Working Memory [WM], and Processing
Speed [PS]; Wechsler, 2003b; Weiss, Saklofske, & Prifitera,
2005; Williams, Weiss, & Rolfhus, 2003). The WISC – IV
revision for use in the United Kingdom with U.K. norms
was published one year later as the Wechsler Intelligence
Scale for Children – Fourth U.K. Edition (WISC – IV
UK;
Wechsler, 2004).
The WISC – IV
UKAdministration and Scoring Manual
provides a brief description of the standardization project
including stratification and detailed information on
administration, scoring, and analysis of index score and
subtest score comparisons. Although raw score mean and
standard deviation comparisons between the U.K.
standard-ization sample and the U.S. standardstandard-ization sample were
provided in that manual, no further examinations of the U.K.
standardization sample were reported. The WISC – IV
Technical and Interpretive Manual
(Wechsler, 2003b)
provided with the WISC – IV
UKis the version based on the
U.S. standardization sample and supplemental validity
samples. There is no mention in the WISC – IV
Technical
and Interpretive Manual
of psychometric analyses with the
U.K. sample.
Although the WISC – IV
UKAdministration and Scoring
Manual
states, “confidence in WISC – IV
UKscore
interpret-ation is based on the extensive US standardizinterpret-ation study”
(Wechsler, 2004, p. 284), there are no reports of analyses
beyond mean and standard deviation comparisons with the
U.S. sample. Raw score means and standard deviations were
similar between the U.K. and U.S. samples (Wechsler,
2004); however, reliability estimates and standard errors of
measurement were based on the larger U.S. sample and no
validity data were presented for the U.K. sample. Searches
of the extant literature produced no studies reporting on the
psychometric features of the WISC – IV
UKwith the
standardization sample. Do other psychometric features of
the WISC – IV based on U.S. samples generalize to children
in the United Kingdom? Without extensive psychometric
examination of the reliability, validity, and diagnostic
efficiency/utility with the U.K. standardization sample
much remains unknown regarding proper interpretation of
WISC – IV
UKscores.
Examination and reporting on the internal structure of the
WISC – IV provided in the WISC – IV
Technical and
Interpretive Manual
(Wechsler, 2003b) did not include a
higher-order factor analysis to verify and describe the
implied and theoretical structure of the WISC – IV. Three
independent WISC – IV studies (Bodin, Pardini, Burns, &
Stevens, 2009; Watkins, 2006; Watkins, Wilson, Kotz,
Carbone, & Babula, 2006) examined the higher-order
structure of the WISC – IV and found that the majority of
subtest variance was associated with the higher-order
general intelligence dimension and substantially smaller
amounts of variance were related to the first-order factors.
This is a consistent finding among Wechsler scales,
specifically, as also observed with the French WISC – IV
(Golay, Reverte, Rossier, Favez, & Lecerf, 2012), the
French Wechsler Adult Intelligence Scale – Third Edition
(WAIS – III; Golay & Lecerf, 2011), and the Wechsler Adult
Intelligence Scale – Fourth Edition (WAIS – IV; Canivez &
Watkins, 2010a, 2010b), as well as intelligence tests, in
general (Canivez, 2008, 2011; Canivez, Konold, Collins, &
Wilson, 2009; Dombrowski & Watkins, 2013; Dombrowski,
Watkins, & Brogan, 2009; Nelson & Canivez, 2012, Nelson,
Canivez, Lindstrom, & Hatt, 2007).
WISC – IV content and structure reflect current
concep-tualizations of intelligence articulated by Carroll, Cattell,
and Horn (Carroll, 1993, 2003; Cattell & Horn, 1978;
Horn, 1991; Horn & Cattell, 1966) and other WISC – IV
internal structure studies have examined alternate structural
models based on the Cattell – Horn – Carroll (CHC;
McGrew, 1997, 2005) framework. Support for
CHC-based structural models of the WISC – IV has been reported
(Chen, Keith, Chen, & Chang, 2009; Keith, Fine, Taub,
Reynolds, & Kranzler, 2006; Lecerf, Rossier, Favez,
Reverte, & Coleaux, 2010; Weiss et al., 2013b), where
the basic Wechsler structure is retained for subtests and
associations with the VC (
G
c), WM (
G
sm)—except
arithmetic—and PS (
G
s); but, the PR dimension is divided
into two CHC factors where Block Design and Picture
Completion measure visual processing (
G
v) and Matrix
Reasoning and Picture Concepts measure fluid reasoning
(
G
f). However, standardized paths from
g
to
G
fwere 1.00
(Keith, 2005; Keith et al., 2006; Weiss et al., 2013b)
with the U.S. standardization sample, 0.98 (Chen et al.,
2009) with the Taiwan WISC – IV, and 1.00 (Lecerf et al.,
2010) with the French WISC – IV basic CHC model
patterned after Keith et al. (2006); but only 0.84 with the
final modified six-factor CHC model of the French WISC –
IV (Lecerf et al., 2010). This indicated that
G
fwas
isomorphic with the higher-order
g
factor and not supportive
of a CHC model. The exception was the modified six-factor
CHC model of the French WISC – IV that suggested cultural
differences (Lecerf et al., 2010). Isomorphism of
G
fwith
higher-order
g
has also been observed in studies of various
versions of the WAIS (Benson, Hulac, & Kranzler, 2010;
Golay & Lecerf, 2011; Weiss et al., 2013a), but a recent study
has suggested that isomorphism of
G
fwith higher-order
g
may be an artifact of confirmatory factor analysis (CFA)
statistical procedures (Golay et al., 2012). It is also possible
that results of Golay et al. may be unique to the French
WISC – IV.
Educational psychologists in the Republic of Ireland
frequently use the WISC– IV
UKwith the U.K. norms in
clinical evaluations but there are no separate norms for Irish
children. There are no equivalence or validity studies
examining WISC– IV performance of Irish children compared
to British or American children so, as with British children,
proper interpretation of the WISC– IV
UKscores is unknown.
To examine the construct validity of the WISC – IV
UKwith an
Irish sample, CFAs were used to test various theoretical
models to determine the best fitting models identical to those
examined by Watkins (2010). Based on results of Watkins
(2010), Golay et al. (2012), and Gignac (2005, 2006), it was
hypothesized that the direct hierarchical (bi-factor model as
originally specified by Holzinger & Swineford, 1937) model
allowing the general intelligence factor to
directly
influence
WISC– IV
UKsubtest performance would best explain the
WISC– IV
UKstructure with a sample of Irish children.
Although some have examined a number of CHC-inspired
theoretical structures, this requires all 15 WISC– IV subtests to
be administered, which most clinicians rarely do (Watkins,
2010). Because data currently available for Irish children
included only the 10 core WISC – IV
UKsubtests, CHC-based
structures could not be examined.
METHOD
Participants and Procedures
Participants were 794 Irish children from the Republic of
Ireland between the ages of 6 years, 0 months to 16 years, 9
months who were referred to an educational psychologist
for evaluation of learning difficulties. Some children were
referred for evaluation by their parents, but the vast majority
of children were referred by their schools to determine
eligibility for special education services or
accommo-dations. Participants resided in the five major cities (Cork,
Dublin, Galway, Limerick, and Waterford) in Ireland
(19%), as well as in small towns and rural areas (81%). The
largest portion of the sample were boys (
n
¼
494; 62.2%),
as is typically observed in educational evaluation referrals.
The mean age of the sample was 10.74 years (
SD
¼
2.56)
and bimodal in nature, with peaks at 8 and 12 years of age.
This represented three to four years following entry into
primary schools and entrance into post-primary school,
respectively. Unfortunately, agency practice and
confidenti-ality standards allowed no other demographic information to
be included in this archival dataset.
All WISC – IV
UKadministrations were conducted by one
of three educational psychologists according to the
standardized procedure. Only children with complete data
for all 10 core subtests were included in analyses.
Institutional review board approval was obtained but all
data were de-identified and no personal information
included.
Instrument
The WISC – IV (Wechsler, 2003a) is a test of general
intelligence and is composed of 15 subtests (
Ms
¼
10,
SDs
¼
3), 10 of which are mandatory and contribute to
measurement of four factor-based index scores: Verbal
Comprehension Index, Perceptual Reasoning Index,
Work-ing Memory Index, and ProcessWork-ing Speed Index. Each of the
four indexes is expressed as a standard score (
Ms
¼
100,
SDs
¼
15). The FSIQ is composed of 10 core subtests (three
VC, three PR, two WM, and two PS). The WISC – IV was
anglicised and adapted for the United Kingdom in 2002
through item review and minor changes in items or
language, spelling, and order of item difficulty (Wechsler,
2004). The resulting WISC – IV
UKwas standardized and
normed on a sample of 780 children between the ages of 6
years, 0 months and 16 years, 11 months who were
representative of the U.K. population stratified by
geographic region, gender, race/ethnicity, and parent
education level (Wechsler, 2004). Of the 780 children in
the standardization sample, 17 (2.2%) were from Northern
Ireland. There are no separate norms for children in Ireland
generally or the Republic of Ireland specifically. Reliability
and validity data based on the WISC – IV
UKstandardization
sample were not provided in the WISC – IV
UKmanual and
standard errors of measurement were taken from the U.S.
version of the WISC – IV.
Analyses
Mplus 7 for Macintosh (Muthe´n & Muthe´n, 2012) was used
to conduct CFAs using maximum likelihood estimation.
Consistent with previous WISC – IV structural analyses,
four first-order models and two hierarchical models were
specified and examined: (a) one factor; (b) two oblique
verbal and nonverbal factors; (c) three oblique verbal,
perceptual, and combined working memory/processing
speed factors; (d) four oblique verbal, perceptual, working
memory, and processing speed factors; (e) an indirect
hierarchical (higher-order) model (as per Bodin et al., 2009)
with four first-order factors; and (f) a direct hierarchical
(bi-factor) model (as per Watkins, 2010) with four
first-order factors. See Gignac (2008) for a detailed description
of direct and indirect hierarchical models.
Although contentious (Marsh, Hau, & Wen, 2004), Hu
and Bentler (1998, 1999) recommended a dual criterion to
guard against both Type-1 and Type-2 errors with values of
.95 for the comparative fit index (CFI)
and
.06 for the root
mean square error of approximation (RMSEA). Higher CFI
values and lower RMSEA values indicate better fit. These
two indexes were supplemented with chi-square and Akaike
information criterion (AIC) values. Nonsignificant
chi-square values tend to indicate good model fit. Smaller AIC
values indicate better fit after accounting for model
complexity. Not all models were nested, so meaningful
differences between well-fitting models were evaluated
using
D
CFI
.
þ
.01 (Cheung & Rensvold, 2002) and
D
RMSEA
. 2
.015 (Chen, 2007) as standards.
Finally, latent factor reliabilities were estimated with
coefficient omega (
v
) and omega hierarchical (
v
h) as
programmed by Watkins (2013). Omega estimated the
reliability of the latent factor that combines the general and
specific factor variance, whereas omega hierarchical (what
Reise, 2012, termed the “omega subscale”) estimated the
reliability of the latent factor with the general factor
variance removed (Brunner, Nagy, & Wilhelm, 2012).
RESULTS
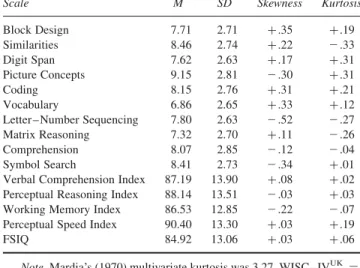
Descriptive statistics for participants’ mean WISC – IV
UKsubtest, factor index, and FSIQ scores are presented in Table 1
and illustrate univariate normality with the largest skewness
index of
2
.52 and the largest kurtosis index of
2
.33.
Mardia’s (1970) standardized multivariate kurtosis estimate
for these data was 3.27 and well under the criterion of
j
5.0
j
for
multivariate normality (Byrne, 2006). WISC– IV
UKmeans for
this sample were approximately 1
SD
lower than the normative
means and there was less variability observed among
participants. Lower subtest, factor index, and FSIQ scores in
referred samples are frequently observed (Canivez & Watkins,
1998; Watkins, 2010).
Model fit statistics presented in Table 2 illustrate the
increasingly better fit from one to four factors; however, fit
statistics indicated that the one-, two-, and three-factor
models were inadequate. The correlated four-factor (VC,
PR, WM, and PS) model provided the best fit to these data,
but meaningful differences in fit statistics (CFI and
RMSEA) were not observed between the four, first-order
factor (see Figure 1), indirect hierarchical (see Figure 2),
and direct hierarchical (see Figure 3) models. Because the
four WISC – IV
UKlatent factors were highly correlated, a
higher-order structure is implied (Gorsuch, 1988), making
the correlated four-factor model an inadequate explanation
of the factor structure. Both the direct and indirect
hierarchical models exhibited good fit according to Hu
and Bentler’s (1998, 1999) dual criteria. Neither was
statistically superior to the other, but the direct hierarchical
model offers several benefits (Brunner et al., 2012; Reise,
2012), so it was selected as the best explanation of the
WISC – IV
UKfactor structure.
Table 3 presents decomposed WISC – IV
UKsubtest
variance estimates based on the direct hierarchical model.
The general factor accounted for 63.7% of the common
variance and 36.7% of the total variance, the VC factor
accounted for 9.4% of the common variance and 5.4% of total
variance, the PR factor accounted for 8.6% of the common
variance and 5.0% of total variance, the WM factor accounted
for 8.7% of the common variance and 5.0% of the total
variance, and the PS factor accounted for 9.6% of the common
variance and 5.5% of the total variance (see Table 3). Thus, the
higher-order
g
factor accounted for substantially greater
TABLE 1
WISC – IVUKDescriptive Statistics for 794 Irish Children
Scale M SD Skewness Kurtosis
Block Design 7.71 2.71 þ.35 þ.19 Similarities 8.46 2.74 þ.22 2.33 Digit Span 7.62 2.63 þ.17 þ.31 Picture Concepts 9.15 2.81 2.30 þ.31 Coding 8.15 2.76 þ.31 þ.21 Vocabulary 6.86 2.65 þ.33 þ.12
Letter – Number Sequencing 7.80 2.63 2.52 2.27 Matrix Reasoning 7.32 2.70 þ.11 2.26
Comprehension 8.07 2.85 2.12 2.04
Symbol Search 8.41 2.73 2.34 þ.01
Verbal Comprehension Index 87.19 13.90 þ.08 þ.02 Perceptual Reasoning Index 88.14 13.51 2.03 þ.03 Working Memory Index 86.53 12.85 2.22 2.07 Perceptual Speed Index 90.40 13.30 þ.03 þ.19
FSIQ 84.92 13.06 þ.03 þ.06
Note. Mardia’s (1970) multivariate kurtosis was 3.27. WISC – IVUK ¼ Wechsler Intelligence Scale for Children – Fourth U.K. Edition; FSIQ¼ Full Scale Intelligence Quotient.
TABLE 2
Confirmatory Factor Analysis Fit Statistics for Six Structural Models of the Wechsler Intelligence Scale for Children – Fourth U.K. Edition Among 794 Irish-Referred Children
Model x2 df CFI RMSEA 90% CI AIC
One factor 437.56 35 .867 .120 .110 – .131 35,834.8
Two factors (V & NV) 303.48 34 .911 .100 .090 – .110 35,702.8
Three factors (VC, PR, & WMþPS) 186.90 32 .949 .078 .067 – .089 35,590.2
Four factors (VC, PR, WM, & PS) 62.09 29 .989 .038 .025 – .051 35,471.4
Indirect hierarchical 85.62 31 .982 .047 .035 – .059 35,490.9
Direct hierarchicala 78.14 27 .983 .049 .036 – .062 35,491.4
Note. CFI¼comparative fit index; RMSEA¼root mean square error of approximation; CI¼confidence interval; AIC¼Akaike information criterion; V¼Verbal; NV¼Nonverbal; VC¼Verbal Comprehension; PR¼Perceptual Reasoning; WM¼Working Memory; PS¼Processing Speed. In the Wechsler first-order four-factor model, correlations are between the following: VC and PR¼.81, VC and WM¼.63, VC and PS¼.49, PR and WM¼.61, PR and PS¼.63, and WM and PS¼.55.
a
portions of WISC –IV
UKcommon and total variance relative
to the factor index scores. Omega hierarchical (
v
h) coefficients
presented in Table 3 estimated the reliability of the latent
constructs with the effects of other constructs removed. In the
case of the four WISC – IV
UKfactor indexes,
v
hcoefficients
estimated the scale reliabilities with the effects of the general
factor removed and ranged from .143 (PR) to .376 (PS).
DISCUSSION
Factor analyses in this study of Irish children administered
the WISC – IV
UKin clinical evaluations provided strong
replication of previous examinations of the internal
structure of the WISC – IV (Bodin et al., 2009; Keith,
2005; Lecerf et al., 2006; Watkins, 2006, 2010; Wechsler,
2003b; Weiss et al., 2013b) with all 10 core subtests
providing measurement of a broad general intelligence
dimension and four specific first-order dimensions (VC, PR,
WM, and PS). These results are also similar to those found
with other versions of Wechsler scales (Canivez & Watkins,
2010a, 2010b; Gignac, 2005, 2006; Weiss et al., 2013a).
More specifically, these analyses supported the direct
hierarchical (bi-factor) model, as have others (Gignac, 2005,
2006; Golay & Lecerf, 2011; Watkins, 2010). By specifying
a direct hierarchical model, influences of
g
are direct to the
FIGURE 1 Correlated four-factor first-order measurement model, with standardized coefficients, for the Wechsler Intelligence Scale for Children-FourthUK
Edition (Wechsler, 2004) for 794 Irish referred children. SI¼Similarities, VO¼Vocabulary, CO¼Comprehension, BD¼Block Design, PCn¼Picture Concepts, MR¼Matrix Reasoning, DS¼Digit Span, LN¼Letter-Number Sequencing, CD¼Coding, and SS¼Symbol Search, VC¼Verbal Comprehension factor, PR¼Perceptual Reasoning factor, WM¼Working Memory factor, PS¼Processing Speed factor, g¼General Intelligence.
subtests as are influences of the four primary factors (VC,
PR, WM, and PS), rather than subtest influences of
g
being
mediated by the four specific factors prescribed in a
higher-order model. The direct hierarchical (bi-factor) model
allows
g
to be closer to the indicators (subtests) and
g
is
conceptualized more as a breadth factor, rather than a
superordinate factor (Gignac, 2008). This seems more
consistent with Spearman’s (1904, 1927) conceptualization
of general intelligence. By placing the general factor at the
same level as the specific factors the direct hierarchical
model is not really “hierarchical” as is the higher-order
model that has dominated research on the structure of
intelligence tests in the United States.
Decomposed variance estimates based on the direct
hierarchical (bi-factor) model (see Figure 3) presented in
Table 3 illustrate that the greatest portions of subtest variance
were associated with the
g
factor and smaller portions of
variance were associated with the four primary factors.
Numerous studies of Wechsler scales and other intelligence
tests have consistently found that the greatest portions of total
and common variance are apportioned to the second-order
g
dimension (or bi-factor/direct hierarchical
g
), which is
estimated by the FSIQ score, and much smaller portions of
total and common variance are apportioned to the first-order or
specific dimensions, estimated by the respective factor index
scores. This has been documented for the WISC – IV (Bodin
FIGURE 2 Indirect hierarchical measurement model, with standardized coefficients, for the Wechsler Intelligence Scale for Children-FourthUKEdition
(Wechsler, 2004) for 794 Irish referred children. SI¼Similarities, VO¼Vocabulary, CO¼Comprehension, BD¼Block Design, PCn¼Picture Concepts, MR¼Matrix Reasoning, DS¼Digit Span, LN¼Letter-Number Sequencing, CD¼Coding, and SS¼Symbol Search, VC¼Verbal Comprehension factor, PR¼Perceptual Reasoning factor, WM¼Working Memory factor, PS¼Processing Speed factor, g¼General Intelligence.
et al., 2009; Watkins, 2006; Watkins et al., 2006), French
WISC– IV (Golay et al., 2012), Stanford – Binet Intelligence
Scales– Fifth Edition (Roid, 2003; see also Canivez, 2008),
Wechsler Abbreviated Scale of Intelligence (Psychological
Corporation, 1999) and Wide Range Intelligence Test
(Glutting, Adams, & Sheslow, 2000; see also Canivez et al.,
2009), Reynolds Intellectual Assessment Scales (Reynolds &
Kamphaus, 2003; see also Dombrowski et al., 2009; Nelson &
Canivez, 2012; Nelson et al., 2007), Cognitive Assessment
System (Naglieri & Das, 1997; see also Canivez, 2011),
French WAIS – III (Golay & Lecerf, 2011), WAIS – IV
(Canivez & Watkins, 2010a, 2010b; Niileksela et al., 2012),
and the Woodcock– Johnson– Third Edition
Psychoeduca-tional Battery (Woodcock, McGrew, & Mather, 2001; see also
Dombrowski & Watkins, 2013). The implication of these
consistent findings is that the overall, omnibus FSIQ score
should retain primary interpretive weight, rather than the
first-order, specific, factor-based index scores.
Examination of reliability of the latent constructs
indicated that the broad
g
factor had strong estimates
allowing individual interpretation (
v
¼
.904,
v
h¼
.802),
but the
v
hestimates for the four WISC – IV
UKnarrow
specific factors were very low (.143 – .376) and extremely
limited for measuring unique constructs (Brunner et al.,
2012; Reise, 2012) and not high enough for individual
interpretation. For comparison purposes, standardized path
SI VO CO BD PCn MR DS LN CD SS PR PS g WM VC 0.41 0.48 0.39 0.15 0.07 0.68 0.50 0.50 0.52 0.53 0.73 0.76 0.65 0.65 0.65 0.56 0.39 0.50 0.46 0.60
FIGURE 3 Direct hierarchical measurement model, with standardized coefficients, for the Wechsler Intelligence Scale for Children-FourthUKEdition (Wechsler, 2004) for 794 Irish referred children. SI¼Similarities, VO¼Vocabulary, CO¼Comprehension, BD¼Block Design, PCn¼Picture Concepts, MR¼Matrix Reasoning, DS¼Digit Span, LN¼Letter-Number Sequencing, CD¼Coding, and SS¼Symbol Search, VC¼Verbal Comprehension factor, PR¼Perceptual Reasoning factor, WM¼Working Memory factor, PS¼Processing Speed factor, g¼General Intelligence.
coefficients from Watkins (2010) were used to calculate
omega hierarchical and present results were quite similar. The
v
hestimates for the four WISC– IV narrow specific factors
from Watkins (2010) were also very low (.112– .388). Canivez
(in press) also reported very low
v
hcoefficients for the four
WISC– IV specific factors (.098 –.330) in a sample of referred
children demographically similar to Watkins (2010). In
contrast to cross-battery (Flanagan, Alfonso, & Ortiz, 2012)
and clinical (Weiss et al., 2005) interpretation approaches,
these results further support primary interpretation of the FSIQ
for the WISC– IV
UK.
Limitations
Limitations of this study are primarily that of a restricted and
nonrandom clinical sample of Irish students referred for
evaluations of educational difficulties. Generalization to other
populations is not recommended, despite the identical or
similar results obtained with normative samples or large
referred samples outside of Ireland. As no psychometric studies
of the WISC –IV
UKwith British (normative or clinical) or Irish
samples are presently available, it is impossible to know how
the structure based on this sample compares to the British
normative sample or to a normative Irish sample. Clearly there
is great need for publication of such critical psychometric
information for the WISC –IV
UKnormative sample.
CONCLUSION
Based on these results and strong replication of previous
findings it seems prudent to focus WISC – IV
UKinterpret-ation at the FSIQ level and if going beyond the FSIQ to
interpret factor index scores with extreme caution so as not
to misinterpret or over-interpret scores given the small
unique variance provided by the factor index scores. This
conclusion is consistent with an extensive analysis of
alternative methods of interpretation of intelligence tests,
which recommended that “clinicians should restrain their
clinical interpretations to the FSIQ score in most, if not all,
instances” (Canivez, 2013, p. 96). Nevertheless, the WISC –
IV
UKstructure should be examined in relation to external
variables or criteria such as academic achievement to
determine what, if any, reliable achievement variance is
incrementally accounted for by the WISC – IV
UKfactor
index scores beyond that accounted for by the FSIQ, as well
as diagnostic utility studies.
ACKNOWLEDGEMENTS
This research was partially supported by a 2012 Summer Research
Grant to Gary L. Canivez from the Council on Faculty Research,
Eastern Illinois University. Preliminary analyses were presented at
the 2012 annual convention of the American Psychological
Association and the 8th conference of the International Test
Commission.
ABOUT THE AUTHORS
Marley W. Watkins is Professor and Chairman of the Department
of Educational Psychology at Baylor University in Waco, TX. His
research interests include the study of individual differences.
Gary L. Canivez is Professor of Psychology at Eastern Illinois
University principally involved in training school psychologists.
Trevor James, psychologist at E
´ irim: The National Assessment
Agency, who offers individual psycho-educational assessment and
training in educational assessment in Ireland.
TABLE 3
Sources of Variance in the Wechsler Intelligence Scale for Children – Fourth U.K. Edition Irish Sample According to a Direct Hierarchical Model
General VC PR WM PS
Subtest b Var b Var b Var b Var b Var h2 u2
Similarities .725 .526 .411 .169 .695 .305 Vocabulary .763 .582 .477 .228 .810 .190 Comprehension .648 .420 .385 .148 .568 .432 Block Design .654 .428 .152 .023 .451 .549 Picture Concepts .604 .365 .071 .005 .370 .630 Matrix Reasoning .652 .425 .684 .468 .893 .107 Digit Span .459 .211 .501 .251 .462 .538
Letter – Number Sequencing .563 .317 .500 .250 .567 .433
Coding .389 .151 .523 .274 .425 .575 Symbol Search .500 .250 .528 .279 .529 .471 Total variance (%) 36.7 5.4 5.0 5.0 5.5 57.7 42.3 Common variance (%) 63.7 9.4 8.6 8.7 9.6 100.0 – v .904 .870 .777 .678 .644 – – vh .802 .228 .143 .332 .376 – –
Note.N¼794. b ¼ standardized loading of subtest on factor; Var¼variance explained in the subtest;h2 ¼ communality;u2 ¼uniqueness; VC¼Verbal Comprehension; PR¼Perceptual Reasoning; WM¼Working Memory; PS¼Processing Speed;v ¼omega;vh ¼ omega hierarchical.
Kate James, psychologist at E
´ irim: The National Assessment
Agency, who offers individual psycho-educational assessment and
training in educational assessment in Ireland.
Rebecca Good, psychologist at E
´ irim: The National Assessment
Agency, who offers individual psycho-educational assessment and
training in educational assessment in Ireland.
REFERENCES
Alfonso, V. C., Oakland, T. D., LaRocca, R., & Spanakos, A. (2000). The course on individual cognitive assessment. School Psychology Review,29, 52 – 64.
Alfonso, V. C., & Pratt, S. I. (1997). Issues and suggestions for training professionals in assessing intelligence. In D. P. Flanagan, J. L. Genshaft & P. L. Harrison (Eds.), Contemporary intellectual assessment: Theories, tests, and issues(pp. 326 – 347). New York, NY: Guilford. Belter, R. W., & Piotrowski, C. (2001). Current status of doctoral-level
training in psychological testing.Journal of Clinical Psychology,57, 717 – 726.
Benson, N., Hulac, D. M., & Kranzler, J. H. (2010). Independent examination of the Wechsler Adult Intelligence Scale – Fourth Edition (WAIS – IV): What does the WAIS – IV measure? Psychological Assessment,22, 121 – 130.
Bodin, D., Pardini, D. A., Burns, T. G., & Stevens, A. B. (2009). Higher order factor structure of the WISC – IV in a clinical neuropsychological sample.Child Neuropsychology,15, 417 – 424.
Brunner, M., Nagy, G., & Wilhelm, O. (2012). A tutorial on hierarchically structured constructs.Journal of Personality,80, 796 – 846, doi:10.1111/ j.1467-6494.2011.00749.x
Byrne, B. M. (2006).Structural equation modeling with EQS(2nd ed.). Mahwah, NJ: Erlbaum.
Canivez, G. L. (2008). Hierarchical factor structure of the Stanford– Binet Intelligence Scales – Fifth Edition. School Psychology Quarterly, 23, 533 – 541.
Canivez, G. L. (2011). Hierarchical factor structure of the Cognitive Assessment System: Variance partitions from the Schmid – Leiman (1957) procedure. School Psychology Quarterly, 26, 305 – 317, doi:10.1037/a0025973
Canivez, G. L. (in press). Construct validity of the WISC – IV with a referred sample: Direct versus indirect hierarchical structures. School Psychology Quarterly.
Canivez, G. L. (2013). Psychometric versus actuarial interpretation of intelligence and related aptitude batteries. In D. H. Saklofske, C. R. Reynolds & V. L. Schwean (Eds.), The Oxford handbook of child psychological assessment (pp. 84 – 112). New York, NY: Oxford University Press.
Canivez, G. L., Konold, T. R., Collins, J. M., & Wilson, G. (2009). Construct validity of the Wechsler Abbreviated Scale of Intelligence and Wide Range Intelligence Test: Convergent and structural validity.School Psychology Quarterly,24, 252 – 265.
Canivez, G. L., & Watkins, M. W. (1998). Long term stability of the Wechsler Intelligence Scale for Children – Third Edition.Psychological Assessment,10, 285 – 291.
Canivez, G. L., & Watkins, M. W. (2010a). Exploratory and higher-order factor analyses of the Wechsler Adult Intelligence Scale – Fourth Edition (WAIS – IV) adolescent subsample. School Psychology Quarterly,25, 223 – 235, doi:10.1037/a0022046
Canivez, G. L., & Watkins, M. W. (2010b). Investigation of the factor structure of the Wechsler Adult Intelligence Scale – Fourth Edition (WAIS – IV): Exploratory and higher order factor analyses. Psychologi-cal Assessment,22, 827 – 836, doi:10.1037/a0020429
Carroll, J. B. (1993). Human cognitive abilities. Cambridge, England: Cambridge University Press.
Carroll, J. B. (2003). The higher-stratum structure of cognitive abilities: Current evidence supports g and about ten broad factors. In H. Nyborg (Ed.), The scientific study of general intelligence: Tribute to Arthur R. Jensen(pp. 5 – 21). New York, NY: Pergamon.
Cattell, R. B., & Horn, J. L. (1978). A check on the theory of fluid and crystallized intelligence with description of new subtest designs.Journal of Educational Measurement,15, 139 – 164.
Chen, F. F. (2007). Sensitivity of goodness of fit indexes to lack of measurement invariance.Structural Equation Modeling,14, 464 – 504. Chen, H., Keith, T. Z., Chen, Y. -H., & Chang, B. -S. (2009). What does the
WISC– IV measure? Validation of the scoring and CHC-based interpretive approaches.Journal of Research in Education Sciences,54, 85 – 108. Chen, H., Keith, T., Weiss, L., Zhu, J., & Li, Y. (2010). Testing for
multigroup invariance of second-order WISC – IV structure across China, Hong Kong, Macau, and Taiwan.Personality and Individual Differences, 49, 677 – 682, doi:10.1016/j.paid.2011.10.006
Chen, H., & Zhu, J. (2012). Measurement invariance of WISC – IV across normative and clinical samples.Personality and Individual Differences, 52, 161 – 166, doi:10.1016/j.paid.2011.10.006
Cheung, G. W., & Rensvold, R. B. (2002). Evaluating goodness-of-fit indexes for testing measurement invariance. Structural Equation Modeling,9, 233 – 255.
Dombrowski, S. C., & Watkins, M. W. (2013, January 28). Exploratory and higher order factor analysis of the WJ – III full test battery: A school aged analysis. Psychological Assessment, Advance online publication. doi:10.1037/a0031335
Dombrowski, S. C., Watkins, M. W., & Brogan, M. J. (2009). An exploratory investigation of the factor structure of the Reynolds Intellectual Assessment Scales (RIAS).Journal of Psychoeducational Assessment,27, 494 – 507, doi:10.1177/0734282909333179
Flanagan, D. P., Alfonso, V. C., & Ortiz, S. O. (2012). The cross-battery assessment approach: An overview, historical perspective, and current directions. In D. P. Flanagan & P. L. Harrison (Eds.),Contemporary intellectual assessment: Theories, tests, and issues (3rd ed., pp. 459 – 483). New York, NY: Guilford.
Georgas, J., van de Vijver, F. J. R., Weiss, L. G., & Saklofske, D. H. (2003). A cross-cultural analysis of the WISC– III. In J. Georgas, L. G. Weiss & F. J. R. van de Vijver (Eds.),Culture and children’s intelligence: Cross-cultural analysis of the WISC– III(pp. 277 – 313). San Diego, CA: Academic. Gignac, G. E. (2005). Revisiting the factor structure of the WAIS – R:
Insights through nested factor modeling. Assessment, 12, 320 – 329, doi:10.1177/1073191105278118
Gignac, G. E. (2006). The WAIS – III as a nested factors model: A useful alternative to the more conventional oblique and higher-order models. Journal of Individual Differences, 27, 73 – 86, doi:10.1027/1614-0001.27.2.73
Gignac, G. E. (2008). Higher-order models versus direct hierarchical models: g as superordinate or breadth factor? Psychology Science Quarterly,50, 21 – 43.
Glutting, J. J., Adams, W., & Sheslow, D. (2000).Wide Range Intelligence Test: Manual. Wilmington, DE: Wide Range, Inc.
Goh, D. S., Teslow, C. J., & Fuller, G. B. (1981). The practice of psychological assessment among school psychologists. Professional Psychology,12, 696 – 706.
Golay, P., & Lecerf, T. (2011). Orthogonal higher order structure and confirmatory factor analysis of the French Wechsler Adult Intelligence Scale (WAIS – III). Psychological Assessment, 23, 143 – 152, doi:10.1037/a0021230
Golay, P., Reverte, I., Rossier, J., Favez, N., & Lecerf, T. (2012, November 12). Further insights on the French WISC – IV factor structure through Bayesian structural equation modeling (BSEM).Psychological Assess-ment, Advance online publication. doi:10.1037/a0030676
Gorsuch, R. L. (1988). Exploratory factor analysis. In J. R. Nesselroade & R. B. Cattell (Eds.),Handbook of multivariate experimental psychology (2nd ed., pp. 231 – 258). New York, NY: Plenum.
Holzinger, K. J., & Swineford, F. (1937). The bi-factor method. Psychometrika,2, 41 – 54.
Horn, J. L. (1991). Measurement of intellectual capabilities: A review of theory. In K. S. McGrew, J. K. Werder & R. W. Woodcock (Eds.), Woodcock – Johnson technical manual(Rev. ed., pp. 197 – 232). Itasca, IL: Riverside.
Horn, J. L., & Cattell, R. B. (1966). Refinement and test of the theory of fluid and crystallized general intelligence. Journal of Educational Psychology,57, 253 – 270.
Hu, L. -T., & Bentler, P. M. (1998). Fit indices in covariance structure modeling: Sensitivity to under parameterized model misspecification. Psychological Methods,3, 424 – 453.
Hu, L. -T., & Bentler, P. M. (1999). Cutoff criteria for fit indexes in covariance structure analysis: Conventional criteria versus new alternatives.Structural Equation Modeling: A Multidisciplinary Journal,5, 1 – 55.
Hutton, J. B., Dubes, R., & Muir, S. (1992). Assessment practices of school psychologists: Ten years later.School Psychology Review,21, 271 – 284. Kaufman, A. S., & Lichtenberger, E. O. (2000).Essentials of WISC – III and
WPPSI – R assessment. New York, NY: Wiley.
Keith, T. Z. (2005). Using confirmatory factor analysis to aid in understanding the constructs measured by intelligence tests. In D. P. Flanagan & P. L. Harrison (Eds.),Contemporary intellectual assessment: Theories, tests, and issues (2nd ed., pp. 581 – 614). New York, NY: Guilford.
Keith, T. Z., Fine, J. G., Taub, G. E., Reynolds, M. R., & Kranzler, J. H. (2006). Higher-order, multi-sample, confirmatory factor analysis of the Wechsler Intelligence Scale for Children – Fourth Edition: What does it measure.School Psychology Review,35, 108 – 127.
Lecerf, T., Rossier, J., Favez, N., Reverte, I., & Coleaux, L. (2010). The four- vs. alternative six-factor structure of the French WISC – IV.Swiss Journal of Psychology,69, 221 – 232, doi:10.1024/1421-0185/a000026 Mardia, K. V. (1970). Measures of multivariate skewness and kurtosis with
applications.Biometrika,57, 519 – 530.
Marsh, H. W., Hau, K. -T., & Wen, Z. (2004). In search of golden rules: Comment on hypothesis-testing approaches to setting cutoff values for fit indexes and dangers in overgeneralizing Hu and Bentler’s (1999) findings.Structural Equation Modeling,11, 320 – 341.
McGrew, K. S. (1997). Analysis of the major intelligence batteries according to a proposed comprehensive Gf –Gc framework. In D. P.
Flanagan, J. L. Genshaft & P. L. Harrison (Eds.), Contemporary intellectual assessment: Theories, tests, and issues (pp. 151 – 179). New York, NY: Guilford.
McGrew, K. S. (2005). The Cattell – Horn – Carroll theory of cognitive abilities: Past, present, and future. In D. P. Flanagan & P. L. Harrison (Eds.),Contemporary intellectual assessment: Theories, tests, and issues (2nd ed., pp. 136 – 181). New York, NY: Guilford.
McGrew, K. S., & Woodcock, R. W. (2001). Technical manual. Woodcock – Johnson III. Itasca, IL: Riverside.
Muthe´n, L. K., & Muthe´n, B. O. (2012).Mplus user’s guide(7th ed.). Los Angeles, CA: Author.
Naglieri, J. A., & Das, J. P. (1997). Cognitive Assessment System: Interpretive handbook. Itasca, IL: Riverside.
Nelson, J. M., & Canivez, G. L. (2012). Examination of the structural, convergent, and incremental validity of the Reynolds Intellectual Assessment Scales (RIAS) with a clinical sample. Psychological Assessment,24, 129 – 140, doi:10.1037/a0024878
Nelson, J. M., Canivez, G. L., Lindstrom, W., & Hatt, C. (2007). Higher-order exploratory factor analysis of the Reynolds Intellectual Assessment Scales with a referred sample. Journal of School Psychology, 45, 439 – 456, doi:10.1016/j.jsp.2007.03.003
Niileksela, C. R., Reynolds, M. R., & Kaufman, A. S. (2012, December 17). An alternative Cattell – Horn – Carroll (CHC) factor structure of the WAIS – IV: Age invariance of an alternative model for ages 70 – 90. Psychological Assessment, Advance online publication. doi:10.1037/ a0031175
Oakland, T., & Hu, S. (1992). The top ten tests used with children and youth worldwide.Bulletin of the International Test Commission, 19, 99 – 120.
Pfeiffer, S. I., Reddy, L. A., Kletzel, J. E., Schmelzer, E. R., & Boyer, L. M. (2000). The practitioner’s view of IQ testing and profile analysis.School Psychology Quarterly,15, 376 – 385.
Prifitera, A., Saklofske, D. H., & Weiss, L. G. (2008).WISC – IV clinical use and interpretation: Scientist – practitioner perspectives(2nd ed.). San Diego, CA: Academic.
Psychological Corporation. (1999). Wechsler Abbreviated Scale of Intelligence. San Antonio, TX: Author.
Reise, S. P. (2012). The rediscovery of bifactor measurement models. Multivariate Behavioral Research, 47, 667 – 696, doi:10.1080/ 00273171.2012.715555
Reynolds, C. R., & Kamphaus, R. W. (2003). Reynolds Intellectual Assessment Scales. Lutz, FL: Psychological Assessment Resources. Roid, G. (2003).Stanford – Binet Intelligence Scales: Fifth Edition. Itasca,
IL: Riverside.
Spearman, C. (1904). “General intelligence”: Objectively determined and measured.American Journal of Psychology,15, 201 – 293.
Spearman, C. (1927).The abilities of man. New York, NY: Cambridge University Press.
Stinnett, T. A., Havey, J. M., & Oehler-Stinnett, J. (1994). Current test usage by practicing school psychologists: A national survey.Journal of Psychoeducational Assessment,12, 331 – 350.
Watkins, C. E. Jr, Campbell, V. L., Nieberding, R., & Hallmark, R. (1995). Contemporary practice of psychological assessment by clinical psychologists. Professional Psychology: Research and Practice, 26, 54 – 60.
Watkins, M. W. (2006). Orthogonal higher order structure of the Wechsler Intelligence Scale for Children – Fourth Edition.Psychological Assess-ment,18, 123 – 125, doi:10.1037/1040-3590.18.1.123
Watkins, M. W. (2010). Structure of the Wechsler Intelligence Scale for Children – Fourth Edition among a national sample of referred students. Psychological Assessment,22, 782 – 787, doi:10.1037/a0020043 Watkins, M. W. (2013).Omega[Computer software]. Phoenix, AZ: Ed &
Psych Associates.
Watkins, M. W., Wilson, S. M., Kotz, K. M., Carbone, M. C., & Babula, T. (2006). Factor structure of the Wechsler Intelligence Scale for Children – Fourth Edition among referred students.Educational and Psychological Measurement,66, 975 – 983, doi:10.1177/0013164406288168
Wechsler, D. (1991). Manual for the Wechsler Intelligence Scale for Children – Third Edition. San Antonio, TX: Psychological Corporation. Wechsler, D. (2003a).Wechsler Intelligence Scale for Children—Fourth
Edition. San Antonio, TX: Psychological Corporation.
Wechsler, D. (2003b).Wechsler Intelligence Scale for Children—Fourth Edition: Technical and interpretive manual. San Antonio, TX: Psychological Corporation.
Wechsler, D. (2004).Wechsler Intelligence Scale for Children—Fourth UK Edition. London, England: Harcourt Assessment.
Weiss, L. G., Keith, T. Z., Zhu, J., & Chen, H. (2013a). WAIS – IV and clinical validation of the four- and five-factor interpretative approaches. Journal of Psychoeducational Assessment,3, 94 – 113.
Weiss, L. G., Keith, T. Z., Zhu, J., & Chen, H. (2013b). WISC – IV and clinical validation of the four- and five-factor interpretative approaches. Journal of Psychoeducational Assessment,3, 114 – 131.
Weiss, L. G., Saklofske, D. H., & Prifitera, A. (2005). Interpreting the WISC – IV index scores. In A. Prifitera, D. H. Saklofske & L. G. Weiss (Eds.),WISC – IV clinical use and interpretation: Scientist – practitioner perspectives(pp. 71 – 100). New York, NY: Elsevier/Academic. Williams, P. E., Weiss, L. G., & Rolfhus, E. L. (2003).Clinical validity
(WISC – IV Tech. Rep. No. 3). San Antonio, TX: Psychological Corporation.
Woodcock, R. W., McGrew, K. S., & Mather, N. (2001). Woodcock – Johnson III Psychoeducational Battery. Itasca, IL: Riverside.