Volume 12 Volume 12, 2007 Article 9 2007
Content and Grade Trends in State Assessments and NAEP
Content and Grade Trends in State Assessments and NAEP
William D. Schafer Min Liu
Hsiu-fei (Joyce) Wang
Follow this and additional works at: https://scholarworks.umass.edu/pare
Recommended Citation Recommended Citation
Schafer, William D.; Liu, Min; and Wang, Hsiu-fei (Joyce) (2007) "Content and Grade Trends in State Assessments and NAEP," Practical Assessment, Research, and Evaluation: Vol. 12 , Article 9. DOI: https://doi.org/10.7275/r3hd-2166
Available at: https://scholarworks.umass.edu/pare/vol12/iss1/9
This Article is brought to you for free and open access by ScholarWorks@UMass Amherst. It has been accepted for inclusion in Practical Assessment, Research, and Evaluation by an authorized editor of ScholarWorks@UMass Amherst. For more information, please contact scholarworks@library.umass.edu.
A peer-reviewed electronic journal.
Copyright is retained by the first or sole author, who grants right of first publication to the Practical Assessment,
Research & Evaluation. Permission is granted to distribute this article for nonprofit, educational purposes if it is
copied in its entirety and the journal is credited.
Volume 12, Number 9, August 2007
ISSN 1531-7714Content and Grade Trends in State Assessments and NAEP
William D. Schafer, Min Liu, & Hsiu-fei (Joyce) Wang
University of Maryland
Each state is required by the No Child Left Behind Act to report the percents of its students who have reached a score level called “proficient” or above for certain grades in the content areas of reading (or a similar construct) and math. Using 2005 data from public web sites of states and the National Assessment of Educational Progress (NAEP), state-to-state differences in percents were analyzed, both unconditionally and conditionally on NAEP, for (1) trend across content areas (horizontal moderation), (2) trend across grade levels (vertical moderation), and (3) consistency with NAEP. While there was considerable variation from state to state, especially on an idealistic-realistic dimension, the results generally show that states are relatively consistent in trends across grades and contents.
Several studies have addressed the (in)consistencies from state to state in the achievement levels established for the No Child Left Behind (NCLB)-mandated label of “proficiency.” McLaughlin & Mello (2002) compared state results with those from National Assessment of Educational Progress (NAEP), Later, McLaughlin (2005) located states’ primary-level “proficiency” standards for reading on the NAEP scale, Linn (2005a) presented graphical analyses showing state percents proficient for mathematics against NAEP results for 33 states, and Fuller, Gesicki, Kang, & Wright (2006) tracked state and NAEP percents proficient over time in 12 states. Recently, the National Center for Education Statistics has released a report that compares, with each other and with NAEP cut scores, for each state the NAEP-scale cut score corresponding on the state’s NAEP distribution to the state percent proficient in fourth and eighth grades on reading and math (NCES, 2007).
Our initial goal was to collect for as many states as possible for the then-latest-available year (2005), percent proficient or better data in both reading (or English language arts) and mathematics and to present the results in graphic form. Those presentations might be used by
with common referents. They may also be used by researchers who are interested in comparing states with differing degrees of expectations for their students’ achievement in order to satisfy NCLB’s requirements, on outcomes such as indicators of instructional change.
We also were interested in ways to index and compare features of state data across states, grades, and contents. These include such characteristics as equivalence across contents (reading and math), degrees of idealism (low percents proficient) vs. realism (high percents proficient) of the state proficiency standards, and slopes of trend lines.
BACKGROUND
The No Child Left behind (NCLB) Act required that all states develop an annual educational assessment and accountability system in mathematics and reading/language arts in each of grades 3 through 8 and at least once in grade 10 through 12 by 2005-2006. NCLB also required states to set challenging academic content standards and student academic achievement standards (i.e. performance standards) for their statewide
nitor process toward the proficient
t level or above by 2013-2014 as required by NC
o compare achievement results state by state, dire
” (Shepard, Glaser, Linn, & Boh
clusive, and our ana
8 and 12) assessed by NAEP: Basic, Proficient, and least three performance levels for their assessments: the first two, proficient and advanced are to correspond to high levels of achievement while the third level, basic, can provide a way to mo
level (Linn, 2005b).
Based on state-defined performance standards, all schools and districts are to be reviewed annually in terms of the percentages of students who achieve the proficient level or above and the results compared with the previous year. There are sanctions for schools that do not meet adequate yearly progress (AYP) targets for two or more years in a row. The AYP is set to assure that schools, districts and states will have 100% of the students at the proficien
LB.
It is financially quite important for states to set appropriate performance standards and cut scores across grades for their statewide assessments, but accepted guidance on how to do that is lacking. It is not surprising to find that the state performance standards have a great state-to-state variability (Linn, 2005a). It is clearly not sensible t
ctly.
Thus, if we want to compare the performance standards of different statewide assessments, we need to find a common assessment related to them (McLaughlin & Mello, 2002). NAEP has been described as a “gold standard” for monitoring the educational progress of American students (Jones, Olkin, & American Educational Research Association., 2004) and it is “the only national assessment of achievement based on defensible samples
rnstedt, 1993).
One of the fundamental goals for NAEP is that it could provide consistent information about student achievement. McLaughlin and Mello (2002) have compared math achievement results in different states by estimating the NAEP scale scores that correspond to state performance standards. But the state-level data in their analyses came from a sample of school-level state assessment scores. In our research, all of our state assessment data came directly from each state’s department of education, which is more in
lyses include reading as well as math.
There are three achievement levels for three grades (4,
Advanced; a fourth, Below Basic, is a default for students performing below the first cutpoint. However, Pellegrino, Jones, and Mitchell (1999) have concluded that “collection of meaningful NAEP data in the twelfth grade is problematic given the insufficient motivation of high school seniors and their highly variable curricula and dropout rates,” and the National Research Council (NRC) committee recommended that the NAEP should assess students in grades 10 or 11 instead of 12 (Pellegrino, Jones, & Mitchell, 1999). Further, NAEP does not have state-representative data for grade 12 and few states have grade 12 data. Therefore, we only used NAEP data for grade 4 and 8, ignoring grade 12.
Of the three achievement levels reported by NAEP, any of them may be comparable to the term “proficient” as used in NCLB. Although the term “proficient” is used in NCLB and one might conclude that the intent of the Act was to convey a comparable degree of expectation for states, Mosquin and Chromy (2004) found state results most comparable with the NAEP Basic achievement level. In its report of the 2003 reading data, NCES (2003) focused attention on the NAEP Proficient achievement level. However, in a later, similar report, NCES (2005) focused attention on the NAEP Basic achievement level. An extensive review of these and other perspectives in the literature may be found in Stoneberg (2007). We do not wish to enter this argument, so our comparisons used both NAEP Proficient and NAEP Basic as benchmarks for states.
METHOD
State assessment results for 2005 were compared graphically with NAEP (actual and extrapolated) across grades using a format adapted from Schafer (2005). All the NAEP data came from NAEP’s “data explorer” webpage,
http://nces.ed.gov/nationsreportcard/nde/criteria.asp , while state performance data were from the website of each state’s department of education. A list of the links we used is in the appendix. All of these data are from 2005. We produced graphs for reading and math separately for each state.
The graphs for Maryland are shown as a typical example.
Maryland: Reading (2005)
0 10 20 30 40 50 60 70 80 90 100 3 4 5 6 7 8 9 10 Grade Pe rc e n tState Proficient and Above
NAEP Basic and Above
NAEP Proficient and Above
Linear (NAEP Basic and Above) Linear (NAEP Proficient and Ab )
Maryland: Math (2005)
0 10 20 30 40 50 60 70 80 90 100 3 4 5 6 7 8 9 10 Grade P er cen tState Proficient and Above
NAEP Basic and Above
NAEP Proficient and Above
Linear (NAEP Basic and Above) Linear (NAEP Proficient and Ab )
Data source: http://msp.msde.state.md.us/downloadindex.aspx?K=99AAAA
The data came from the Maryland School Assessment (MSA), which is a test of reading and math achievement that meets the requirements of the federal No Child Left Behind Act. The test is given each year in early March at grades 3 through 8. For MSA, there are three achievement levels: Advanced, Proficient, and Basic.
The first line labeled as “State Proficient and Above” was generated by a set of plots which represent Maryland’s percentages of students who are proficient or above at each grade evaluated by the state assessments. During data collection, we found it common that we could not get state data for every grade, i.e., from grade 3 through grade 10, and therefore we interpolated or extrapolated plot points for those missing values using a linear relation between the students’ performance percentage and grade level. Here, for the “State Proficient
Above” line of Maryland Math, two plot points, grade 9 and 10, were found by extrapolation. The second line labeled as “NAEP Basic and Above” represents the percentage for students who are at the basic or above level in Maryland at each grade evaluated by NAEP. Similarly, the third line shows NAEP’s percentage for Maryland’s students who are proficient or above at each grade. Since we could use only NAEP data for grade 4 and grade 8 (the only tested grades in our range), we connected and extended these two plot points to get trend lines, which help to show the difference between state assessment and NAEP assessment. (The last two labels in the legend are for these NAEP trend lines). We can read all the state graphs in a similar way.
Data were available for 43 of the 50 states. Although Nebraska’s results were aggregates of district-level tests
did not provide sufficient information to include them in the study. Each figure is numbered by state and further described using the state two-character acronym along with the content, reading (r) or math (m). The complete presentation of the 43 pairs of figures is beyond the scope of this manuscript. However, they are available electronically in Schafer, Liu, & Wang (2007).
RESULTS
Three features of each state graph seem particularly interesting: (1) the nature of the state’s “proficient” line (vertical moderation), (2) how the state’s “proficient” line compares across contents (horizontal moderation), and (3) consistency between the state’s proficient line and NAEP (basic or proficient). The data in the various state graphs were analyzed for these features and the results were graphically compared across states.
A. Horizontal and Vertical Moderation
It is common to refer to states with high standards (cut scores) and correspondingly low percents above these standards as having “rigorous” standards. By implication, states with high percents above standards would be thought to lack rigor, a seemingly pejorative conclusion. We do not wish to imply that either high or low cut scores are more desirable and therefore have chosen to use the term “idealistic” to describe states with relatively low percents above cuts and as “realistic” those with relatively high percents above cuts; both terms have some positive and some negative connotations.
Lissitz & Huynh (2003) introduced the term “vertical moderation” to refer to the nature and constancy of trend in percents proficient for a state’s proficiency standards across grade levels. They suggested that these impacts should show a reasonable trend across grades. Schafer (2005) extended the concept to “horizontal moderation,” which represents the degree of consistency in idealism vs. realism across content areas. He suggested that a state with cut scores that do not show both horizontal moderation (across contents) and vertical consistency (across grade levels) will identify schools for intervention asymmetrically on either of these dimensions. Such a state might channel remediation resources unreasonably toward one content vs. another or toward schools with certain grade levels vs. others.
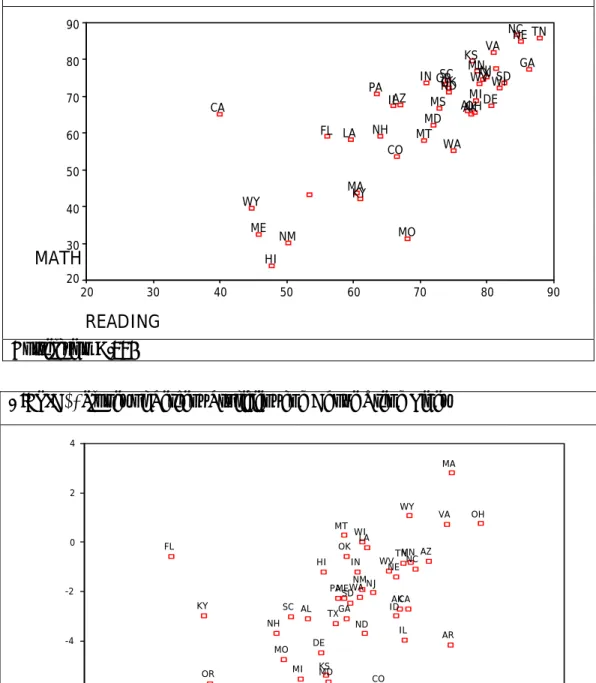
In order to study vertical and horizontal moderation, we estimated the regression line for each content, regressing percent proficient and above on grade level. The slope and sixth-grade intercept of each state proficient trend line are summarized in Figures 1 and 2.
The sixth-grade intercept can represent a typical status (at grade 6) of the state student performance trend across grade 3 to grade 10. From Figure 1, it is clear that states vary greatly on the typical percentage of “state proficient and above” line. For example, NC, NE and TN are over 80% in both reading and math while HI is lower than 30% in math. We can also infer that the typical statuses of the trend lines are consistent (near the diagonal) across contents, implying horizontal moderation for reading and math. That is, states with higher typical values of trend line for reading tend also to have higher values for math. The Pearson correlation coefficient (r=.784, p<.01) between reading and math documents this consistency. Nevertheless, there are discrepancies indicative of lack of horizontal moderation; several states, such as CA and MO, are far from the diagonal line that would indicate consistency in percents proficient and above across contents. In CA, for example, it appears that schools could be characterized as in need of intervention more on the basis of reading than math; for MO, the opposite appears to be the case.
The slope was used to represent the trend of student performance across grades 3 to 10. A positive slope means that percents proficient and above increase with increasing grade level; and negative, that they decrease. From Figure 2, we can compare the states on the basis of trends of “state proficient and above” lines. For instance, MA is over 1 for both reading and math while MS and OR are both lower than -4 for both subjects. That is, for some states the degree of idealism in performance standards increases over grade levels (those with negative slopes), while for others the degree of realism in performance standards increases over grade levels (those with positive slopes). However, most states appear to be in the negative-negative quadrant, meaning that their performance standards become more idealistic as grade level increases in both content areas, and resources for intervention may emphasize high and middle schools over elementary schools.
We can also conclude that the slopes of the trend lines are typically consistent across the two contents (reading and math), suggesting that degree of horizontal moderation is consistent at each grade level. States with higher slopes for reading tend to have higher slopes for math, but not as strongly as for the sixth-grade intercept comparison. The Pearson correlation coefficient was .512 (p<.01) for slopes. However, there are some states that show clear lack of horizontal moderation in trend; AR, FL, and KY stand out as possible outliers in the graph. In these states, there appears to be interaction between horizontal and vertical moderation; that is, the trend across grades in one subject is different from the trend in the other subject.
Figure 1
: Predicted Grade 6 Percent Proficient and Above
Correlation =.784
READING
90 80 70 60 50 40 30 20MATH
90 80 70 60 50 40 30 20 WY WVWI WA VA TX TN SD SC PA OROK OH NM NJ NH NE ND NC MT MS MO MN MI ME MD MA LA KY KS IN IL HI GA FL DE CO CA AZ ALAKFigure 2:
Slopes of Percent Proficient and Above Trend Lines
READING 4 2 0 -2 -4 -6 -8 MATH 4 2 0 -2 -4 -6 -8 WY WV WI WA VA TX TN SD SC PA OR OK OH NMNJ NH NE ND NC MT MS MO MN MI ME MD MA LA KY KS IN IL ID HI GA FL DE CO CA AZ AR AL AK
Correlation =.512
B. Degree of Articulation
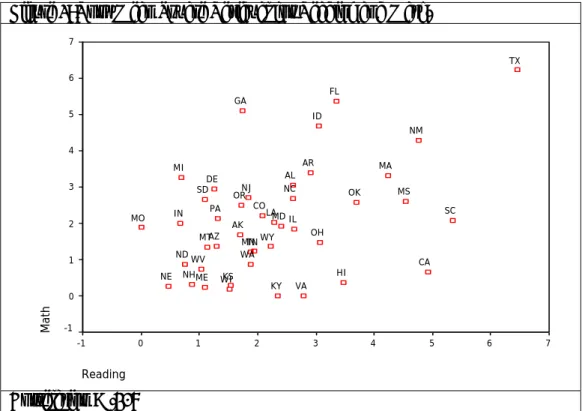
To study the degree of constancy in vertical moderation that states show, we calculated the average distance of the grade-level points (since high schools seem often to have divergent results from the other grades, only the six points from grade three to grade eight were used) from the regression line for those grades. In other words, we calculated the sum of squared differences between observed percents proficient and above and predicted percents proficient and above from the regression line
(the sum of squares for residuals) and then found the square root of the average sum of squares to get the standard deviation, which represents lack of articulation. We generated this root mean square for regression residuals across grades in both reading and math for each state. This is a measure of the constancy, or smoothness, of the vertical moderation for a given content-state combination, with zero indicating constancy. Figure 3 displays the results for reading and math.
Figure 3: Root Mean Square Residual for Reading and Math.
Reading 7 6 5 4 3 2 1 0 -1 Math 7 6 5 4 3 2 1 0 -1 WY WV WI WA VA TX TN SD SC PA OR OK OH NM NJ NH NE ND NC MT MS MO MN MI ME MD MA LA KY KS IN IL ID HI GA FL DE CO CA AZ AR AL AK
Correlation = .428
Most states seem to cluster in a range where there were small deviations in percents proficient from the regression lines, having a root mean square error between the structural minimum of zero and 3. There are also some clear outliers, such as TX. It should be noted that in some cases, the degree of vertical moderation is artificially high (and the corresponding measure near zero), because for states that have missing data on two or more grades, such as MO and NE, we estimated intermediate points linearly. Which data points are estimated and which are from state data are available (electronically) in our full report; see Schafer, Liu, & Wang (2007).
States that are articulated in reading also tend to be articulated in math; r=.428 (p<.01). However, some states such as GA, SC, and CA appear as outliers in Figure 3. For those states, the constancy (smoothness) of increase or decrease noted in one content area is not consistent with that of the other.
C. Consistency with NAEP Basic and Proficient
This section contains two parts. One is a series of univariate analyses in which the differences between state proficient and above and the two NAEP standards (basic and proficient) were presented for each content and grade combination. The second part is a series of bivariate analyses in which we studied the relationship between grade levels for each content separately, and the relationship between subjects for each grade level separately.
Univariate Analyses
Differences between state percent at and above proficient vs. NAEP percent at and above the associated cut score were calculated by subtracting the NAEP percent from the state percent (so that a positive number indicates that the state test showed more students above the cut point than NAEP). These differences are displayed in scatter
plots with state codes and in histograms. In the scatter plots, we use 0 as a reference line to show the direction and the distance between state and NAEP standards. In addition, the histograms show the shape of the distribution of those differences, with a normal curve used as a reference.
It should be remembered that each proportion that we used, particularly those associated with NAEP, have meaningfully large standard errors. As Stoneberg (2005) has pointed out, proper use of confidence intervals based on these standard errors can have dramatic effects on
state rankings. We have not included confidence intervals in our graphical presentations and suggest readers not attempt to interpret differences among states in the general neighborhood of each other.
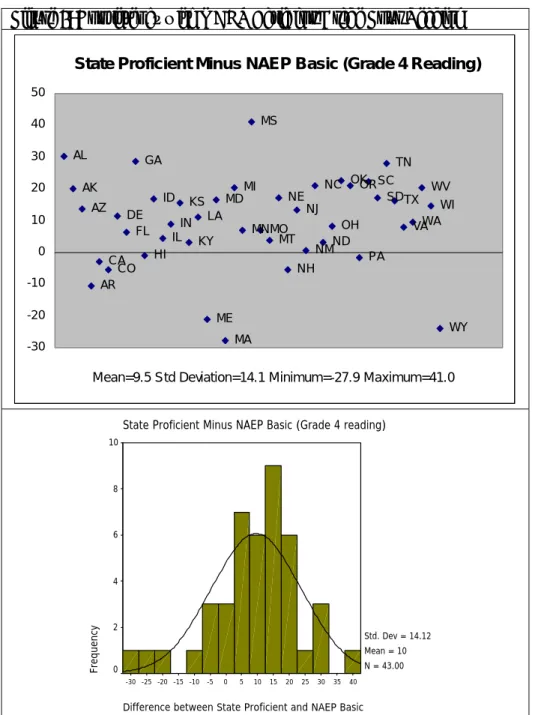
Figure 4 displays the differences between state percents proficient and NAEP percents basic for grade four reading. The differences are also displayed as a histogram, along with the mean and standard deviation. On average, state percents proficient average 9.5 percentage points above NAEP basic, with a standard deviation of 14.1.
Figure 4: Consistency with NAEP Basic for Grade Four Reading
AL AK AZ AR CA CO DE FL GA HI ID IL IN KS KY LA ME MD MA MI MN MS MO MT NE NH NJ NM NC ND OH OKOR PA SC SD TN TX VAWA WV WI WY -30 -20 -10 0 10 20 30 40 50
Mean=9.5 Std Deviation=14.1 Minimum=-27.9 Maximum=41.0
State Proficient Minus NAEP Basic (Grade 4 Reading)
Difference between State Proficient and NAEP Basic 40 35 30 25 20 15 10 5 0 -5 -10 -15 -20 -25 -30
State Proficient Minus NAEP Basic (Grade 4 reading)
Fr equenc y 10 8 6 4 2 0 Std. Dev = 14.12 Mean = 10 N = 43.00
Figure 5 displays the differences between state percents proficient and NAEP percents proficient for grade four reading. The differences are also displayed as a histogram, along with the mean and standard deviation.
On average, state percents proficient average 42.9 percentage points above NAEP proficient, with a standard deviation of 13.7.
Figure 5: Consistency with NAEP Proficient for Grade Four Reading
AL AK AZ ARCA CO DE FL GA HI ID IL IN KS KY LA ME MD MA MI MN MS MO MT NE NH NJ NM NC NDOH OK OR PA SCSD TN TX VAWA WV WI WY 0 10 20 30 40 50 60 70 80
Mean=42.9 Std Deviation=13.7 Minimum=6.3 Maximum=70.6
State Proficient Minus NAEP Proficient (Grade 4 Reading)
Difference between State Proficient and NAEP Proficient 70.0 65.0 60.0 55.0 50.0 45.0 40.0 35.0 30.0 25.0 20.0 15.0 10.0 5.0
State Proficient Minus NAEP Proficient (Grade 4 reading)
Fre que nc y 10 8 6 4 2 0 Std. Dev = 13.70 Mean = 42.9 N = 43.00
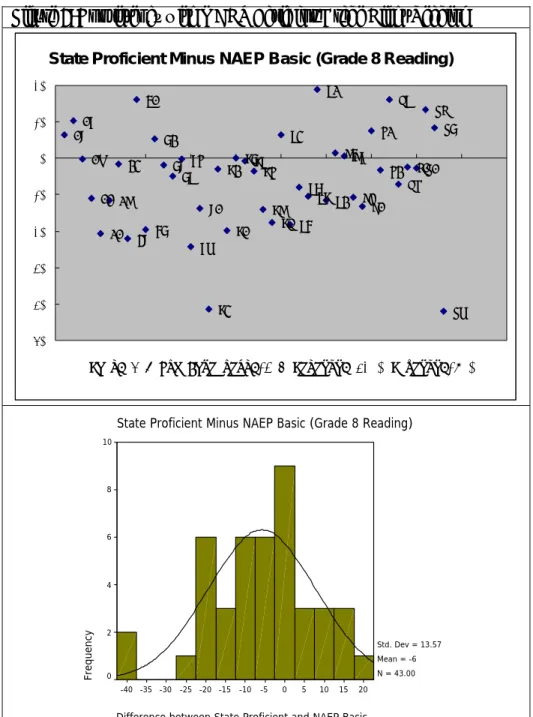
Figure 6 displays the differences between state percents proficient and NAEP percents basic for grade eight reading. The differences are also displayed as a histogram, along with the mean and standard deviation.
On average, state percents proficient average 5.8 percentage points below NAEP basic, with a standard deviation of 13.6.
Figure 6: Consistency with NAEP Basic for Grade Eight Reading
AL AK AZ AR CA CO DE FL GA HI ID IL IN KS KY LA ME MD MA MIMN MS MO MT NE NH NJ NM NC ND OHOK OR PA SC SD TN TX VAWA WV WI WY -50 -40 -30 -20 -10 0 10 20
Mean=-5.8 Std Deviation=13.6 Minimum=-42.0 Maximum=19.0
State Proficient Minus NAEP Basic (Grade 8 Reading)
Difference between State Proficient and NAEP Basic 20 15 10 5 0 -5 -10 -15 -20 -25 -30 -35 -40
State Proficient Minus NAEP Basic (Grade 8 Reading)
Fre que nc y 10 8 6 4 2 0 Std. Dev = 13.57 Mean = -6 N = 43.00
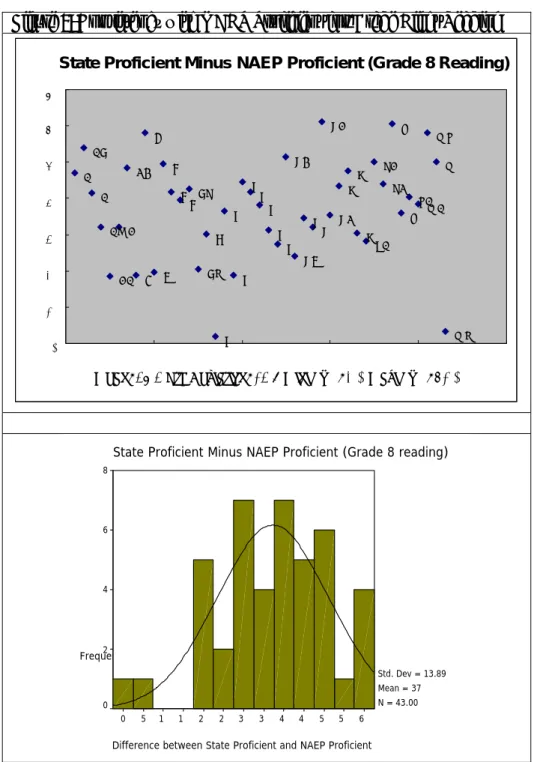
Figure 7 displays the differences between state percents proficient and NAEP percents proficient for grade eight reading. The differences are also displayed as a histogram, along with the mean and standard deviation.
On average, state percents proficient average 37.3 percentage points above NAEP proficient, with a standard deviation of 13.9.
Figure 7: Consistency with NAEP Proficient for Grade Eight Reading
A AK A AR CA C DE F G H I I I KS KY L M M M M M M M M NE NH N N NC ND O O O PA SC SD T T VA WA WV W WY 0 1 2 3 4 5 6 7
State Proficient Minus NAEP Proficient (Grade 8 Reading)
Mean=37.3 Std Deviation=13.9 Minimum=2.0 Maximum=61.0
Difference between State Proficient and NAEP Proficient
6 5 5 4 4 3 3 2 2 1 1 5 0
State Proficient Minus NAEP Proficient (Grade 8 reading)
Frequenc 8 6 4 2 0 Std. Dev = 13.89 Mean = 37 N = 43.00
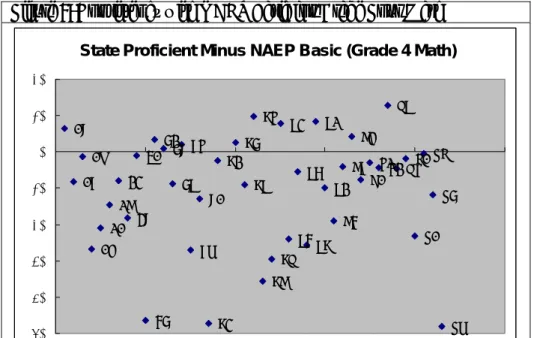
Figure 8 displays the differences between state percents proficient and NAEP percents basic for grade four math. The differences are also displayed as a histogram, along with the mean and standard deviation.
On average, state percents proficient average 11.7 percentage points below NAEP basic, with a standard deviation of 16.5.
Figure 8: Consistency with NAEP Basic for Grade Four Math
AL AK AZ AR CA CO DE FL GA HI ID IL IN KS KY LA ME MD MI MN MS MO MT NE NH NJ NM NC ND OH OK OR PASCSD TN TXVA WA WV WI WY -50 -40 -30 -20 -10 0 10 20
State Proficient Minus NAEP Basic (Grade 4 Math)
Mean=-11.7 Std Deviation=16.5 Minimum=-50.6 Maximum=12.8
Difference between State Proficient and NAEP Basic 15 10 5 0 -5 -10 -15 -20 -25 -30 -35 -40 -45 -50
State Proficient Minus NAEP Basic (Grade 4 Math)
Fre que nc y 8 6 4 2 0 Std. Dev = 16.48 Mean = -12 N = 43.00
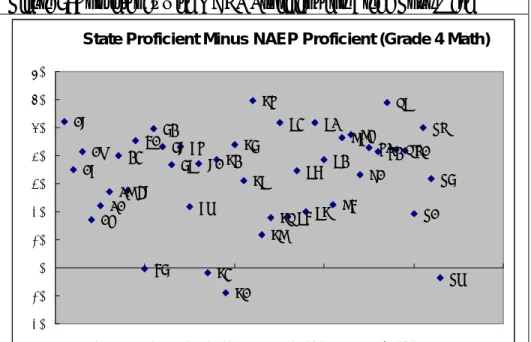
Figure 9 displays the differences between state percents proficient and NAEP percents proficient for grade four math. The differences are also displayed as a histogram, along with the mean and standard deviation.
On average, state percents proficient average 33.0 percentage points above NAEP proficient, with a standard deviation of 16.7.
Figure 9: Consistency with NAEP Proficient for Grade Four Math
AL AK AZ AR CA CO DE FL GA HI ID IL IN KS KY LA ME MD MA MI MN MS MO MT NE NH NJ NM NC ND OH OKOR PA SCSD TN TXVA WA WV WI WY -20 -10 0 10 20 30 40 50 60 70
Mean=33.0 Std Deviation=16.7 Minimum=-8.8 Maximum=59.5
State Proficient Minus NAEP Proficient (Grade 4 Math)
Difference between State Proficient and NAEP Proficient 60 55 50 45 40 35 30 25 20 15 10 5 0 -5 -10
State Proficient Minus NAEP Proficient (Grade 4 Math)
Fre que nc y 8 6 4 2 0 Std. Dev = 16.75 Mean = 33 N = 43.00
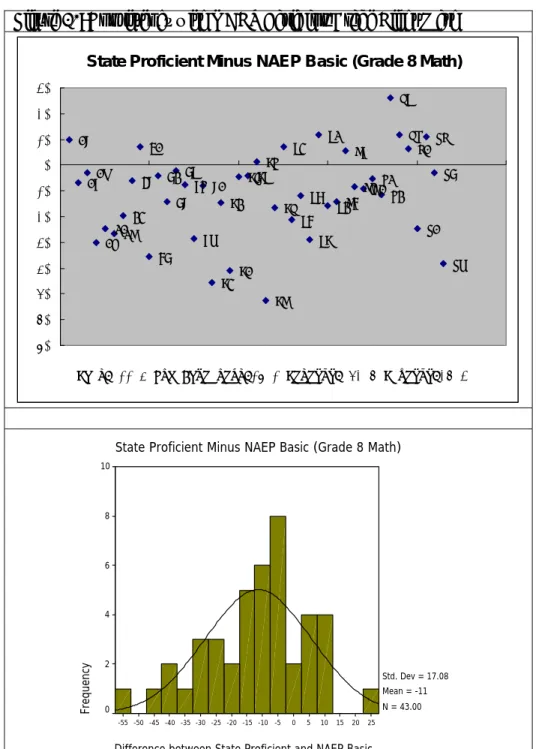
Figure 10 displays the differences between state percents proficient and NAEP percents basic for grade eight math. The differences are also displayed as a histogram, along with the mean and standard deviation.
On average, state percents proficient average 11.4 percentage points below NAEP basic, with a standard deviation of 17.1.
Figure 10: Consistency with NAEP Basic for Grade Eight Math
AL AKAZ ARCACO DE FL GA HI ID IL IN KS KY ME MD MA MIMN MS MO MT NE NH NJ NM NC NDOH OK ORPASCSD TN TX VA WA WV WI WY LA -70 -60 -50 -40 -30 -20 -10 0 10 20 30
Mean=-11.4 Std Deviation=17.1 Minimum=-52.6 Maximum=26.3 State Proficient Minus NAEP Basic (Grade 8 Math)
Difference between State Proficient and NAEP Basic 25 20 15 10 5 0 -5 -10 -15 -20 -25 -30 -35 -40 -45 -50 -55
State Proficient Minus NAEP Basic (Grade 8 Math)
Frequency 10 8 6 4 2 0 Std. Dev = 17.08 Mean = -11 N = 43.00
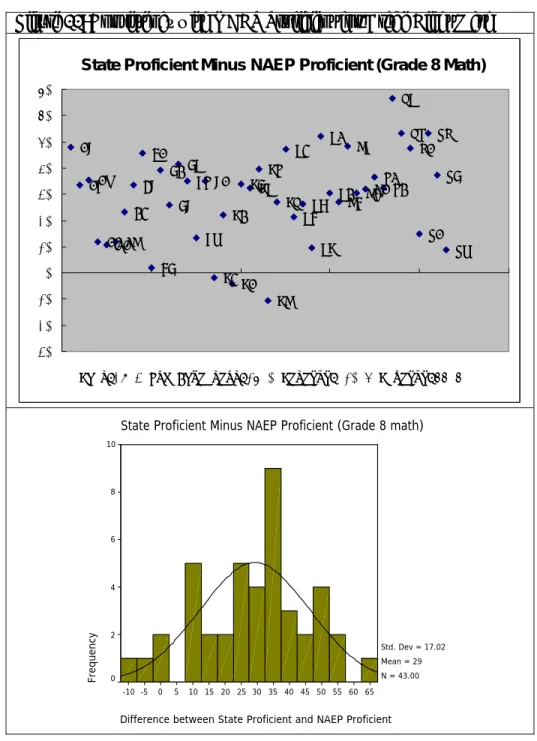
Figure 11 displays the differences between state percents proficient and NAEP percents proficient for grade eight math. The differences are also displayed as a histogram, along with the mean and standard deviation.
On average, state percents proficient average 29.3 percentage points above NAEP proficient, with a standard deviation of 17.0.
Figure 11: Consistency with NAEP Proficient for Grade Eight Math
AL AKAZ ARCACO DE FL GA HI ID IL IN KS KY LA ME MD MA MIMN MS MO MT NE NHNJ NM NC ND OH OK ORPA SC SD TN TX VA WA WV WI WY -30 -20 -10 0 10 20 30 40 50 60 70
Mean=29.3 Std Deviation=17.0 Minimum=-10.5 Maximum=66.6 State Proficient Minus NAEP Proficient (Grade 8 Math)
Difference between State Proficient and NAEP Proficient 65 60 55 50 45 40 35 30 25 20 15 10 5 0 -5 -10
State Proficient Minus NAEP Proficient (Grade 8 math)
Fre que nc y 10 8 6 4 2 0 Std. Dev = 17.02 Mean = 29 N = 43.00
Table 1 summarizes the descriptive statistics for the differences appearing in Figures 4 through 11 between the percentages at and above the state proficient level minus the NAEP basic or proficient level. In reading, the average state percent approximates the average NAEP percent for basic; the average differences are within ten percentage points. Differences between state percentages and percentages for NAEP proficient are far larger. Thus,
state proficient levels, on average, are approximately equally realistic (or idealistic) as the NAEP basic standard for reading and more realistic (less idealistic) than the NAEP proficient standard.
Average differences between states and NAEP in math show a somewhat different pattern. State percentages appear to be smaller on average than NAEP
basic and larger than NAEP proficient. Thus, state proficiency levels appear to be more idealistic than NAEP basic but more realistic than NAEP proficient. Also,
generally speaking, the magnitude of the standard deviation in math is larger than that in reading, indicating larger differences, state-to-state, in math.
Table 1
: Descriptive Statistics for the Differences Between State and NAEP Standards
State Minus NAEP(%)
N
Minimum Maximum
Mean Std. Deviation
Basic grade 4 Reading
43
-27.91
40.96
9.52
14.12
Prof. Grade 4 Reading
43
6.33
70.62
42.92
13.70
Basic Grade 8 Reading
43
-42.00
18.97
-5.81
13.57
Prof Grade 8 Reading
43
1.99
61.02
37.29
13.89
Basic Grade 4 Math
43
-50.59
12.77
-11.69
16.48
Prof Grade 4 Math
43
-8.78
59.47
33.03
16.75
Basic Grade 8 Math
43
-52.57
26.25
-11.36
17.08
Prof Grade 8 Math
43
-10.52
66.64
29.27
17.02
Bivariate Analyses
In this section, we organized the differences displayed in Figures 3 through 11 into scatter plots showing the (in)consistency of state-NAEP differences across states for the two grades (4 and 8) in a given content and for the two contents (reading and math) in a given grade. These results are shown first for NAEP Basic and then for NAEP Proficient. In interpreting these graphs, note that the axes have different maximums, so the lines of equality will not appear as diagonals.
1. NAEP Basic
Figure 12 shows each state’s consistency between grades four and eight on reading percents proficient adjusting for NAEP percents basic. States toward the lower left show smaller percents proficient than NAEP basic (more idealistic) and states in the upper right show greater percents proficient than NAEP basic (more realistic). States along the line of equality show equivalent degrees of idealism-realism for the two grade levels when adjusting for NAEP percent basic, indicating vertical moderation.
Figure 12: Grade Consistency of State vs. NAEP Basic in Reading
Difference of State Proficient Minus NAEP Basic (Reading)
Grade 4 50 40 30 20 10 0 -10 -20 -30 Grade 8 20 10 0 -10 -20 -30 -40 -50 WY WI WV WA VA TX TN SD SC PA OR OK OH ND NM NJ NH NE MT MO MS MN MI MA MD ME LA KY KS IN IL ID HI GA FL DE CO CA AR AZ AK AL
Correlation = 0.784
basi
Figure 13: Grade Consistency of State vs. NAEP Basic in Math
c (more idealistic) and states in the upper right showgreater percents proficient than NAEP basic (more realistic). States along the line of equality show equivalent
degrees of idealism-realism for the two grade levels when adjusting for NAEP percent basic, indicating vertical moderation.
Difference of State Proficient Minus NAEP Basic (Math)
40 Grade 4 20 10 0 -10 -20 -30 -40 -50 -60 Grade 8 20 0 -20 -40 -60 WY WI WV WA VA TX TN SD SC PA OR OK OH ND NC NM NJ NH NE MT MO MS MN MI MA MD ME LA KY KS IN IL ID HI GA FL DE CO CA AR AZ AK AL
Correlation = 0.866
igure 14 shows each state’s consistency between reading and math on grade four percents proficient adju
Figure 15 shows each state’s consistency between reading and math on grade eight percents proficient adju
F
sting for NAEP percents basic. States toward the lower left show smaller percents proficient than NAEP basic (more idealistic) and states in the upper right show greater percents proficient than NAEP basic (more realistic). States along the line of equality show equivalent degrees of idealism-realism for the two contents when adjusting for NAEP percent basic, indicating horizontal moderation.
sting for NAEP percents basic. States toward the lower left show smaller percents proficient than NAEP basic (more idealistic) and states in the upper right show greater percents proficient than NAEP basic (more realistic). States along the line of equality show equivalent degrees of idealism-realism for the two contents when adjusting for NAEP percent basic, indicating horizontal moderation.
Figure 14: Content Consistency of State vs. NAEP Basic at Grade 4
Difference of State Proficient Minus NAEP Basic (Grade 4)
Reading 50 40 30 20 10 0 -10 -20 -30 Math 20 10 0 -10 -20 -30 -40 -50 -60 WY WI WV WA VA TX TN SD SC PA OR OK OH ND NC NM NJ NH NE MT MO MS MN MI MA MD ME LA KY KS IN IL ID HI GA FL DE CO CA AR AZ AK AL
Correlation = 0.846
Figure 15: Content Consistency of State vs. NAEP Basic at Grade 8
Difference of State Proficient Minus NAEP Basic (Grade8)
Reading 20 10 0 -10 -20 -30 -40 -50 Math 40 20 0 -20 -40 -60 WY WI WV WA VA TX TN SD SC PA OR OK OH ND NC NM NJ NH NE MT MO MS MNMI MA MD ME LA KY KS IN IL ID HI GA FL DE CO CA AR AZ AK AL
Correlation = 0.763
2. NAEP Proficient
Figure 16 shows each state’s consistency between grades four and eight on reading percents proficient adjusting for NAEP percents proficient. States toward the lower left show percents proficient closer to NAEP proficient (more idealistic) and states in the upper right show percents proficient further from NAEP proficient (more realistic). States along the line of equality show equivalent degrees of idealism-realism for the grades four and eight when adjusting for NAEP percent proficient, indicating vertical moderation.
Figure 17 shows each state’s consistency between grades four and eight on math percents proficient adjusting for NAEP percents proficient. States toward the lower left show lower percents proficient than NAEP proficient (more idealistic) and states in the upper right show higher percents proficient than NAEP proficient (more realistic). States along the line of equality show equivalent degrees of idealism-realism for the grades four and eight when adjusting for NAEP percent proficient, indicating vertical moderation.
Figure 16: Grade Consistency of State vs. NAEP Proficient in Reading
Difference of State Proficient Minus NAEP Proficient (Reading)
Grade 4 80 70 60 50 40 30 20 10 0 Grade 8 70 60 50 40 30 20 10 0 WY WI WV WA VA TX TN SD SC PA OR OK OH ND NC NM NJ NH NE MT MO MS MN MI MA MD ME LA KY KS IN IL ID HI GA FL DE CO CA AR AZ AK AL
Correlation = 0.793
Figure 17: Grade Consistency of State vs. NAEP Proficient in Math
Difference of State Proficient Minus NAEP Proficient (Math)
Grade 4 60 50 40 30 20 10 0 -10 Grade 8 80 60 40 20 0 -20 WY WI WV WA VA TX TN SDSC PA OR OK OH ND NC NM NJ NH NE MT MO MS MN MI MA MD ME LA KY KS IN IL ID HI GA FL DE CO CA AR AZ AK AL
Correlation = 0.863
Figure 18 shows each state’s consistency between reading and math percents proficient adjusting for NAEP percents proficient at grade four. States toward the lower left show lower percents proficient than NAEP proficient (more idealistic) and states in the upper right show higher
percents proficient than NAEP proficient (more realistic). States along the line of equality show equivalent degrees of idealism-realism for reading and math when adjusting for NAEP percent proficient, indicating horizontal moderation.
Figure 18: Content Consistency of State vs. NAEP Proficient at Grade 4
Difference of State Proficient Minus NAEP Proficient (Grade 4)
Reading 80 70 60 50 40 30 20 10 0 Math 60 50 40 30 20 10 0 -10 WY WI WV WA VA TX SDSC PA OR OK OH ND NC NM NJ NH NE MT MO MN MI MA MD ME LA KY KS IN IL ID HI GA FL DE CO CA AR AZ AK AL
Correlation
=
0.882
Figure 19 shows each state’s consistency between reading and math percents proficient adjusting for NAEP percents proficient at grade eight. States toward the lower left show lower percents proficient than NAEP proficient (more idealistic) and states in the upper right show higher
percents proficient than NAEP proficient (more realistic). States along the line of equality show equivalent degrees of idealism-realism for reading and math when adjusting for NAEP percent proficient, indicating horizontal moderation.
Figure 19: Content Consistency of State vs. NAEP Proficient at Grade 8
Difference of State Proficient Minus NAEP Proficient (Grade 8)
Reading 70 60 50 40 30 20 10 0 Math 80 60 40 20 0 -20 WY WI WV WA VA TX TN SD SC PA OR OK OH ND NC NM NJ NH NE MT MO MS MN MI MA MD ME LA KY KS IN IL ID HI GA FL DE CO CA AR AZ AK AL
Correlation = 0.741
Figures 12 through 19 each indicate moderation of state results when NAEP, either Basic or Proficient, is taken into account. For common content areas, Figures 12 and 13 (for NAEP Basic) and Figures 16 and 17 (for NAEP Proficient) demonstrate substantial consistency in state results between grades four and eight, with the cross-grade correlations ranging from .784 to .866. The correlations between contents in Figures 14 and 15 (for NAEP Basic) and Figures 18 and 19 (for NAEP Proficient) also show consistency between content areas at each grade, with correlations ranging from .741 to .882. Apparently the trend we noted in the univariate analyses, that math performance standards are more idealistic than reading when taking NAEP into account, is relatively consistent across states.
DISCUSSION AND CONCLUSIONS
We used the typical (sixth-grade) predictions of the regression lines of percent proficient on grade level to evaluate the consistency of state expectations for reading and math and compared them in a graphic (see Figure 1). When expectations are equivalent for reading and math, the state would appear on the diagonal in Figure 1. Those that are well away from the diagonal run a risk of
over-identifying schools as in need of improvement in one content area and a corresponding risk of under-identifying schools in the other content. This may have implications for asymmetric resource allocations.
We used the slopes of the regression lines of percent proficient on grade level to evaluate one aspect (direction) of vertical moderation. If the slopes are flat, then grade levels are approximately equally likely to be the cause of identification of a school as in need of improvement. Those states that show flat regression lines in both contents are near the origin (0,0) point in Figure 2. But if the slopes are not flat, then we can evaluate whether the same increasing or decreasing pattern is or is not in common between the two contents. If the pattern is the same, then the state should appear on the diagonal in Figure 2.
Another aspect of vertical moderation (smoothness) can be evaluated by whether the percents proficient are predictable from grade-to-grade, whether the overall pattern is increasing, decreasing, or flat. In Figure 3, we evaluated deviations from regressions of percents proficient on grade three to grade eight. States that are near the origin show greater smoothness in vertical moderation and most states appear to cluster there.
There appears to be a trend toward using NAEP Basic as opposed to NAEP Proficient as the benchmark for states’ Proficient categories. Although it could be argued that, in the light of the striking variation along the idealistic-realistic dimension among states, there is little value in answering this question for states in general; Figures 4 through 11 and Table 1, which show deviations from the two NAEP achievement level percentages, suggest that NAEP Basic is more consistent with states’ Proficient expectation than is NAEP Proficient, but more so for reading than math.
It could be argued that states may not show much consistency between contents and between grades because there are real differences in instructional effectiveness in one or both these directions. If so, then perhaps using NAEP percentages as benchmarks and comparing states’ differences with them could become interesting. Figures 12 through 19 display those results. Vertical moderation with respect to NAEP is shown in Figures 12, 13, 16, and 17; states close to the line of equality show vertical moderation when NAEP is taken into account. Horizontal moderation is shown in Figures 14, 15, 18, and 19; states close to the line of equality show horizontal moderation when NAEP is taken into account.
RECOMMENDATIONS AND LIMITATIONS
We have determined that states differ significantly in the various indices that we have developed for evaluating states’ vertical and horizontal moderation and in their relationship with NAEP results. The value of these analyses in evaluating the standards set in states will in part depend on how they are related with the results of educational reform efforts that states undertake. Are idealistic expectations motivating or discouraging; are realistic expectations motivating or encouraging? There do not appear to be clear ways to answer these questions at this time. Perhaps this paper can suggest ways to compare states on the characteristics we have described. Researchers are encouraged to quantify and study differences like those we have found as predictors of improvement as measured using states’ results and/or NAEP results from future administration as correlates of change.
The National Assessment Governing Board’s Ad Hoc Committee on Confirming Test Results (2002) has recommended that point-by-point comparisons between state percents proficient and NAEP results not be use to declare state tests valid or not valid. Thus, we will not comment on states’ individual results. Each state can
to argue the value of any particular configuration of percents proficient nor any particular comparison between a state’s results and those from NAEP. The current importance of these results to states depends on their idiosyncratic policy goals.
The comparisons we made between state and NAEP results should be interpreted in the light of several limitations. Among these are:
• Possible instability of NAEP results at grades four and eight. Sampling errors in percents proficient and basic were not incorporated into our analyses.
• Possible instability of state results at all grades. Even though all students in the state are included and therefore statistics are relatively free of student sampling error, sampling error in content coverage (alignment) for different test forms can affect student scores, as can cohorts from year to year, particularly for small states or for those experiencing demographic shifts.
• Changes in the enacted curriculum. As teachers and their supervisors react to tests that are more and more important to them, their curricular, and therefore instructional goals may become more consistent with those expressed by the state.
• Content equivalence between state and NAEP content. While states commonly use NAEP (along with other) frameworks to validate their own, it is possible that NAEP does not represent the content standards of states in a way that is fair to all, which can affect the validity of the comparisons we have made.
• Cut score equivalence. Some states are still in the process of determining cut scores for their proficient achievement levels and Nebraska’s results are amalgamated across several cut score determinations. Therefore, the data for some states may be out-of-date.
• Data errors. Public web sites were used to generate all the data used in this report. Each of these sites used its own means of expression of its data. While care was taken to ensure accuracy, it is possible that errors inadvertently were introduced into the results. We apologize in advance if this may have occurred.
References
Ad Hoc Committee on Confirming Test Results. (2002). Using the National Assessment of Educational Progress to confirm state test results. Washington, D.C.: National Assessment Governing Board. Retrieved June 30,
www.nagb.org/pubs/color_document.pdf .
Fuller, B., Gesicki, K., Kang, E., & Wright, J. (2006). Is the No Child Left Behind Act working? Policy Analysis for California Education, Berkeley.
Jones, L. V., Olkin, I., & American Educational Research Association. (2004). The nation's report card: evolution and perspectives. Bloomington, IN: Published by the Phi Delta Kappa Educational Foundation in cooperation with the American Educational Research Association. Linn, R. L. (2000). Assessments and Accountability.
Educational Researcher, 29(2), 4-16.
Linn, R. L. (2003). Performance standards: Utility for different uses of assessments. Education Policy Analysis Archives, 11(31).
Linn, R. L. (2005a). Adjusting for Difference in Tests. Paper presented at the Symposium on the Use of School-Level Data for Evaluating Federal EducationPrograms. Retrieved from
http://www7.nationalacademies.org/bota/School-L evel%20Data_Robert%20Linn-Paper.pdf .
Linn, R. L. (2005b). Issues in the design of accountability systems. CSE Technical Report 650. Paper presented at the 2005 National Center for Research on Evaluation, Standards, and Student Testing (CRESST) Retrieved from http://www.cse.ucla.edu/reports/r650.pdf . Lissitz, Robert W. & Huynh Huynh (2003). Vertical
equating for state assessments: issues and solutions in determination of adequate yearly progress and school accountability. Practical Assessment, Research &
Evaluation, 8(10). Retrieved from
http://PAREonline.net/getvn.asp?v=8&n=10 . McLaughlin, D. (2005).Considerations in using the
longitudinal school-level state assessment score database. Paper presented at the Symposium on the Use of School-Level Data for Evaluating Federal Education Programs. Retrieved from
http://www7.nationalacademies.org/bota/School-L evel%20Data_McLaughlin-Final.pdf .
McLaughlin, D., & Mello, V. B. d. (2002). Comparison of State Elementary School Mathematics Achievement Standards, Using NAEP 2000. Paper presented at the American Educational Research Association
(AERA). Retrieved from
http://208.253.216.16/assessment/Reports/AERA _2002_state_standards.pdf .
Mosquin, P. & Chromy, J. (2004). Federal sample sizes for confirmation of state tests in the No Child Left Behind Act.
Washington, DC: American Institutes for Research. Retrieved from
http://www.air.org/publications/documents/Mosq uinChromy_AIR1.pdf .
National Center for Education Statistics (2003). The nation's report card: Reading highlights 2003. Washington, DC: Author. Retrieved from
http://nces.ed.gov/nationsreportcard/pdf/main200 3/2004452.pdf .
National Center for Education Statistics (2005). The nation's report card: Reading highlights 2005. Washington, DC: Author. Retrieved from
http://nces.ed.gov/nationsreportcard/pdf/main200 5/2006451.pdf .
National Center for Education Statistics (2007). Mapping 2005 state proficiency standards onto the NAEP
scales (NCES 2007–482). U.S. Department of Education, National Center for Education Statistics, Washington, D.C.: U.S. Government Printing Office. Pellegrino, J. W., Jones, L. R., & Mitchell, K. J. (1999).
Grading the Nation's Report Card: Evaluating NAEP and Transforming the Assessment of Educational Progress: Washington, D.C.: National Academy Press.
Schafer, W. D. (2005). Criteria for standard setting from the sponsor’s perspective. Applied Measurement in Education, 18(1), 61-81.
Schafer, W. D., Liu, M. & Wang, H. (2007). Cross-grade comparisons among statewise assessments and NAEP. American Educational Research Association convention, Chicago [Available online:
http://marces.org/presentation/State_Comparisons _Paper07_05_18.pdf ].
Stoneberg, Bert D. (2005). Please Don’t Use NAEP Scores to Rank Order the 50 States. Practical Assessment Research & Evaluation, 10(9). Available online:
http://pareonline.net/getvn.asp?v=10&n=9 Stoneberg, Bert D. (2007). Using NAEP to Confirm State
Test Results in the No Child Left Behind Act. Practical Assessment Research & Evaluation, 12(5). Available online: http://pareonline.net/getvn.asp?v=12&n=5 Shepard, L. A., Glaser, R., Linn, R. L., & Bohrnstedt, G.
W. (1993). Setting Performance Standards for Students Achievement: A Report of the NAEP Trial State Assessment: An Evaluation of the 1992 Achievement levels. Stanford, Calif.: National Academy of Education.
Appendix
Data sources: (URL’s verified on Aug 26, 2007)# State URLs for state assessment
1 AK Alaska http://www.eed.state.ak.us/reportcard/2004-2005/5Assessment%20Results/Spring %202005%20Statewide%20SBA%20Results.pdf http://www.eed.state.ak.us/reportcard/2004-2005/5Assessment%20Results/Spring %202005%20Statewide%20HSGQE%20Results.pdf 2 AL Alabama http://www.alsde.edu/Accountability/Accountability.asp http://www.alsde.edu/Accountability/2005Reports/AL2005ARMT_0624051.pdf 3 AR Arkansas http://arkansased.org/testing/test_scores_archive.html#2005 4 AZ Arizona http://www.ade.state.az.us/srcs/statereportcards/statereportcard04-05.pdf 5 CA California http://star.cde.ca.gov/star2005/viewreport.asp?ps=true&lstTestYear=2004&lstTest Type=C&lstCounty=&lstDistrict=&lstSchool=&lstGroup=1&lstSubGroup=1 6 CO Colorado http://www.cde.state.co.us/cdeassess/documents/csap/csap_summary.html
7 CT* Connecticut http://www.captreports.com/web2005/Summary/ERG/OS.html (for grade 10 only); State report for NCLB could not be opened:
http://www.csde.state.ct.us/public/cedar/nclb/dist_school_nclb_results/index.htm
8 DC* District of
Columbia There is only combined data at elementary level and secondary level. 9 DE Delaware http://www.doe.state.de.us/files/pdf/de_edreportcard200405.pdf
10 FL Florida http://fcat.fldoe.org/fcinfopg.asp
11 GA Georgia http://reportcard2005.gaosa.org/k12/reports.aspX?ID=ALL:ALL&TestKey=C*4& TestType=qcc
12 HI Hawaii http://arch.k12.hi.us/PDFs/nclb/2005/NCLB999.pdf
13 IA* Iowa There is only biennium data for 2003-2005
14 ID Idaho http://www.sde.state.id.us/ipd/aypassessment05/default.asp 15 IL Illinois http://webprod1.isbe.net/ereportcard/publicsite/getSearchCriteria.aspx 16 IN Indiana http://www.doe.state.in.us/reed/newsr/2005/12-December/051214prOverview.pdf 17 KS Kansas http://www.ksde.org/LinkClick.aspx?fileticket=gZ/pBgZv71g=&tabid=228 18 KY Kentucky http://apps.kde.state.ky.us/secure_cats_reports_05/index.cfm?fuseaction=main.disp lay_regionstate 19 LA Louisiana http://www.doe.state.la.us/lde/uploads/7714.pdf 20 MA Massachusetts http://www.doe.mass.edu/mcas/2005/results/summary.pdf 21 MD Maryland http://msp.msde.state.md.us/downloadindex.aspx?K=99AAAA 22 ME Maine http://www.maine.gov/education/mea/edmea.htm 23 MI Michigan http://www.michigan.gov/documents/FALL_2005_STATEWIDE_MEAP_RESUL TS_151913_7.pdf 24 MN Minnesota http://education.state.mn.us/MDE/Data/Data_Downloads/Accountability_Data/ Assessment_MCA_II/MCA_II_Tab_delimited_files/index.html 25 MO Missouri http://dese.mo.gov/divimprove/assess/stateresults.html.pdf; http://dese.mo.gov/divimprove/assess/State_MAP2005_Reading.pdf 26 MS Mississippi http://orsap.mde.k12.ms.us:8080/MAARS/indexProcessor.jsp 27 MT Montana http://www.opi.mt.gov/PDF/Measurement/rptDistCrtResults2005.pdf 28 NC North Carolina http://disag.ncpublicschools.org/2005/
29 ND North Dakota http://www.dpi.state.nd.us/resource/biennial.PDF
30 NE Nebraska
http://reportcard.nde.state.ne.us/20042005/DownloadFiles/ReportCard20042005_Inside
31 NH New Hampshire http://www.ed.state.nh.us/education/doe/organization/curriculum/NECAP/NEC AP_results.htm (For grade 3-8)
05/Sta.pdf (For grade 10)
32 NJ New Jersey http://www.nj.gov/njded/schools/achievement/2006/njask3/summary.pdf (For grade 3, 4);
http://www.nj.gov/njded/schools/achievement/2006/gepa/summary.pdf (For grade 8);
http://www.nj.gov/njded/schools/achievement/2006/hspa/summary.pdf (For grade 11).
33 NM New Mexico http://ped.state.nm.us/div/acc.assess/accountability/DistrictReportCard.html
34 NV* Nevada The most recent data we can find is in 2004. 35 NY* New York No data for 2005
36 OH Ohio http://www.ode.state.oh.us/GD/Templates/Pages/ODE/ODEDetail.aspx?page=3 &TopicRelationID=116&ContentID=34744&Content=34857
37 OK Oklahoma http://title3.sde.state.ok.us/studentassessment/2005results/reportcard2005state.pdf
38 OR Oregon http://www.ode.state.or.us/data/annreportcard/rptcard2005.pdf
39 PA Pennsylvania http://www.pde.state.pa.us/a_and_t/cwp/view.asp?a=3&q=115272
40 RI* Rhode Island The most recent data is in 2004: http://131.109.26.252/reportcard/04/
41 SC South Carolina http://ed.sc.gov/topics/assessment/scores/pact/2005/statescoresgrade.cfm
42 SD South Dakota https://sis.ddncampus.net:8081/nclb/portal/portal.xsl?&extractID=7
43 TN Tennessee http://www.k-12.state.tn.us/rptcrd05/state2.asp
44 TX Texas http://www.tea.state.tx.us/perfreport/aeis/2005/state.html
45 UT* Utah http://www.usoe.k12.ut.us/eval/Results.asp
46 VA Virginia https://p1pe.doe.virginia.gov/reportcard/report.do?division=All&schoolName=All 47 VT* Vermont http://www.state.vt.us/educ/new/pdfdoc/pgm_assessment/cas/cas_99_05_statewi de.pdf 48 WA Washington http://reportcard.ospi.k12.wa.us/ 49 WI Wisconsin http://data.dpi.state.wi.us/data/graphshell.asp?SubjectID=3MA&GraphFile=GEDISA&DETAIL =YES&Grade=10&Group=AllStudentsFAY&EligibleOnly=NO&Level=ALL&WOW=WSAS&O RGLEVEL=ST&FULLKEY=ZZZZZZZZZZZZ&DN=None+Chosen&SN=None+Chosen http://dpi.wi.gov/oea/spr_kce.html
50 WV West Virginia https://wveis.k12.wv.us/nclb/pub/rpt0405/chartdata05rcs.cfm?year=05&county=9 99&school=999&coname=&rptnum=1&rpage=pickreportcard.cfm
51 WY Wyoming https://wdesecure.k12.wy.us/stats/wde_public.esc.show_menu
52 PR* Puerto Rico The link could not be opened:
http://eduportal.de.gobierno.pr/EDUPortal/default.htm