This paper can be downloaded without charge at: The Fondazione Eni Enrico Mattei Note di Lavoro Series Index: http://www.feem.it/Feem/Pub/Publications/WPapers/default.htm Social Science Research Network Electronic Paper Collection:
http://ssrn.com/abstract=600589
The opinions expressed in this paper do not necessarily reflect the position of
Fondazione Eni Enrico Mattei
Evaluation of Urban Improvement
on the Islands of the Venice
Lagoon: A Spatially-Distributed
Hedonic-Hierarchical Approach
Margaretha Breil, Anita Fassio, Carlo Giupponi and Paolo Rosato
NOTA DI LAVORO 123.2004
OCTOBER 2004
NRM – Natural Resources Management
Margaretha Breil and Anita Fassio, Fondazione Eni Enrico Mattei Carlo Giupponi, Department of Plant Production, University of Milan
and Fondazione Eni Enrico Mattei
Paolo Rosato, Department of Civil Engineering, University of Trieste and Fondazione Eni Enrico Mattei
Evaluation of Urban Improvement on the Islands of the Venice
Lagoon: A Spatially-Distributed Hedonic-Hierarchical Approach
Summary
This paper presents a model for the evaluation of environmental and urban improvements on the islands of the Venetian lagoon. The model simulates the changes in residential real estate values using a value function integrated in a geographical database which provides spatial distributions of values changes. The fairly weak market signals, fragmented demand and strong externalities, and the scarcity of market data available do not permit the use of econometric models for value appraisal. Appropriate hedonic-hierarchical value functions are calibrated on the basis of a set of indicators of the characteristics of the buildings and the location. Some applications of the model are illustrated simulating two scenarios of future interventions which are actually being discussed or realised and involving the island of Murano, Burano and S. Erasmo in the Venice Lagoon. The interventions considered are: subway beyond the lagoon connecting Murano with Venice and the mainland, and the solution of “high water” problems on Murano, Burano and S. Erasmo.
Keywords: Public work assessment, Property value, Hierarchical analysis
JEL Classification: R21, R31
Address for correspondence: Anita Fassio
Fondazione Eni Enrico Mattei Castello 5252 30122 Venice Italy Phone: +39 0412711403 Fax: +39 042711461 E-mail: anita.fassio@feem.it
0. Introduction
The economic evaluation of the environmental and urban improvement is a topical subject and has registered an impressive number of methodological and operational contributions in the last decades. The methods proposed include some which derive a monetary value of the utility produced by public interventions from variations in the market value of private goods, especially residential properties. In fact, dwellings are complex goods, whose value depends on many factors, among which the quality of the environment and services in the area plays a fundamental role. Immobility renders the value of housing extremely sensitive to externalities (Curto, 1993; Rosato and Stellin, 2000), so the analysis of the factors influencing the value can be useful for identifying and evaluating the social appreciation of the protection of public goods and services (Garrod and Willis, 1992; Scarpa, 1995; Chattopadhyay, 1999). Modifications to property values - surveyed or estimated by a simulation of the property market - thus become an indicator for estimating the value created by urban improvement.
The model developed in this paper is the result of a collaboration between scientists of different disciplines and integrating two different approaches: a simplified procedure developed for the economic valuation of environmental improvement (Rosato et al., 2002) and an ecological evaluation model in a GIS (Geographical Information System) environment developed to analyse the relations between land use and biodiversity (Giupponi and Coletto, 2003). Two clearly very different contexts, which however present good synergies, the former in providing tools for economic analysis and valuation, and the latter in providing the methodology for setting up, interpreting and modelling functional relationships between georeferenced “events” (i.e. information about prices of residential properties) and their, current or future/possible, local context, by exploiting the spatial data processing capabilities offered by the GIS.
The idea behind this work was that of analysing how advanced methods of geographical modelling can be integrated with economic valuation methods to produce synergies that can improve and simplify the economic valuation of public investments.
1
Carlo Giupponi, Department of Plant Production University of Milan and Fondazione Eni Enrico Mattei, Paolo Rosato, Department of Civil Engineering, University of Trieste and Fondazione Eni Enrico Mattei, Anita Fassio and Margaretha Breil Fondazione Eni Enrico Mattei, Venice. Research financed by the Fondazione Eni Enrico Mattei.
The economic model used in this paper is based on a “hybrid” value function developed using multiple criteria analysis and is sufficiently precise to evaluate the impact on property value of small variations of environmental quality.
The definition of the model requires identification of all the elements which influence the market value and their weights in the specific local situation. To identify these elements and their weights, local property market experts were asked for their opinions2.
The evaluation model was encoded in a Geographical Information System (GIS) that manages the spatial relations between objects (e.g. buildings, public works, environmental goods) and a set of digital maps of the northern part of the Venice Lagoon created ad hoc for this purpose3. On this basis it is possible to analyse and simulate the interactions between the territorial system and market realities, i.e., in this case, to analyse the effect of environmental variations induced by public works on the value of the property stock. The integration of GIS and evaluation model is particularly useful and efficient for analysing the property market because property values depend a great deal on location.
The above described model was applied to the evaluation of some hypotheses of urban and environmental improvement works on the main inhabited islands located of the Venice Lagoon: Burano, Murano and S. Erasmo.
The paper is organized as follows. Chapter 2 gives a short overview onto the geographical context in which the model has been implemented, the major islands of the northern part of the Venetian Lagoon, Chapter. 3 is dedicated to methodological aspects of the hierarchical model, a description of the GIS model realised follows in Chapter 4, and Chapter 5 describes the simulations and the results, leading to the conclusions of Chapter 5.
1. The case study
The three islands considered within the research, Murano, Burano and S. Erasmo are situated north of the historical centre of Venice. Their local contexts within each island differ greatly in terms of position in the lagoon, property characteristics and services. Murano is very close to the city of Venice, while Burano is much further away. S. Erasmo is in an intermediate position, but is rather isolated. Access from the mainland to Murano is from Tessera, using the airport links, whereas
2
Interviews have been carried out with real estate agents operating in Venice familiar with the specific situation of the islands. The authors would like to express special gratitude to each of them, and especially to Riccardo Maione.
3
The authors are grateful to the Urban Planning Board, and the Tidal Forecast and Signalling Office of the Venice City Council, CORILA and INSULA for making their digital elaborations available.
connections to the mainland of Burano and S. Erasmo are situated on the Cavallino coast, landing at Treporti and Punta Sabbioni.
A second distinguishing element of the three islands is property characteristics and their land use. S. Erasmo is essentially a farming island with few inhabitants and most dwellings, with the typical characteristics of rural buildings, scattered between the cultivated fields. In the centre of the island there are few buildings and minimal public and private services: bank, church, one shop. For other services, the inhabitants of S. Erasmo depend on other islands and the mainland (Treporti and Cavallino). Murano bears many signs of the glass industry: there are large factories, now almost entirely abandoned, and residential buildings, few of which date back to pre-industrial times. Burano has maintained the characteristics of an old fishermen’s settlement, with the traditional lagoon morphology along the canals and fields, and with fairly small buildings. The services are much more complete on Murano and Burano where daily needs, both private (shops, banks, etc.) and public (schools, primary health care, local council offices), are met.
The real estate market of Murano is in some way linked to that of the city of Venice: it follows the same trend but has lower quotations. The residential market of the island of S. Erasmo and, to a lesser degree, that of Burano is instead almost exclusively limited to the resident community. Especially on S. Erasmo, where sales are rare, the estate agents seldom learn about transactions between the islanders. However, on S. Erasmo the purchasers often come from outside the island. This demand comes mainly from residents of the historic centre of Venice searching for a second home for weekends or short holidays and for indulging in hobbies linked with nature (gardening, horticulture, small animal or fish rearing). It is particularly interesting for the present approach as it better evaluates the quality of the environment surrounding the buildings, and the market results more transparent because for these transactions professional help is frequently requested, so that real estate agents are able to depict the situation more precisely. Because it is tied to local demand, the agents declare that this market, unlike that of Murano, has not been substantially involved in the recent boom in property values that has occurred in the city of Venice.
The two types of demand consider different factors in the formation of market values. The residential demand considers the ease of reaching the island from the city of Venice and from the mainland and the location within the island, while the demand for second homes, which is less dependent on systematic transfers (work, study, etc.), gives less importance to these aspects. In contexts like S. Erasmo the availability of a private boat berth also appears to be important, as boats compensate for scarce connections of public transport and can be used for leisure trips around the lagoon. Public transport from the city of Venice connects the islands with the Fondamente Nuove area, with services varying a great deal from island to island: Murano has more than 200 daily
connections with the city of Venice, while the number drops to 43 for Burano and 26 for S. Erasmo. Travelling times are 15 min for Murano, 30 for S. Erasmo and 40 for Burano. The islands are also connected to the car-parks at Treporti (for Burano and S. Erasmo) and the International Airport (for Murano). Given the size of S. Erasmo, the centrality with respect to the island and three landing stages is of greater importance than on Burano and Murano, where distances are fairly short and all parts of the islands are within walking distance.
Another important factor indicated by the experts regards the size of the property: given that the demand on the islands does not appear to be very moneyed, the size limit of properties which are easily sold on the market are quite low4: the optimal size is generally around 60 – 70 m2. On S. Erasmo, this arouses interest in rustic outbuildings or anyway small buildings that can be renovated for residential use. Land suitable for vegetable growing, channels for fish-farming, the proximity to hunting or natural areas also appear to be much appreciated. For Burano and Murano the historical-architectural context and open spaces that can be used as gardens or vegetable patches are more appreciated. The residential demand also assigns a lot of weight to the availability of services such as shops, banks, schools, health services, etc. Lastly, the level of exposure to high water is an important factor for residential demand, penalising buildings located in frequently flooded areas.
2. The economic valuation model
The economic valuation model developed in this work is an improvement of a prototype previously set up to evaluate ex ante the impacts of improvement works planned on the island of S. Erasmo (Rosato et al., 2003). In that case, the estimate of the value was based on a function that generates the value of the properties, using the pair wise comparison approach for determining the weights of each characteristic on the market value and subsequently calibrating the model on the local property market data. This study uses the same approach, revising the variables and parameters of value function on the basis of new and more precise information gathered from experts and in relation to the specific characteristics of the islands of Murano, Burano and S. Erasmo.
Residential property values depend on many characteristics, each of which is appreciated in a different way on the market (Rosen, 1974). Modifications of any of these characteristics produce variations of the market value. The market prices of the properties can therefore be analysed by a breakdown of the specific characteristics of each dwelling and corresponding prices. This analysis
4
This is confirmed by the fact that in recent years large houses (and consequently higher priced than normal) have remained unsold.
of the “composition” of the properties and relative prices can be used to identify the marginal price corresponding to given characteristics, in this case those of the area where the dwelling is situated. Having said that, the variation in values induced by an upgrading intervention on a given site is equal to the sum of the variations in value that have been verified for each of the buildings on that site, i.e.:
∑
∆ = ∆ j j V V (1) where:∆ V = difference in value on the site induced by the investment;
∆ Vj = difference in value of building j before and after the work.
The difference in value of each building j can be measured in terms of value per m2, thus allowing a comparison with other buildings. The difference in value derives from the size and the difference between the unitary value with and without the public investment:
(
uic ujs)
j j D V V V = − ∆ (2) where: Dj is the size of the property unit j (m 2
);
V
ujcrepresents the value per m 2
of property j with the investment.
V
ujsrepresents the value per m 2
of property j without the investment;
As mentioned above, this procedure is based on the hypothesis that the value per m2 of properties can be expressed as a function of their characteristics. That is:
Vu
j = f (xij) (3)
where:
Vu
jis the estimated value of the j-th good;
x
ijis the state of the i-th characteristic of the j-th good.
Now the basic problem is the construction of the value function f(x
ij). The approach proposed uses a
multiple criteria evaluation model, fed by judgements from experts, and calibrated on the basis of available market data. The estimate of the value function requires two stages: the first estimates a cardinal indicator function, I
j, of the characteristics of the good, through which to create a ranking
of the goods being evaluated: I
j = g(xij); the second estimates a function h(Ij) which gives a
Vuj = h(Ij) (4)
The cardinal indicator I
j was estimated using a procedure of hierarchical breakdown and
re-composition of real estate characteristics that includes: 1) identification of all the i characteristics (x
ij) which influence the value of the j-th
good considered;
2) classification of the characteristics and aggregation in criteria and/or families of criteria (A);
3) elicitation of the weights (w) which express the relative importance of the various characteristics at each level of hierarchical breakdown5.
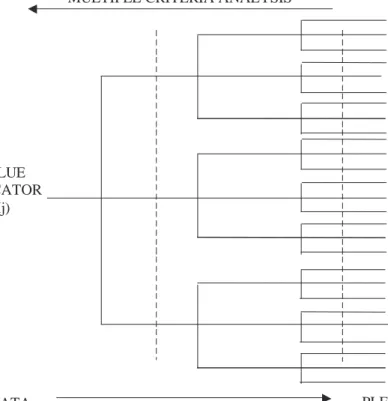
The first two points were solved referring the literature on property valuations (Curto, 1993, 1994a), which has fixed and classified the characteristics affecting property value, especially residential. All the elements affecting the value were analysed and organised hierarchically. This approach permits the identification of relationships between the basic characteristics and the value, representing the way in which the market summarises and appreciates the various aspects of the considered goods. The structure of the hierarchy model can thus be represented by diagram in form of a tree (see fig. 1).
5
The weights, in an additive multiple criteria model, represent the trade-off between the different evaluation parameters. In the case of models of the weighted sum type, in the hypothesis of independence of the preferences, the weights can be considered factors of scale (Bouyssou et al., 2000).
VALUE INDICATOR
(Ij)
FEW DATA
ECONOMETRIC ANALYSIS PLENTY OF DATA
B A S IC C H A R A C T E R IS T IC S
MULTIPLE CRITERIA ANALYSIS
Figure 1: The structure of the value function.
The third point was solved using the pairwise comparison technique (Saaty, 1980) with the collaboration of panels of experts who expressed a judgement on the relative importance of the various elements in the hierarchy model (for details see Rosato et. al., 2003).
To gather the information necessary for organising the hierarchy model and obtain judgements on the importance of the various characteristics, some real estate agents working in Venice were contacted. An initial telephone survey to all the FIAIP6 affiliated agents operating in Venice allowed to select those who were familiar with the situation characterising the northern lagoon and specifically with the major inhabited islands (Murano, Burano, S. Erasmo). Semi-structured interviews were then conducted with the aim of obtaining a description of the market and the specific factors relevant to the local context.
6
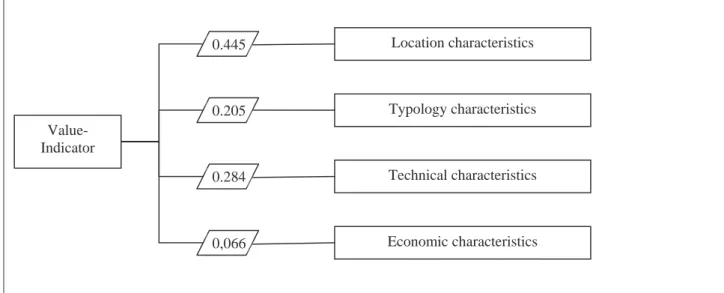
On the basis of the information gleaned from the real estate agents, the characteristics influencing the value have been listed in a hierarchical way, grouping them according to the following classification: 1) location; 2) typology, 3) technical, and 4) economic.
The location characteristics include accessibility to the property from outside the island (distinguishing access from the mainland from that of the city of Venice) and on the island itself; the presence of both public and private services; the frequency with which the property is exposed to high water; environmental qualities, such as salubrity and landscape quality.
The typology factors include the type of building, its size, view, exposure and outbuildings.
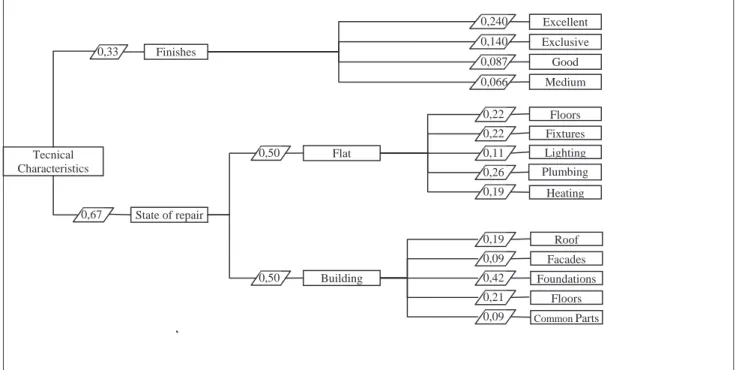
The technical factors summarise the finishes and state of repair of the living area (floors, fixtures, plus heating, plumbing and lighting) and building (roof, walls, attics, foundations and common parts).
Lastly, the economic characteristics consider flexibility with regards to destination of use and the possibility of maintenance, restoration, renovation works etc., as laid down by the building regulations.
The result of this procedure is a value function g(•) which, applied to the characteristics (x
ij) of each
property, allows the indicator I
j to be estimated for the considered good. Given the logic of the
method, the value function assumes the following form:
∏
∑
= = = = l k ki i n i i ij j w c with c x I 1 1 (5) where:k are the hierarchical levels considered in evaluating the contribution of characteristic i to the
value;
x
ij is the performance of the j th
good with respect to the ith characteristic;
w
ki is the weight of the i th
characteristic at the kth hierarchical levels;
c
i is the aggregate weight of the i th
characteristic.
The panel of experts organized during the research provided the fact-finding elements for the assignment of weights using the pairwise comparison technique, expressing the relative importance according to the Saaty scale of 9 levels (equally, moderately, strongly, very strongly, extremely more/less important; and an intermediate level between each of these values). The location
characteristics were evaluated first as these were considered central to the evaluation of modifications in the values associated with the environment changes. The weights relative to the location, typology and economic characteristics were then defined (Fig. 2)7.
Figure 2 Hierarchy model for the estimate of value on the islands in the Venice Lagoon: main categories
The experts estimated that the location characteristics which include both elements of environmental quality and other context elements like services, accessibility and exposure to high water, contribute approx. 44.5% to the unitary value, the typology characteristics (type, aspect/exposure, size, view and outbuildings) approx. 20.5%, the technical ones 28.4%, while only 6.6% is attributed to flexibility with respect to modification of destination of use and structural interventions. Also within the typology characteristics the sub-division of weights resulted as being similar for all three contexts, with 17.3% attributed to accessibility, 2.9% to the frequency of high water, 9.7% to the availability of services and 14.5% to environmental quality.
7
The initial attempt to find homogeneous value judgements for all three islands (Murano, Burano and S. Erasmo) met some resistance from the panel, who denied the possibility of reaching uniform weights for such different contexts. The preferences were therefore expressed relative to each island, leading to three separate “prototypes” of the value model. However, at the end of the evaluations it was argued that the differences between the three contexts did not translate into the weights assigned to the different categories of criteria, which resulted as being practically identical in the three models. These were therefore re-aggregated in a single hierarchy model
Location characteristics Typology characteristics Technical characteristics Economic characteristics Value-Indicator 0.205 0.445 0.284 0,066
Figure 3 Location characteristics, a schematic representation
Exposure to high water assumes – as verified in a previous research on S. Erasmo alone - a relatively minor role, taking less than 3% of the total weight of the elements forming the location component of the value. Once the value indicator (I
j) has been determined for each property, its
monetary equivalent is to be estimated.
Location Characteristics Access fr. outside Internal access Public Services Private Services Mainland Venice Salubrity Landscape Air Water Noise High Water 0,066 Access 0,066 Services 0,066 Environment 0,066 0,778 0,4 0,222 0,4 0,4 0,4 0,4 0,6 0,2 0,4 0,4 Never .... 3 times/year 0,415 0,033 Abandoned Cultivated Gardens Recent scattered Historic scattered Centre 0,049 0,105 0,302 0,083 0,203 0,258
Figure 4 Typology characteristics, schematic representation
To do this it is necessary to gather market prices for some of the jth goods for calibrating the function (4). Typology Characteristics Detached house Terraced house. Semi-det. house. Farmhouse Flat indip. entr.
Flat Flat Blocchetto
Loft Flat Piano Nobile 0,087 0,066 0,049 0,240 0,140 0,039 0,133 0,065 0,181 0,066 Typology 0,03 Exposure 0,28 View 0,35 Outbuildings 0,113 Dimension 0,312 0,280 0,127 0,280 80 -120 m2 > 120 m2 <50 m2 50 – 80 m2 East North South West 0,467 0,160 0,095 0,277 0,158 0,199 0,069 0,038 0,122 0,039 0,205 0,044 0,126 Lagoon Roofs Canal Gardens Courtyard Palaces Calle Fields Sea Courtyard Shed Boathouse Berth Garden 0,260 0,124 0,248 0,248 0,119
Figure 5: Scheme of the technical characteristics considered
The value function can be calibrated in different ways according to the number of known market prices: the estimate can be made by interpolation with linear or polynomial functions (e.g. weighted
sum) or introducing function as of increasing complexity.
Figure 6: Scheme of the economic characteristics
The complexity of the function that transforms the value index into sums of money also depends on the number of market data available. With few data, mono-parametric procedures can be used, while multi-parametric techniques can be used when more data are available.
It should be noted that the use of multi-parametric techniques allows to shift the weights evaluation from the experts’ judgement to the econometric analysis, moving from technical analysis methods towards economic analyses (see Figure 1). Therefore the more market data is available, the more aspects can be evaluated with statistical analysis. In this way a fairly flexible hybrid model was
Economic Characteristics Scarce Medium Good 0,163 0,297 0,540 Structure 0,50 Dest.of Use 0,50 0,062 0,109 0,161 0,251 0,417 Renovation ……. Extension Maintenance Restoring Tecnical Characteristics Fixtures Lighting Plumbing Heating Floors 0,22 0,22 0,11 0,26 0,19 State of repair Finishes 0,33 0,67 Excellent Good Exclusive Medium 0,087 0,066 0,240 0,140 Flat Building 0,50 0,50 0,19 0,09 0,42 0,21 0,09 Facades Foundations CommonParts Roof Floors
created that can take into account aspects which would be difficult to consider in a statistical analysis and, at the same time, appropriately using the available market information.
The model calibration on the market value was carried out starting from the information (prices and descriptions) collected on the sales registered in the last year on the islands of the northern lagoon. These properties were evaluated with the hierarchical model, translating the description of their characteristics into scores using the weights given to the characteristics in the hierarchical model. In this way an overall “scoring” was estimated, which can be correlated with the price per m2 registered in market transactions. An equation was subsequently estimated to convert the indicator of value (I
s) into values per m 2
. Given the scantiness (12) of the transactions, a simple linear interpolation of prices per m2 and indicators calculated by the model was performed:
bI a
Vu = + (6)
The parameters of the equation are reported in the following table.
Param.. Coefficient Stand. Err. t -stat
a 375,99 145,93 2,577
b 7094,38 2002,92 3,542
Table 1: Calibration of the hierarchy model
The value function obtained provides reasonable results (see fig. 7): the market values range from 900 €/m2 for properties in the hypothetically poorest condition on S. Erasmo to almost 4200 €/m2 for the hypothetically best apartments on Murano (year 2003).
Figure 7 From value indicator to market value
Considering equation (6) the difference in overall value is equal to the product between the differences in value per m2 of the buildings j and the relative size, i.e:
(
)
∑
− = ∆ j js jc jc b I I D V * (7) where:Dj is the size of the property j;
Ijc value indicator at j with the intervention;
Ijs value indicator at j without the intervention.
3. The implementation of the economic model in a GIS environment
The model described in the previous chapters was implemented in a geographical information system, within which the distribution of values in the islands was mapped and the spatial distribution of variations caused by the hypothetical improvements was simulated. The GIS was used for mapping functions and, especially, for the analysis and interpretation of the data processed by the spatial model. The following functions were used:
•
query and filtering using Structured Query Language (SQL);Vu (€/m2) 4.196,4 6 906,46 I Min (0,074773) (0,53852)I Max
• elaboration with mathematical operators to build simple territorial models through the application of functions to the database;
•
context analyses with distance operators, which generate buffer areas, least cost pathways and spatially interpolated data;•
statistical analyses for efficient processing of the input data to produce general results and concise indicators of distribution, variability, etc.Using these procedures, the hierarchical structure of the value function was implemented into a GIS that geographically locates the relevant factors for the real estate values. The overlay of layers was implemented using the weights determined within the hierarchical model8.
The implementation of the evaluation model in a GIS environment faced a number of problems:
• the study, being extended to different environmental components, involved the management and processing of a large amount of data;
• the limited availability of data ready to use caused a lot of preliminary work of database construction, in order to create the missing thematic layers and to provide the interoperability necessary for spatial analysis;
• the high resolution of the maps (1 m), determined long processing times and produced large amounts of data.
The GIS evaluation procedure was organised in four basic stages: in the first the model inputs, i.e. the thematic maps of technical parameters of the evaluation, were collected,. In the second stage the evaluation procedures of the “weighted linear combination” type were structured and solved. The third stage consisted in simulating the two scenarios that represent possible future environmental changes and their effects on the property value on the three islands as a whole. In the last stage the value variations of the residential properties induced by the improvement scenarios were calculated. The procedures were created within the Macro Modeler function of the GIS Idrisi Kilimanjaro software, a graphical modelling environment in which it is possible to assemble and run multi-step analyses (fig. 6). The entire logical procedure for analysing the problem and solving it can thus be visualised and edited and re-processed at any step, in a consistent and transparent way.
8
To integrate the location, typology, technical and economic characteristics of the hierarchical model in the GIS model, for each island, constant average characteristics were taken for all the buildings, attributing, as a first approximation, the same values for the typology, technical and economic characteristics to all the buildings of the same island. This assumption could be refined in the future with the identification of homogeneous areas for building/urban characteristics, or by creating a detailed database for each residential building on the islands.
Figure 8: The Macro Model used for the creation of the maps
The first drawing-up stage of the input maps involved an onerous preliminary phase of acquisition of the basic data and data pre-processing, which led to the formation of a GIS structured according to the evaluation model.
The maps representing the location factors created were: 1. internal accessibility (time);
2. external public and private accessibility (time); 3. landscape (classes);
4. noise (classes); 5. air quality (classes) 6. water quality (classes);
7. frequency of high water (events per year);
8. availability of public and private services (dummy); The thematic layers created for the analysis phase are:
1. value per m2 for each island;
2. residential housing (binary map and map of built-up areas); 3. net surface area of the residential properties,
The data base was derived from existing digital maps and from direct digitalisation, as in the case of the landscape layer9 or from the combination of different information sources. For example, information on land heights and frequency of high water were integrated to create the layer relating to flooding frequency. The Local Council Acoustic Classification Plan10 was used for identifying and delimiting the classes of exposure to noise on S. Erasmo and Burano, while for the island of Murano, similar buffers along the main canal banks were created ex novo (decreasing levels of noise proceeding from the banks to the inland).
The Idrisi module “Cost Analysis” was performed to come up with accessibility maps. At first reference points for the external and internal access for each island were identified: the main landing of each island were used for this11 purpose. Journey times from the official public transport timetables were combined in a single “travel cost” layer with journey times on foot on the island. Similarly, but with greater complexity, the maps of private internal and external accessibility were created with a model of spatial movement in terms of progress along a route taking into account journey times along the navigable canals at the speed limit of each stretch12. External accessibility by private transport was calculated between each island and the respective destinations represented conventionally by the landing at Fondamente Nuove, as reference for the journeys to and from Venice for all three islands and, for journeys to the mainland, by the Treporti landing for S. Erasmo and Burano, and that of Marco Polo Airport at Tessera for Murano.
Direct on-site measurements and direct digitalisation were necessary in some cases, such as for surveying the presence and location of specific public and private services for Murano, Burano, and S. Erasmo.
The construction of the subject plans described in the previous section led to the drawing-up of factor maps. These maps are produced in a raster grid format with a resolution of 1 meter. As already mentioned, these maps represent the quantitative parameters referring to the current status or the possible future situations according to the different hypothesised scenarios.
In order to be used in the evaluation these maps must be re-elaborated using functions which convert the value of every parameter in each cell into the corresponding value expressed by scores
9
For the landscape layer aerial photographs of the lagoon provided by CORILA and the Regional Technical Numerical Map were used, digitalising to monitor the areas relative to the different landscape categories used: historical centre, recent scattered buildings, historic scattered buildings, uncultivated, gardens and farmland.
10
The plan can be consulted on the Venice City Council website on
http://194.243.104.176/website/rumore/viewer.htm.
11
The landing of Fondamente Nuove, Murano Museo, S. Erasmo Capannone and Burano were used as references. 12
The following journey speed factors were adopted: 11 km/h for private boats (average speed limit on the channels in the lagoon) and 5 km/h for journeys on foot on the islands, and 12 km/h for journeys by bicycle on S.Erasmo.
deriving from the economic evaluation model. For this, an approach based on the creation of look up tables was adopted, the values of which express the one-to-one relationship between the values of the factor maps and those of the evaluation criteria, in terms of scores to be assigned on the basis of continuous or discrete value functions. This approach represents a strongpoint of the methodology in terms of facilitating the simulations as the tables can be edited or substituted to simulate the effect of different scenarios, to implement any future developments in the evaluation model or to update currently available data.
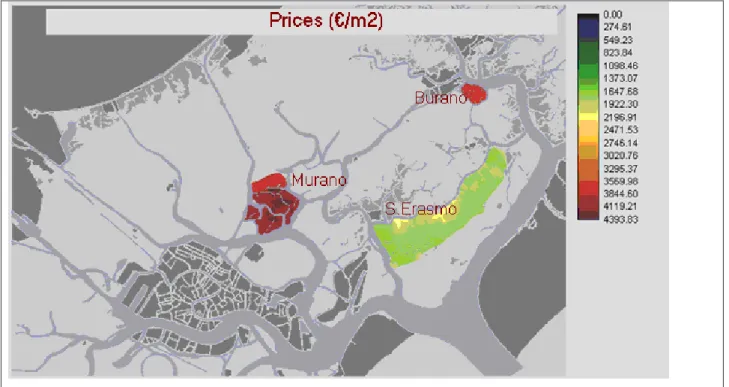
Figure 9: Map of current market values in €/m2
The hierarchical multicriteria combination of the factor maps was done, as mentioned above, with the simplest approach, i.e., the weighted sum of factor maps (criteria) on a pixel-by-pixel basis, implementing the weights determined within the economic valuation model. The global index value I was thus obtained for each cell of the analysed territory13, i.e., all the 1 x 1 m cells lying within residential buildings. Applying the formula of calibration (6) representing distribution of average property values per m2 (Figure 9) The values obtained with the evaluation vary from approx 1.300€/m2 in the island of S. Erasmo to approximately 4.200€/m2 in some parts of Murano. The real estate agents operating in Venice have confirmed these values.
Average values amount to about 4.050€/m2 on Murano, 3.802€/m2 on Burano and 1.812 €/m2 on S. Erasmo.
13
The Weighted Linear Combination was done using a mathematical model built with the modulus Image Calculator in which the summation notation operations of the products of the factor maps and relative weights were combined.
The highest value registered for the island of Murano corresponds to an inner area of the island, therefore undisturbed by water traffic, but close to the ACTV "Museo" landing stage, used as reference for evaluating the criterion of internal accessibility. The variation of the values within the island mainly reflects the different susceptibility to high water: the area with maximum values in fact corresponds to an area in which the probability of flooding is less than one event every 100 years. In the same way a second area with high values is registered, although with lower levels, to the south-west of the first area, in a relatively high part of the island (around the church of S. Pietro). For the same reason relatively high values are registered in the strip of open land to the north-west of the island (Sacca Serenella). It does not have very good internal accessibility or views, but has little exposure to high water (less than one event every 100 years).
A more homogeneous distribution of values is registered on Burano. In this case the criterion of exposure to high water did not determine any difference, in that the very few data available place the whole island below the level where at least three floods per year would be expected, thus attributing the worst value for this criterion to the whole island. The differences in values within the island are due to variations in accessibility to the ACTV landing stage, the landscape-urban characteristics and, lastly, exposure to noise, with the highest values in the western part of the island.
There is an analogous distribution, although on much lower values, on S. Erasmo. The highest values are not found in the village, but in the north-west because of the splendid view, good accessibility and height above sea level. Against this, the lowest values are registered at the northern and southern tips of the island, with the exception of the area around the Torre Massimiliana and the beach, because of the higher urban and landscape value.
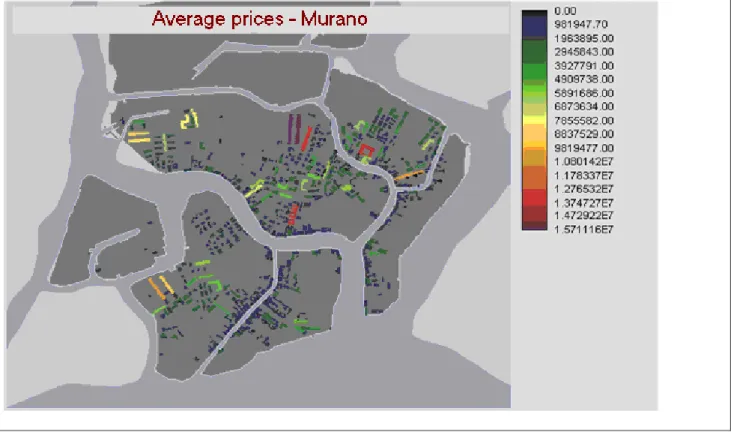
Lastly, the final value map and built-up area map were combined to obtain the map of average values for each building (Figure 10) and, consequently of the building stock distribution.
Figure 10: Map of average values of residential buildings, the example of Murano
4. The evaluation of the improvement scenarios
The model was used to estimate the effects of different public investment projects for the northern Venice Lagoon. Two scenarios of public investments which are currently under discussion or at the realisation stage and could have an impact on property values on the islands were defined: the first scenario alters modes of access to the islands through the construction of a ”subway” under the Lagoon; the second eliminates the flooding problem of intermediate high water (< 120 cm), on all three islands, through widespread raising of the pavements.
The variations caused by the scenarios compared to the current situation were estimated for each indicator used for determining the value.
These changes mainly regard the location factors. Table 2 illustrates the value factors taken into consideration and the ways in which the changes foreseen in the scenarios affect the island contexts. Factors remaining unvaried are indicated with an “-”, and those which slightly or significantly improve, with a “+” or a “++”.
The results consist in the computation, for the whole area, of absolute values and differences of values generated by the transformations simulated. Spatial distribution of increments and decreases
as well as of absolute values can be represented in two ways: either as unitary values, or as capital values whenever the values were associated to the commercial surfaces of existing buildings.
Factors Scenario 1
Subway under the lagoon
Scenario 2
Protection from high waters < 120 cm Murano + -Burano - -Access to Venice S. Erasmo - -Murano ++ -Burano - -Access to the mainland S. Erasmo - -Murano - + Burano - + Internal access S. Erasmo - +
Exposure to high water - ++
Public services -
-Private services -
-Air quality +
-Water quality +
-Level of noise ++
-Table 2: Indicators considered in the outlining of the scenarios (- unvaried, + slight improvement, ++ significant improvement.)
5.1 First scenario: a subway under the Lagoon
The first scenario includes modification of the accessibility system and revival of the Arsenale area with the creation of the so-called “Città Bipolare” (bi-polar city)14. Most likely, a “subway” will connect the Arsenale with Tessera and Mestre town centre, via the Fondamente Nuove and Murano. Access to Murano would therefore be facilitated; the island would become easily and speedily reachable from the mainland and from Venice (Fondamente Nuove), and from the developing area of the Arsenale. The impacts of this new access route on the other islands of the northern lagoon could be positive and override the current access methods: integration of the point of arrival of the subway at Murano and that of the water transport system to Burano and S. Erasmo as part of a multimodal system could alter the current orientation of these islands towards the mainland of
Cavallino and make the access to Mestre town centre or Tessera more important. From the geographical modelling point of view, this scenario can be considered as the effect of a “point perturbation” on the territory, i.e. directly focussed on the access to Murano, given that external access to the island will alter significantly. Within the model of the formation of property values these transformations would regard the following criteria relative to the island of Murano15:
• Access from the mainland: the increased number of trips and shortened journey times justify an “optimal” judgement in place of the current “good”. Access from Venice: the current judgement, in comparison with the other islands, is already “optimal” and would therefore not modify.
• Noise: the strip along the Murano Grand Canal and along the west coast of the island, which currently suffers high noise levels due to private and public transport, would obtain a better judgement, shifting from “bad” to “average”.
The modifications introduced by the subway project produces a clear effect on the values on Murano due to the improvement of external accessibility. The “optimal” level is therefore reached, not only concerning the links with Venice, but also with the mainland, thanks to the more frequent and rapid connections. Estimates also increase in the strips along the major canals of the island which benefit from the reduction in water traffic in terms of reduced noise levels. The value increases generated in the first scenario, for Murano, vary from 5 to 6%, with higher values in the areas along the southern (Colonna area) and northern canals (Sacca Serenella) of the island where initial values were lower.
5.2 Second scenario: protection from intermediate high water
The second scenario hypothesises a generalised defence of the whole lagoon from high water, simulating works of raising the banks and/or defence of low-lying land on the three islands to prevent flooding were simulated with a modification of the attribute relative to the frequency with which a site is exposed to flooding. Involving the three islands, this scenario represents a general perturbation effect.
Based on projects and work underway on Murano and Burano, the effects of the interventions on areas lower than 120 cm a.s.l. were considered, while for S. Erasmo all areas lower than 160 cm
14
The project “Città Bipolare” intends to connect the area of the Arsenale in the historic centre of Venice with the international Airport on the mainland. The connection will consist in a subway line running under the lagoon for transport of persons and goods. (http://www.comune.venezia.it/urbanistica/home.asp)
15
The effects on the other islands will not be considered because the available projects do not permit an adequate evaluation of the effective impacts.
a.s.l. were used in the simulation. On this basis, the estimate of flooding frequency reduces to once per year for Murano and Burano and once every 10 years for S. Erasmo.
The differences in values generated with this simulation are quite low for the islands of Burano and Murano: 0,1%. The effect extends uniformly over the whole island for Burano, whereas in Murano the effects are limited to some areas which lie beneath 120 cm a.s.l.. On S. Erasmo, where on the one hand the improvement is greater and, on the other, the initial values were much lower, increases vary between 5.5 and 7%, with an average of 5.9%.
The lack of incisiveness on property values estimated with the evaluation model on Murano and Burano has various causes: in first place the simulated improvement does not drastically reduce the number of floods; at 120 cm a.s.l. there is still a probability of flooding once per year. The effect is slight because the model was applied to the values of whole buildings and not just the ground floors: high water has obviously greater effect on the value of ground floor properties. Therefore higher increases would be obtained if ground floors alone would have been taken into account. Lastly, it should be remembered that this study was applied only to residential properties, so the economic effects on businesses are excluded.
Figure 11 Maps of scenarios and differences in values generated
Simulation of scenarios Absolute variations Variations in percentage
5. Conclusions
The evaluation model proposed for estimating property assets based on the hierarchical breakdown and recomposition of the characteristics determining the value, has provided reasonable results for the main islands of the Venice Lagoon. Although the valuations presented in the preview chapters represent a first attempt, the results can be considered encouraging for future operational application of the methodology.
The most important advantage of the model presented is the possibility to rapidly obtain evaluations of the economic effects of modifications of urban asset and showing the distributions over the territory. Actually, the integration of the economic evaluation and geographical models gave interesting synergies. The prices and their variations obtained with the application of the value function are realistic, and their spatial distribution realistically mirrors the differences observable in the island of the Venice Lagoon. Furthermore, the simulation of the interventions seems to provide realistic estimates of the economic value of the benefits produced with urban improvement interventions.
The procedure is also transparent and intuitive and fully uses all the information available, both qualitative and quantitative, and rigorously incorporates the expertise of those familiar with the socio-economic reality studied. Of particular interest is the possibility of continuously refining the hierarchical model as new market information and/or new expert judgements become available, via recalibration of the value functions and new simulations of the spatial model. At the same time, the improvement of the GIS information utilised may be realised through the integration of new databases and, where necessary, more specific surveys. The synergies between a more accurate value function and more detailed location data will definitively improve the quality of the output of the proposed procedure.
Obviously this approach has some limits which can in part be attributed to the hierarchical approach to the property evaluations, as already expressed by Rosato et al. (2002), i.e., its potential subjectivity which derives from the fact of being based on the judgements of experts, who, despite a careful selection of the panel, may be not entirely representative of the examined market. Regarding this point refinements of the model are to bet considered, first of all with a wider and more systematic involvement of local experts with the acquisition of more market data. This will permit a more precise estimate of the value function, moving the evaluation from the expert judgements base to the econometric one. At this regard, it must be remembered that this model cannot be considered in general as a substitute for the more accurate classic hedonic model but can provide a useful
support when the low availability of market data does not permit any other type of value function appraisal.
References:
Bouyssou D., Marchant Th., Perny P., Pirlot M., Tsoukiàs Vincke Ph. (2000) Evaluation and
Decision Models: a Critical Perspective, Kluwer Academic Publishers, Dordrecht.
Brochier, F., Giupponi, C. (2001) Integrated Coastal Zone Management in the Venice Area. A
Methodological Framework; Fondazione Eni Enrico Mattei, working note 100.
Chattopadhyay S. (1999) “Demand for Air Quality in Chicago”, Land Economics, vol.75, n. 1. Curto R. (1993) “Qualità edilizia, qualità ambientale e mercato immobiliare: un'applicazione della
Multiple Regression Analysis (MRA) al caso della città storica", XIV Conferenza Italiana di Scienze Regionali, Bologna 4-5 October 1993.
Curto R. (1994a) “La quantificazione e costruzione di variabili qualitative stratificate nella Multiple Regression Analysis (MRA) applicata ai mercati immobiliari”, Aestimum, special number, Florence, June-December.
Curto R. (1994b) “L’uso delle tecniche multicriteri come procedimenti pluriparametrici: il sistema dei confronti multipli di Saaty”, Genio Rurale, n. 9, September.
Defrancesco E., Rosato P., Rossetto L. (2002) “Il danno ambientale ex art. 18 l. l. 349/86: Aspetti
teorici ed operativi della valutazione economica del risarcimento dei danni”, Manuali e
Linee Guida 12/2002, ANPA – DIREZIONE, Rome.
Desvousges W. H., Naughton M. C., Parsons G. R. (1992) “Benefit Transfer: Conceptual Problems in Estimating Water Quality Benefits Using Existing Studies”, Water Resources Research, vol. 28, n. 3.
Garrod G. D., Willis K. G. (1992) “Valuing Goods Characteristics: an Application of the Hedonic Price Method to Environmental Attributes”, Journal of Environmental Management, Vol. 34, January.
Giupponi C., Coletto L. (1993) Creazione di mappe di “suitability” e rilievi sperimentali in ambiente GIS per il re di quaglie (Crex crex L.) in provincia di Belluno. L'informazione territoriale e la dimensione tempo (7a Conferenza Nazionale ASITA). II, 1209-1214. Kirchhoff S., Colby B., LaFrance J. (1997) Evaluating the Performance of Benefit Transfer: An
Empirical Inquiry. Journal of Environmental Economics and Management, 33, 75-93. Loomis J. (1992) The evolution of a More Rigorous Approach to Benefit Transfer: Benefit Function
Transfer. Water Resources Research, Vol. 28, 701-705.
Rosato P., D’Apaos C., Marella G.,. Stellin G (2002) La valutazione ex-ante degli effetti sul valore immobiliare di interventi di salvaguardia ambientale: un approccio edonico-gerarchico. La
Valutazione degli Investimenti sul Territorio, Atti del XXXII Incontro di studio del
Ce.S.E.T,Venice, 11 October.
Rosato P., Stellin G. (2000) “A Multiparametric Model for Evaluating the Weight of Externalities on the Formation of Property Value”, in Brandon P., Lombardi P., Perera S. (eds), Cities
and Sustainability: Sustaining our Cultural Heritage, The Millennium Conference, Sri
Rosen S. (1974) “Hedonic Prices and Implicit Markets: Product Differentiation in Pure Competition”, Journal of Political Economy, n. 82.
Saaty T. (1980) The Analytic Hierarchy Process, McGraw Hill, New York.
Scarpa R. (1995) “Metodo del prezzo edonico per la stima delle variazioni di benessere per beni pubblici: lo stato dell’arte e l’applicabilità in Italia”, Aestimum, no. 33.
Smith K., Van Houtven G., Pattanayak S. (2002) Benefit Transfer via Preference Calibration: “Prudential Algebra” for Policy. Land Economics 78, 132 – 152.
NOTE DI LAVORO DELLA FONDAZIONE ENI ENRICO MATTEI Fondazione Eni Enrico Mattei Working Paper Series
Our Note di Lavoro are available on the Internet at the following addresses: http://www.feem.it/Feem/Pub/Publications/WPapers/default.html
http://www.ssrn.com/link/feem.html
NOTE DI LAVORO PUBLISHED IN 2003
PRIV 1.2003 Gabriella CHIESA and Giovanna NICODANO: Privatization and Financial Market Development: Theoretical
Issues
PRIV 2.2003 Ibolya SCHINDELE: Theory of Privatization in Eastern Europe: Literature Review
PRIV 3.2003 Wietze LISE, Claudia KEMFERT and Richard S.J. TOL: Strategic Action in the Liberalised German Electricity
Market
CLIM 4.2003 Laura MARSILIANI and Thomas I. RENSTRÖM: Environmental Policy and Capital Movements: The Role of
Government Commitment
KNOW 5.2003 Reyer GERLAGH: Induced Technological Change under Technological Competition
ETA 6.2003 Efrem CASTELNUOVO: Squeezing the Interest Rate Smoothing Weight with a Hybrid Expectations Model
SIEV 7.2003 Anna ALBERINI, Alberto LONGO, Stefania TONIN, Francesco TROMBETTA and Margherita TURVANI: The
Role of Liability, Regulation and Economic Incentives in Brownfield Remediation and Redevelopment: Evidence from Surveys of Developers
NRM 8.2003 Elissaios PAPYRAKIS and Reyer GERLAGH: Natural Resources: A Blessing or a Curse?
CLIM 9.2003 A. CAPARRÓS, J.-C. PEREAU and T. TAZDAÏT: North-South Climate Change Negotiations: a Sequential Game
with Asymmetric Information
KNOW 10.2003 Giorgio BRUNELLO and Daniele CHECCHI: School Quality and Family Background in Italy
CLIM 11.2003 Efrem CASTELNUOVO and Marzio GALEOTTI: Learning By Doing vs Learning By Researching in a Model of
Climate Change Policy Analysis
KNOW 12.2003 Carole MAIGNAN, Gianmarco OTTAVIANO and Dino PINELLI (eds.): Economic Growth, Innovation, Cultural
Diversity: What are we all talking about? A critical survey of the state-of-the-art
KNOW 13.2003 Carole MAIGNAN, Gianmarco OTTAVIANO, Dino PINELLI and Francesco RULLANI (lix): Bio-Ecological
Diversity vs. Socio-Economic Diversity. A Comparison of Existing Measures
KNOW 14.2003 Maddy JANSSENS and Chris STEYAERT (lix): Theories of Diversity within Organisation Studies: Debates and
Future Trajectories
KNOW 15.2003 Tuzin BAYCAN LEVENT, Enno MASUREL and Peter NIJKAMP (lix): Diversity in Entrepreneurship: Ethnic and
Female Roles in Urban Economic Life
KNOW 16.2003 Alexandra BITUSIKOVA (lix): Post-Communist City on its Way from Grey to Colourful: The Case Study from
Slovakia
KNOW 17.2003 Billy E. VAUGHN and Katarina MLEKOV (lix): A Stage Model of Developing an Inclusive Community
KNOW 18.2003 Selma van LONDEN and Arie de RUIJTER (lix): Managing Diversity in a Glocalizing World
Coalition Theory Network
19.2003 Sergio CURRARINI: On the Stability of Hierarchies in Games with Externalities
PRIV 20.2003 Giacomo CALZOLARI and Alessandro PAVAN (lx): Monopoly with Resale
PRIV 21.2003 Claudio MEZZETTI (lx): Auction Design with Interdependent Valuations: The Generalized Revelation
Principle, Efficiency, Full Surplus Extraction and Information Acquisition
PRIV 22.2003 Marco LiCalzi and Alessandro PAVAN (lx): Tilting the Supply Schedule to Enhance Competition in
Uniform-Price Auctions
PRIV 23.2003 David ETTINGER (lx): Bidding among Friends and Enemies
PRIV 24.2003 Hannu VARTIAINEN (lx): Auction Design without Commitment
PRIV 25.2003 Matti KELOHARJU, Kjell G. NYBORG and Kristian RYDQVIST (lx): Strategic Behavior and Underpricing in
Uniform Price Auctions: Evidence from Finnish Treasury Auctions
PRIV 26.2003 Christine A. PARLOUR and Uday RAJAN (lx): Rationing in IPOs
PRIV 27.2003 Kjell G. NYBORG and Ilya A. STREBULAEV (lx): Multiple Unit Auctions and Short Squeezes
PRIV 28.2003 Anders LUNANDER and Jan-Eric NILSSON (lx): Taking the Lab to the Field: Experimental Tests of Alternative
Mechanisms to Procure Multiple Contracts
PRIV 29.2003 TangaMcDANIEL and Karsten NEUHOFF (lx): Use of Long-term Auctions for Network Investment
PRIV 30.2003 Emiel MAASLAND and Sander ONDERSTAL (lx): Auctions with Financial Externalities
ETA 31.2003 Michael FINUS and Bianca RUNDSHAGEN: A Non-cooperative Foundation of Core-Stability in Positive
Externality NTU-Coalition Games
KNOW 32.2003 Michele MORETTO: Competition and Irreversible Investments under Uncertainty_
PRIV 33.2003 Philippe QUIRION: Relative Quotas: Correct Answer to Uncertainty or Case of Regulatory Capture?
KNOW 34.2003 Giuseppe MEDA, Claudio PIGA and Donald SIEGEL: On the Relationship between R&D and Productivity: A
Treatment Effect Analysis
ETA 35.2003 Alessandra DEL BOCA, Marzio GALEOTTI and Paola ROTA: Non-convexities in the Adjustment of Different
GG 36.2003 Matthieu GLACHANT: Voluntary Agreements under Endogenous Legislative Threats
PRIV 37.2003 Narjess BOUBAKRI, Jean-Claude COSSET and Omrane GUEDHAMI: Postprivatization Corporate Governance:
the Role of Ownership Structure and Investor Protection
CLIM 38.2003 Rolf GOLOMBEK and Michael HOEL:Climate Policy under Technology Spillovers
KNOW 39.2003 Slim BEN YOUSSEF: Transboundary Pollution, R&D Spillovers and International Trade
CTN 40.2003 Carlo CARRARO and Carmen MARCHIORI: Endogenous Strategic Issue Linkage in International Negotiations
KNOW 41.2003 Sonia OREFFICE: Abortion and Female Power in the Household: Evidence from Labor Supply
KNOW 42.2003 Timo GOESCHL and Timothy SWANSON: On Biology and Technology: The Economics of Managing
Biotechnologies
ETA 43.2003 Giorgio BUSETTI and Matteo MANERA: STAR-GARCH Models for Stock Market Interactions in the Pacific
Basin Region, Japan and US
CLIM 44.2003 Katrin MILLOCK and Céline NAUGES: The French Tax on Air Pollution: Some Preliminary Results on its
Effectiveness
PRIV 45.2003 Bernardo BORTOLOTTI and Paolo PINOTTI: The Political Economy of Privatization
SIEV 46.2003 Elbert DIJKGRAAF and Herman R.J. VOLLEBERGH: Burn or Bury? A Social Cost Comparison of Final Waste
Disposal Methods
ETA 47.2003 Jens HORBACH: Employment and Innovations in the Environmental Sector: Determinants and Econometrical
Results for Germany
CLIM 48.2003 Lori SNYDER, Nolan MILLER and Robert STAVINS: The Effects of Environmental Regulation on Technology
Diffusion: The Case of Chlorine Manufacturing
CLIM 49.2003 Lori SNYDER, Robert STAVINS and Alexander F. WAGNER:Private Options to Use Public Goods. Exploiting
Revealed Preferences to Estimate Environmental Benefits
CTN 50.2003 László Á. KÓCZY and Luc LAUWERS (lxi): The Minimal Dominant Set is a Non-Empty Core-Extension
CTN 51.2003 Matthew O. JACKSON (lxi):Allocation Rules for Network Games
CTN 52.2003 Ana MAULEON and Vincent VANNETELBOSCH (lxi): Farsightedness and Cautiousness in Coalition Formation
CTN 53.2003 Fernando VEGA-REDONDO (lxi): Building Up Social Capital in a Changing World: a network approach
CTN 54.2003 Matthew HAAG and Roger LAGUNOFF (lxi): On the Size and Structure of Group Cooperation
CTN 55.2003 Taiji FURUSAWA and Hideo KONISHI (lxi): Free Trade Networks
CTN 56.2003 Halis Murat YILDIZ (lxi): National Versus International Mergers and Trade Liberalization
CTN 57.2003 Santiago RUBIO and Alistair ULPH (lxi): An Infinite-Horizon Model of Dynamic Membership of International
Environmental Agreements
KNOW 58.2003 Carole MAIGNAN, Dino PINELLI and Gianmarco I.P. OTTAVIANO:ICT, Clusters and Regional Cohesion: A
Summary of Theoretical and Empirical Research
KNOW 59.2003 Giorgio BELLETTINI and Gianmarco I.P. OTTAVIANO: Special Interests and Technological Change
ETA 60.2003 Ronnie SCHÖB: The Double Dividend Hypothesis of Environmental Taxes: A Survey
CLIM 61.2003 Michael FINUS, Ekko van IERLAND and Robert DELLINK: Stability of Climate Coalitions in a Cartel
Formation Game
GG 62.2003 Michael FINUS and Bianca RUNDSHAGEN: How the Rules of Coalition Formation Affect Stability of
International Environmental Agreements
SIEV 63.2003 Alberto PETRUCCI: Taxing Land Rent in an Open Economy
CLIM 64.2003 Joseph E. ALDY, Scott BARRETT and Robert N. STAVINS: Thirteen Plus One: A Comparison of Global Climate
Policy Architectures
SIEV 65.2003 Edi DEFRANCESCO: The Beginning of Organic Fish Farming in Italy
SIEV 66.2003 Klaus CONRAD: Price Competition and Product Differentiation when Consumers Care for the Environment
SIEV 67.2003 Paulo A.L.D. NUNES, Luca ROSSETTO, Arianne DE BLAEIJ: Monetary Value Assessment of Clam Fishing
Management Practices in the Venice Lagoon: Results from a Stated Choice Exercise
CLIM 68.2003 ZhongXiang ZHANG: Open Trade with the U.S. Without Compromising Canada’s Ability to Comply with its
Kyoto Target
KNOW 69.2003 David FRANTZ (lix): Lorenzo Market between Diversity and Mutation
KNOW 70.2003 Ercole SORI (lix): Mapping Diversity in Social History
KNOW 71.2003 Ljiljana DERU SIMIC (lxii): What is Specific about Art/Cultural Projects?
KNOW 72.2003 Natalya V. TARANOVA (lxii):The Role of the City in Fostering Intergroup Communication in a Multicultural
Environment: Saint-Petersburg’s Case
KNOW 73.2003 Kristine CRANE (lxii): The City as an Arena for the Expression of Multiple Identities in the Age of
Globalisation and Migration
KNOW 74.2003 Kazuma MATOBA (lxii): Glocal Dialogue- Transformation through Transcultural Communication
KNOW 75.2003 Catarina REIS OLIVEIRA (lxii): Immigrants’ Entrepreneurial Opportunities: The Case of the Chinese in
Portugal
KNOW 76.2003 Sandra WALLMAN (lxii): The Diversity of Diversity - towards a typology of urban systems
KNOW 77.2003 Richard PEARCE (lxii): A Biologist’s View of Individual Cultural Identity for the Study of Cities
KNOW 78.2003 Vincent MERK (lxii): Communication Across Cultures: from Cultural Awareness to Reconciliation of the
Dilemmas
KNOW 79.2003 Giorgio BELLETTINI, Carlotta BERTI CERONI and Gianmarco I.P.OTTAVIANO: Child Labor and Resistance
to Change
ETA 80.2003 Michele MORETTO, Paolo M. PANTEGHINI and Carlo SCARPA: Investment Size and Firm’s Value under
IEM 81.2003 Alessandro LANZA, Matteo MANERA and Massimo GIOVANNINI: Oil and Product Dynamics in International Petroleum Markets
CLIM 82.2003 Y. Hossein FARZIN and Jinhua ZHAO: Pollution Abatement Investment When Firms Lobby Against
Environmental Regulation
CLIM 83.2003 Giuseppe DI VITA: Is the Discount Rate Relevant in Explaining the Environmental Kuznets Curve?
CLIM 84.2003 Reyer GERLAGH and Wietze LISE: Induced Technological Change Under Carbon Taxes
NRM 85.2003 Rinaldo BRAU, Alessandro LANZA and Francesco PIGLIARU: How Fast are the Tourism Countries Growing?
The cross-country evidence
KNOW 86.2003 Elena BELLINI, Gianmarco I.P. OTTAVIANO and Dino PINELLI: The ICT Revolution: opportunities and risks
for the Mezzogiorno
SIEV 87.2003 Lucas BRETSCGHER and Sjak SMULDERS: Sustainability and Substitution of Exhaustible Natural Resources.
How resource prices affect long-term R&D investments
CLIM 88.2003 Johan EYCKMANS and Michael FINUS: New Roads to International Environmental Agreements: The Case of
Global Warming
CLIM 89.2003 Marzio GALEOTTI: Economic Development and Environmental Protection
CLIM 90.2003 Marzio GALEOTTI: Environment and Economic Growth: Is Technical Change the Key to Decoupling?
CLIM 91.2003 Marzio GALEOTTI and Barbara BUCHNER: Climate Policy and Economic Growth in Developing Countries
IEM 92.2003 A. MARKANDYA, A. GOLUB and E. STRUKOVA: The Influence of Climate Change Considerations on Energy
Policy: The Case of Russia
ETA 93.2003 Andrea BELTRATTI: Socially Responsible Investment in General Equilibrium
CTN 94.2003 Parkash CHANDER: The γ-Core and Coalition Formation
IEM 95.2003 Matteo MANERA and Angelo MARZULLO: Modelling the Load Curve of Aggregate Electricity Consumption
Using Principal Components
IEM 96.2003 Alessandro LANZA, Matteo MANERA, Margherita GRASSO and Massimo GIOVANNINI: Long-run Models of
Oil Stock Prices
CTN 97.2003 Steven J. BRAMS, Michael A. JONES, and D. Marc KILGOUR: Forming Stable Coalitions: The Process
Matters
KNOW 98.2003 John CROWLEY, Marie-Cecile NAVES (lxiii):Anti-Racist Policies in France. From Ideological and Historical
Schemes to Socio-Political Realities
KNOW 99.2003 Richard THOMPSON FORD (lxiii): Cultural Rights and Civic Virtue
KNOW 100.2003 Alaknanda PATEL (lxiii):Cultural Diversity and Conflict in Multicultural Cities
KNOW 101.2003 David MAY (lxiii): The Struggle of Becoming Established in a Deprived Inner-City Neighbourhood
KNOW 102.2003 Sébastien ARCAND, Danielle JUTEAU, Sirma BILGE, and Francine LEMIRE (lxiii) : Municipal Reform on the
Island of Montreal: Tensions Between Two Majority Groups in a Multicultural City
CLIM 103.2003 Barbara BUCHNER and Carlo CARRARO: China and the Evolution of the Present Climate Regime
CLIM 104.2003 Barbara BUCHNER and Carlo CARRARO: Emissions Trading Regimes and Incentives to Participate in
International Climate Agreements
CLIM 105.2003 Anil MARKANDYA and Dirk T.G. RÜBBELKE: Ancillary Benefits of Climate Policy
NRM 106.2003 Anne Sophie CRÉPIN (lxiv): Management Challenges for Multiple-Species Boreal Forests
NRM 107.2003 Anne Sophie CRÉPIN (lxiv): Threshold Effects in Coral Reef Fisheries
SIEV 108.2003 Sara ANIYAR ( lxiv): Estimating the Value of Oil Capital in a Small Open Economy: The Venezuela’s Example
SIEV 109.2003 Kenneth ARROW, Partha DASGUPTA and Karl-Göran MÄLER(lxiv): Evaluating Projects and Assessing
Sustainable Development in Imperfect Economies
NRM 110.2003 Anastasios XEPAPADEAS and Catarina ROSETA-PALMA(lxiv): Instabilities and Robust Control in Fisheries
NRM 111.2003 Charles PERRINGS and Brian WALKER (lxiv):Conservation and Optimal Use of Rangelands
ETA 112.2003 Jack GOODY (lxiv): Globalisation, Population and Ecology
CTN 113.2003 Carlo CARRARO, Carmen MARCHIORI and Sonia OREFFICE: Endogenous Minimum Participation in
International Environmental Treaties
CTN 114.2003 Guillaume HAERINGER and Myrna WOODERS: Decentralized Job Matching
CTN 115.2003 Hideo KONISHI and M. Utku UNVER: Credible Group Stability in Multi-Partner Matching Problems
CTN 116.2003 Somdeb LAHIRI: Stable Matchings for the Room-Mates Problem
CTN 117.2003 Somdeb LAHIRI: Stable Matchings for a Generalized Marriage Problem
CTN 118.2003 Marita LAUKKANEN: Transboundary Fisheries Management under Implementation Uncertainty
CTN 119.2003 Edward CARTWRIGHT and Myrna WOODERS: Social Conformity and Bounded Rationality in Arbitrary
Games with Incomplete Information: Some First Results
CTN 120.2003 Gianluigi VERNASCA: Dynamic Price Competition with Price Adjustment Costs and Product Differentiation
CTN 121.2003 Myrna WOODERS, Edward CARTWRIGHT and Reinhard SELTEN: Social Conformity in Games with Many
Players
CTN 122.2003 Edward CARTWRIGHT and Myrna WOODERS: On Equilibrium in Pure Strategies in Games with Many Players
CTN 123.2003 Edward CARTWRIGHT and Myrna WOODERS: Conformity and Bounded Rationality in Games with Many
Players