T h e i n f o r m aT i o n c h a n n e l s T h aT m aT T e r : T h e c a s e
o f s o c i a l e n T e r p r i s e c u s T o m e r s i n l aT v i a
Kristīne Casno1, Daina Šķiltere2, Biruta Sloka3 University of Latvia (Latvia)
ABStrACt
Social entrepreneurship is becoming more and more popular as there is a growing share of people who would like to contribute for social enterprises and are ready to become customers of the social enterprises and in this way participate in reduction of poverty in the country and support entrepreneurship development. For social enterprise marketing communications to be effective, an un
-derstanding is necessary not only of the information channels which are most effective but also of the preferences customers hold regarding the information channels that they would like to receive information from. Purpose of research: to investigate the prefe
-rences for different information channels among customers of Latvian social enterprises. research methods: scientific publications analysis, analysis of previous conducted research results, social enterprise customers’ survey conducted by Kristīne Casno. results of research have indicated that regular customers of social enterprises prefer such information channels as social networks, followed by television and radio.
KEYWOrDS: social enterprise, information channels, decision making, social entrepreneurship, survey
JEL CODES: M14; M31; M38
DOI: http://dx.doi.org/10.15181/rfds.v29i3.1991 Introduction
Social entrepreneurship is becoming more and more popular as there is a growing share of people who would like to contribute for social enterprises and are ready to become customers of the social enterprises and in this way participate in reduction of poverty in the country and support entrepreneurship development. However, social enterprises operate under tight budget constraints and have limited funds available for mar-keting purposes. therefore, they have to make sure they select the right communication channels for their message to reach both their existing and potential customers. Although general information on information channels and their effectiveness is available, what social enterprises usually lack is the knowledge of the actual preferences of their customers with regards to the information channels that they would like to receive the information from.
1 Kristīne Casno – research assistant at the University of Latvia Institute of Economic and Management Sciences for realisation of
National research Program, University of Latvia, Institute of Economic and Management Sciences Scientific field: social marketing
E-mail: kristine_casno@yahoo.com tel. +371 278 363 33
Purpose of research: to investigate the preferences for different information channels among customers of Latvian social enterprises.
tasks of research: 1) to analyze recent research findings on social entrepreneurship development and information channel effectiveness reflected in recent scientific publications; 2) analyze the preferences of social enterprise customers with regards to information channels that they would like to receive information about social enterprises from 3) analyze if there are any differences in preferences among consumers with regards to their age, gender and place of residence.
research methods: scientific publications analysis, analysis of previous conducted research results, so-cial enterprise customers’ survey conducted by Kristīne Casno. For survey data analysis indicators of des-criptive statistics (indicators of central tendency or location (arithmetic means, mode, median), indicators of variability (range, variance, standard deviation, standard error of mean), cross-tabulations, testing statistical hypotheses with t-test, analysis of variance (ANOVA), as well as correlation analysis are applied.
results of research have indicated that regular customers of social enterprises prefer to receive informa-tion from such informainforma-tion channels as social networks, followed by television and radio.
1. Overview of research on social entrepreneurship
research world-wide has paid a lot of academic researchers’ attention to several aspects of social entre-preneurship including social mission as competitive advantage with analysis of the strategic conditions of social entrepreneurship (Muñoza, Kimmitt, 2019: 859; Sekliuckiene, Kisielius, 2015: 1017; Currym, Don-ker, Michel, 2016: 112) as well as performance relationship to different approaches of marketing (Palaci-os-Marquésa, et al, 2019: 429) and innovation applications for sustainable development (Geradts, Bocken, 2019: 81) and social innovations (Ko, Liu, 2019: 781); social innovations and sustainable entrepreneurship (Satu, 2019: 551). research results on social entrepreneurship in non-governmental organizations toward a realistic theory of social entrepreneurship has grounded on microfinance research and finding ways on sel-ling dreams to society (Arvind, 2019: 312). As social enterprises during last years are created and developing and contributing to national economy and also to social security – often there arises a question: what will be next (Bacq, Janssen, Noel, 2019: 842). Questions on risk of social enterprises are often asked by entrepre-neurs and by researchers (Sukwoong, Namil, Wonjoon, 2019: 935). researchers and teachers state questions on readiness of university students for social entrepreneurship (Wenke, tang, Liu, 2019: 41). Value drivers of social businesses and business model perspectives are on research agenda with finding the best possible solutions (Spieth, Schneider, Clauss, 2019: 441) and investigations of several approaches to find the best possible solution for social entrepreneurship (Martinez, rubio, Fernandez, 2019: 456).
Analysis of approaches in achieving sustainability through Schumpeterian social entrepreneurship and the role of social enterprises are investigated by many scientists including (rahdari, Sepasi, Moradi, 2016: 356) and on different success factors (Pal, Altay, 2019: 176). Different fields of national economy are ana-lyzed in respect to social entrepreneurship like (Aquino, Lück, Schänzel, 2018: 28) in the field of tourism with a conceptual framework of tourism social entrepreneurship for sustainable community development – including significant engagement and development of disadvantaged and underdeveloped communities su-stainably through the tourism industry with suggested practical and innovative approaches. Social entre-preneurship is investigated in respect of creating value in the context of institutional complexity (Cherrier, Goswami, ray, 2018: 251) analyzing global companies, SMEs, management differences by gender, and many other factors. In numerous research it has been indicated that women have a very special role in social entrepreneurship even giving “women as vectors of social entrepreneurship” (Kimbua, Ngoasong, 2016: 71). Different countries have different approaches for social entrepreneurship (Korstenbroek, Smets, 2019: 484;
2. relative importance and effectiveness of various information channels in marketing the overwhelming amount of information today that people encounter makes it more and more difficult for companies to convey their marketing message to consumers effectively. In the digital era communication is changing from previously so common one-way communication to a many-to-many communication model where consumers hold a fair share of power that companies must become aware of (Klepek, Starzyczna, 2018: 501). Businesses have turned to integrated marketing communication with a deeper focus on the con-sumer and a unified message across all communication channels for a greater impact (Duralia, 2018: 94). regardless of the communication channel, one must evaluate their strengths and weaknesses. For example, while television is highly effective because of the possibility to combine visuals with sound, the costs are high and it is impossible to select whom to target the message to. Direct mail, on the other hand, allows to select the audiences, but is associated with high costs and has earned a negative reputation. radio allows audience selection as well, but is limited only to sound which diminishes the efficiency of this information channel. Using internet, including social networks, for communication of information, is a relatively low cost option which allows to select audiences but the message has to compete with millions of others in the digital networks (Kotler, Keller, 2016: 616).
Irrespective of the dominance of internet in modern digital era, consumers are still highly influenced by traditional mass media information channels (Peštek, 2012: 48). television is found to be most efficient, print media the least efficient but internet, used separately, the second least efficient marketing communication chan-nel. therefore, for best results internet as a channel should be combined with traditional media (Stolyarova, rialp, 2014: 213). Given the challenges in communication today, an in-depth understanding of the information channels that social enterprise consumers prefer to receive information from, would provide practical insights for social enterprises that could increase the effectiveness of their marketing communication.
3. Empirical research methodology and main results
For data collection purposes authors used quantitative research in the form of the customers’ of social enterprises survey. It was distributed over a period of 2 months through social networks with support from Latvian Social Entrepreneurship Association and Latvian social enterprises. Possible respondents got invita-tion to participate in the survey and if the possible respondent have not filled the survey, invitainvita-tion was sent in two weeks and a third time reminder was sent after four weeks. respondents were asked a set of questions to investigate in-depth insight about the purchasing habits and opinions of Latvian social enterprise product consumers. Among other questions, the respondents were also asked to indicate their preference on a scale from 1 (would not like to receive) to 10 (would like to receive) towards receiving information about social enterprises and their offerings across various information channels.
the survey was completed by 329 respondents (the number of fully completed surveys was 224), 84%
of them female, 16% male of whom more than 80% were of age 16–45 and held either a master’s or bache
-lor’s degree. the number of respondents who had not made any purchases of social enterprises’ products or services during 2018 was only 63. Most respondents (46.8%) had made purchases 1–4 times during 2018, 11% of respondents – 5–8 times, 5.9% – 9–12 times, and 9.7% of respondents – 13 times and more. Overall,
consumers of Latvian social enterprise products indicated on average the highest preference for such infor
Table 1. Main statistic indicators of respondents,’ who had made purchases from social enterprises in 2018, preference for receiving information about social enterprises across information channels
printed media e-mail radio networkssocial Direct mail Television
Mean 4.22 5.21 6.46 8.25 2.28 6.52 Mode 1 1 8 10 1 10 N 143 157 148 166 144 155 Std. Deviation 2.929 3.229 2.651 2.076 2.218 3.059 Median 4 5 7 9 1 8 Std. Error of Mean 0.245 0.258 0.218 0.161 0.185 0.246 range 9 9 9 9 9 9
Source: Authors’ construction based on questionnaire developed by Kristīne Casno and survey conducted in 2019, evaluation scale 1–10, where 1 – would not like to receive; 10 – would like to receive, n = 329
Social networks are clearly the most preferred means of communication about Latvian social enterprises and their offerings among existing social enterprise customers, which confirms the appealing nature of inte-ractive internet communications.
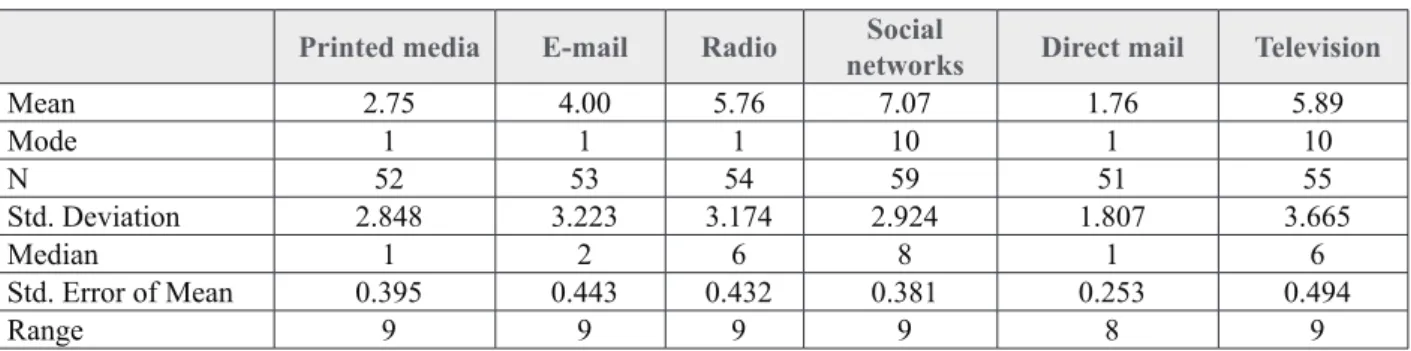
respondents who had not made any purchases from Latvian social enterprises during 2018 compared to those who had, indicated on average lower scores across all information channels, as reflected in table 2, however social networks, television and radio still remain in the leading positions which suggests that afore-mentioned are equally optimal for communication with both existing as well as new customers.
Table 2. Main statistic indicators of respondents,’ who had not made purchases from social enterprises in 2018, preference for receiving information about social enterprises across information channels
printed media e-mail radio networkssocial Direct mail Television
Mean 2.75 4.00 5.76 7.07 1.76 5.89 Mode 1 1 1 10 1 10 N 52 53 54 59 51 55 Std. Deviation 2.848 3.223 3.174 2.924 1.807 3.665 Median 1 2 6 8 1 6 Std. Error of Mean 0.395 0.443 0.432 0.381 0.253 0.494 range 9 9 9 9 8 9
Source: Authors’ construction based on questionnaire developed by Kristīne Casno and survey conducted in 2019, evaluation scale 1–10, where 1 – would not like to receive; 10 – would like to receive, n = 329
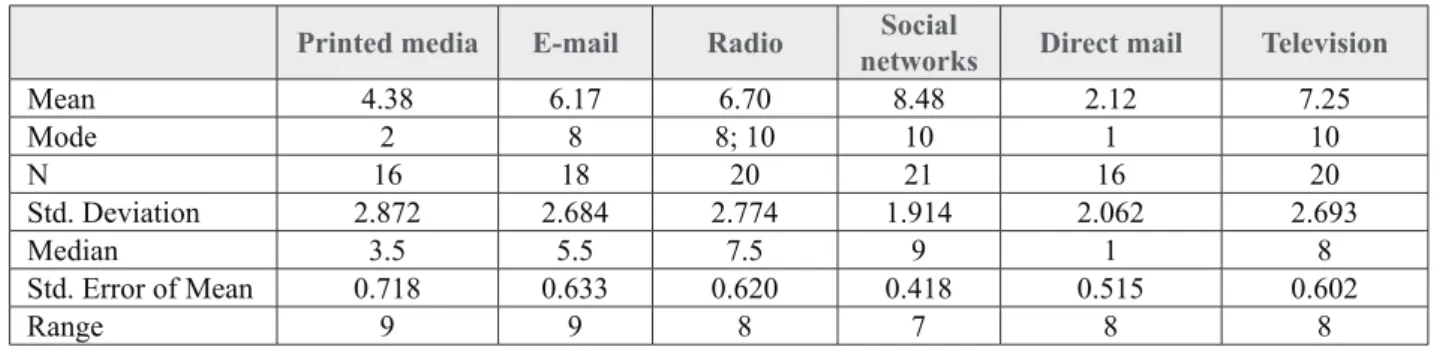
taking into account that social enterprises are usually restricted by tight financial and human resources, the understanding of frequent shoppers’ communication preferences accross various information channels is of utmost importance for sustainable operations of the social enterprise. While those who made purchases from social enterprises more than 13 times during 2018 indicated on average higher scores across all infor-mation channels compared to the rest of consumer base among respondents which confirms the previously defined trend of social networks, television and radio as the most preferred means of communication, the Authors found the relatively high value of mean and mode for e-mail as information channel particularly interesting in this consumer group, as reflected in table 3.
Table 3. Main statistic indicators of respondents,’ who had made purchases from social enterprises 13 times and more in 2018, preference for receiving information about social enterprises across information channels
printed media e-mail radio networkssocial Direct mail Television
Mean 4.38 6.17 6.70 8.48 2.12 7.25 Mode 2 8 8; 10 10 1 10 N 16 18 20 21 16 20 Std. Deviation 2.872 2.684 2.774 1.914 2.062 2.693 Median 3.5 5.5 7.5 9 1 8 Std. Error of Mean 0.718 0.633 0.620 0.418 0.515 0.602 range 9 9 8 7 8 8
Source: Authors’ construction based on questionnaire developed by Kristīne Casno and survey conducted in 2019, evaluation scale 1–10, where 1 – would not like to receive; 10 – would like to receive, n = 329
Correlation analysis identified a statistically significant (sig 0,006) correlation relationship which su-ggests that consumers who indicated a higher preference for e-mail as an information channel on average made purchases from social enterprises more often.
Table 4. Correlation analysis results (consumer shopping frequency and preference for e-mail as an information channel)
correlations
how many times did you purchase products/
services of social enterprises in 2018? e-mail How many times did you
purchase products/ services of social enterprises in 2018?
Pearson Correlation 1 0,220**
Sig. (2-tailed) 0,006
N 174 157
E-mail Pearson Correlation 0,220** 1
Sig. (2-tailed) 0,006
N 157 157
**. Correlation is significant at the 0.01 level (2-tailed)
Source: Authors’ construction based on questionnaire developed by Kristīne Casno and survey conducted in 2019, evaluation scale 1–10, where 1 – would not like to receive; 10 – would like to receive, n = 329
Such results suggest that, despite rather big differences in evaluations of respondents with very different indicators of central tendency or location (arithmetic mean, mode and median) and rather big indicators of variability, e-mail as an information channel may still serve as an effective mean of communication with a high potential to bring in sales for Latvian social enterprises. Authors did not recognize any other statisti-cally significant correlations between consumers’ shopping frequency and preference for other information channels.
Authors were also interested to investigate how the patterns for the preference for receipt of information across various information differed among various consumer age (16–55) groups, as reflected in table 5.
Table 5. Main statistic indicators of preferences for receipt of information across different information channels in various consumer age groups
age group statistical indicators printed media e-mail radio social networks Direct mail Television 16–25 years MeanN 4.9314 6.0715 7.0015 8.2715 1.6913 6.1315 Std. Deviation 3.385 3.327 2.420 2.404 1.109 3.399 Std. Error of Mean 0.905 0.859 0.625 0.621 0.308 0.878 range 9 9 8 9 3 9 26–35 years MeanN 3.9760 5.2365 6.4764 8.2670 1.8962 6.5168 Std. Deviation 2.531 3.131 2.714 2.076 1.812 3.141 Std. Error of Mean 0.327 0.388 0.339 0.248 0.230 0.381 range 9 9 9 9 8 9 36–45 years MeanN 4.0839 5.0245 6.1541 8.4250 2.3241 6.2642 Std. Deviation 3.064 3.265 2.780 1.991 2.339 3.029 Std. Error of Mean 0.491 0.487 0.434 0.282 0.365 0.467 range 9 9 9 9 9 9 46–55 years MeanN 4.1316 6.2417 6.0714 8.2417 3.8116 7.1817 Std. Deviation 2.986 3.364 2.464 1.985 2.786 3.005 Std. Error of Mean 0.747 0.816 0.659 0.481 0.697 0.729 range 9 9 7 7 7 9
Source: Authors’ construction based on questionnaire developed by Kristīne Casno and survey conducted in 2019, evaluation scale 1–10, where 1 – would not like to receive; 10 – would like to receive, n = 329
E-mail communication is overall most preferred by consumers of age groups 46–55 and 16–25. E-mail as an information channel is positively appreciated (score 8 and above) by 60% of consumers in the age group 16–25 and 41.2% of consumers in the age group 46–55, leaving such age groups as 26–35 and 36–45 behind with 32.3% and 26.7% of positive scores (score 8 and above) respectively. radio as an information channel is most preferred by the younger consumers of age 16–25, 53.3% of whom indicate scores of 8 and above for this information channel, followed by the age group 26–35 with 40.6% of scores 8 and above. Authors find it interesting that social networks have the highest mean indicator of 8.42 among age group of 36–45, leaving other age groups behind. It must be noted that positive scores (8 and above) for social networks are indicated by 82.4% of consumers in the age group of 46–55, 80% of consumers in the age group 36–45, 73.3% of consumers in the age group 16–25 and 77.1% of consumers in the age group 26–35, which makes social networks an attractive information channel for communication across all of them, especially with con-sumers of age 36 plus. Compared with other information channels, social networks have also received the lowest percent of scores below 3 (included) across all age groups. Direct mail is clearly the least preferred information channel across all age groups. More than 80% of consumers in all age groups, indicate scores below 3 for this information channel, except age group 46–55 years with almost 54%. there is recognised a statistically significant correlational relationship between consumer age and consumer preference for direct mail, as evidenced by the results of correlation analysis reflected in table 6 which data suggest that the pre-ference for direct mail as an information channel tends to increase on average with increase of consumer age.
Table 6. Correlation analysis results (consumer age and preference for direct mail as an information channel) correlations
age group Direct mail
Age group Pearson Correlation 1 0,196*
Sig. (2-tailed) 0,023
N 159 134
Direct mail Pearson Correlation 0,196* 1
Sig. (2-tailed) 0,023
N 134 144
*. Correlation is significant at the 0.05 level (2-tailed)
Source: Authors’ construction based on questionnaire developed by Kristīne Casno and survey conducted in 2019, evaluation scale 1–10, where 1 – would not like to receive; 10 – would like to receive, n = 329
television as an information channel is highly preferred (scores of 8 and above) by consumers of the age group 46–55 (58.8% of respondents), followed by age groups 26–35 (50% respondents), 36–45 (47.6% res-pondents) and 16–25 (40% resres-pondents). the popularity of printed media is below average. this information channel is most preferred (scores of 8 and above) by youngest consumers of age 16–25 (21.4%; mean indi-cator of 4.93), followed by consumers of age 46–55 (18.8%, mean indiindi-cator of 4.13). It must be noted that Authors find the differences in consumer preferences for various information channels across all age groups to be statistically significant, except for direct mail, as reflected in table 7.
Table 7. ANOVA results on investigation of differences in respondent evaluations on information channels by respondent age groups
anova sum of
squares df mean square F Sig.
Printed media Between Groups 10.634 3 3.545 0.436 0.728
Within Groups 1017.381 125 8.139
total 1028.016 128
E-mail Between Groups 26.710 3 8.903 0.858 0.465
Within Groups 1432.508 138 10.380
total 1459.218 141
radio Between Groups 9.833 3 3.278 0.456 0.713
Within Groups 933.988 130 7.185
total 943.821 133
Social networks Between Groups .924 3 0.308 0.072 0.975
Within Groups 635.544 148 4.294
total 636.467 151
Direct mail Between Groups 51.425 3 17.142 3.987 0.009
Within Groups 550.294 128 4.299
total 601.720 131
television Between Groups 12.128 3 4.043 0.415 0.742
Authors were also interested to investigate if there were any differences in preference for various infor-mation channels among men and women. Overall, while women tend to prefer social networks, followed by radio and television, men are more reserved with regards to social networks as an information channel. While for men social networks still hold the highest mean indicator, their second most popular choice of communi-cation according to mean indicators is e-mail, followed by television, as reflected in table 8.
Table 8. Main statistical indicators for preferences of receipt of information across various information channels by gender
Gender printed media e-mail radio networkssocial Direct mail Television
Woman Mean 4.22 5.14 6.66 8.41 2.13 6.65 N 113 126 119 136 115 126 Std. Deviation 2.899 3.249 2.641 1.930 2.054 3.078 Median 4 5 7 9 1 8 Std. Error of Mean 0.273 0.289 0.242 0.166 0.192 0.274 range 9 9 9 9 9 9 Man Mean 3.65 6.41 5.13 7.25 2.53 5.24 N 17 17 16 16 17 17 Std. Deviation 2.805 3.022 2.553 2.887 2.322 3.093 Median 2 7 5 8 1 5 Std. Error of Mean 0.680 0.733 0.638 0.722 0.563 0.750 range 7 9 8 9 7 8
Source: Authors’ construction based on questionnaire developed by Kristīne Casno and survey conducted in 2019, evaluation scale 1–10, where 1 – would not like to receive; 10 – would like to receive, n = 329
With regards to e-mail communication, 41% of men compared to 33% of women identified a score of 8 and above. the proportion of the lowest scores from 1 to 3 was also lower for men (only 24% compared to 37% for women). the differences among men and women with regards to their preference for commu-nication via radio was also interesting – 45% of women provided scores of 8 and above compared to 19% of males. A larger proportion of men also provided low scores of 1 to 3 for this information channel – 31% compared to only 13% of women. Social networks, while holding the most preferred position for both gen-ders, were still more preferred by women – 79% of women provided scores of 8 and above compared to 63% of men. While for both genders television is the third most popular choice of information channel, 51% of females provided scores of 8 and above, compared to only 35% of males, independent samples t-test confir-med statistically significant differences in preferences for such information channels as social networks and radio between men and women.
Table 9. results of the independent samples t-test on evaluations of different information channels by respondent’s gender
levene’s Test for equality of
variances t-test for equality of means
F Sig. t df (2-tailed)sig. mean Diff. error std.
Diff. Printed media Equal variances assumed 0.038 0.846 0.764 128 0.446 0.574 0.751 Equal variances not assumed 0.783 21.478 0.442 0.574 0.733 E-mail Equal variances assumed 0.527 0.469 –1.523 141 0.130 –1.269 0.833 Equal variances not assumed –1.610 21.313 0.122 –1.269 0.788 radio Equal variances assumed 0.192 0.662 2.185 133 0.031 1.530 0.701 Equal variances not assumed 2.242 19.575 0.037 1.530 0.683 Social net-works Equal variances assumed 4.457 0.036 2.148 150 0.033 1.162 0.541 Equal variances not assumed 1.569 16.614 0.135 1.162 0.740 Direct mail Equal variances assumed 0.856 0.357 –0.735 130 0.464 –0.399 0.543 Equal variances not assumed –0.671 19.880 0.510 –0.399 0.595 television Equal variances assumed 0,008 0.931 1.779 141 0.077 1.415 0.796 Equal variances not assumed 1.772 20.516 0.091 1.415 0.799
Source: Authors’ construction based on questionnaire developed by Kristīne Casno and survey conducted in 2019, evaluation scale 1–10, where 1 – would not like to receive; 10 – would like to receive, n = 329
It was investigated if there were any differences in preference for various information channels depen-ding on the consumers’ place of residence, reflected in table 10.
Table 10. Main statistical indicators for preferences of receipt of information across various information channels by consumers’ place of residence
place of residence printed media e-mail radio networkssocial Direct mail Television
riga Mean 3.79 5.51 6.32 8.46 2.11 6.27 N 72 77 74 83 73 79 Std. Deviation 2.653 3.251 2.639 2.014 2.052 3.201 Std. Error of Mean 0.313 0.370 0.307 0.221 0.240 0.360 range 9 9 9 9 8 9 Municipalities surrounding riga Mean 4.45 4.80 6.00 8.50 2.26 6.36 N 22 25 22 24 23 22 Std. Deviation 3.004 2.915 2.760 1.383 1.738 3.259 Std. Error of Mean 0.640 0.583 0.588 0.282 0.362 0.695 range 9 9 9 4 6 9 Kurzeme re-gion MeanN 5.0010 6.3312 7.3010 8.1513 2.8211 6.5511 Std. Deviation 3.162 2.934 2.111 2.478 2.994 3.236 Std. Error of Mean 1.000 0.847 0.667 0.687 0.903 0.976 range 9 9 6 9 9 9 Vidzeme re-gion MeanN 4.3918 4.8919 6.6118 7.5020 2.3116 7.1520 Std. Deviation 3.381 3.665 2.973 2.724 2.522 2.519 Std. Error of Mean 0.797 0.841 0.701 0.609 0.631 0.563 range 9 9 9 9 8 9 Zemgale re-gion MeanN 4.8010 5.0011 7.1712 8.6213 2.0010 7.1513 Std. Deviation 2.898 3.406 2.725 1.387 2.211 2.968 Std. Error of Mean 0.917 1.027 0.787 0.385 0.699 0.823 range 7 9 9 4 7 9
Source: Authors’ construction based on questionnaire developed by Kristīne Casno and survey conducted in 2019, evaluation scale 1–10, where 1 – would not like to receive; 10 – would like to receive, n = 329
Overall, printed media was rated by consumers with the average score (arithmetic mean) of 5 or below in all regions. E-mail as an information channel was most preferred in Kurzeme region, based on mean in-dicators. 42% of consumers provided scores of 8 or above for e-mail communication in this region, while only 28% of consumers – in municipalities surrounding riga. radio as an information channel is also most preferred by consumers in Kurzeme. Scores of 8 or above were provided by 60% of consumers from this region, followed by 50% of consumers from Vidzeme and 41% of consumers from riga. Social networks as an information channel were most preferred by consumers from Kurzeme (85% of scores 8 and above), followed by consumers from riga (82% of scores 8 and above) and consumers from Zemgale (77% of scores 8 and above). Direct mail as an information channel was rated on average below 3 by consumers in all regions. Communication over television, compared with other regions, was slightly more preferred by consumers in Kurzeme – 64% provided scores of 8 and above, followed by 54% of scores of 8 and above in Kurzeme and 50% of scores of 8 and above in riga and Vidzeme. However, the Authors found that the differences in preferences of receipt of information across various information channels are not statistically significant by consumers’ place of residence, as reflected in table 11.
Table 11. ANOVA results on investigation of differences in respondent evaluations on information channels by place of residence
sum of squares df mean square F Sig.
Printed media Between Groups 23.762 4 5.941 0.719 0.580
Within Groups 1049.207 127 8.261
total 1072.970 131
E-mail Between Groups 26.297 4 6.574 0.626 0.645
Within Groups 1459.703 139 10.501
total 1486.000 143
radio Between Groups 19.475 4 4.869 0.678 0.608
Within Groups 940.261 131 7.178
total 959.735 135
Social networks Between Groups 17.288 4 4.322 1.041 0.388
Within Groups 614.372 148 4.151
total 631.660 152
Direct mail Between Groups 5.473 4 1.368 0.293 0.882
Within Groups 598.632 128 4.677
total 604.105 132
television Between Groups 18.770 4 4.693 0.485 0.746
Within Groups 1353.478 140 9.668
total 1372.248 144
Source: Authors’ construction based on questionnaire developed by Kristīne Casno and survey conducted in 2019, evaluation scale 1–10, where 1 – would not like to receive; 10 – would like to receive, n = 329
Overall, consumers prefer to receive information about social enterprises and their offerings over so-cial networks the most, followed by television and radio. there exist statistically significant differences in preferences among age groups for various information channels except for direct mail. there is also find statistically significant differences in preferences by gender for such information channels as social networks and radio. However, consumers do not statistically significantly differ in their preferences for information channels depending on their place of residence.
Conclusions
Latvian social enterprise consumers prefer to receive information about social enterprises and their goods and services via social networks the most, followed by television and radio. the same holds true for potential consumers of social enterprise products and services and customers, who have made purchases more often than once a month. However, customers who made purchases more often than once a month also regard e-mail communication highly, confirmed by a statistically significant correlational relationship. this suggests that e-mail communication may have potential to increase Latvian social enterprise sales.
there are statistically significant differences in preference for various information channels across se-veral consumer age groups, except for direct mail.
E-mail communication is most appreciated by consumers of age groups 16–25 and 46–55, radio is most preferred by consumers of age groups 16–25 and 26–35. Social networks are most preferred by consumers
social networks the most, the second and third most preferred options for women are radio and television, but for men – e-mail and television. With regards such information channels as social networks and radio, there are statistically significant differences in preferences of information channel use between genders for consumption of goods and services offered by social enterprises.
Social networks, while being the most preferred choice of communication medium for both men and wo-men, received statistically significantly higher scores from women. With regards radio, women also expres-sed statistically significantly more positive attitude than men. Men expresexpres-sed a more pronounced dislike for this information channel providing a greater proportion of low scores (1–3) than women.
Women also indicated higher scores for television, however, men showed a higher preference for e-email communication. Authors also investigated potential differences in consumer preferences for various information channels depending on their place of residence. E-mail communication, based on comparison of arithmetic means, was most preferred by consumers in Kurzeme, followed by consumers in riga and municipalities surrounding riga.
radio, based on comparison of arithmetic means, was most preferred by consumers in Kurzeme, follo-wed by consumers in Zemgale and Vidzeme. Social networks, based on comparison of arithmetic means, were most preferred by consumers in Zemgale, followed by consumers in municipalities surrounding riga and consumers in riga. Direct mail was considered as less important information channel – received lowest evaluations with arithmetic mean scores below 3 (in 1–10 point scale) from consumers in all regions.
television was most preferred information channel by consumers in Vidzeme and Zemgale, followed by consumers in Kurzeme for consumption of goods and services offered by social enterprises.
Printed media was most preferred by consumers in Kurzeme, followed by consumers in Zemgale and consumers in municipalities surrounding riga. Although there were no statistically significant differences identified in preference for information channels depending on customers’ place of residence, taking them into account may still have a positive effect on communication efficiency of Latvian social enterprises
Given the position of social networks as the most preferred information channel, it is of utmost impor-tance for social enterprise marketing specialists to invest time and resources for quality relationship building with existing and potential customers via social networks, taking into account that social networks are more preferred by women.
It is advised for social enterprise marketing specialists to take into account the differences in preference for various information channels depending on consumer age, gender and place of residence.
E-mail communication may have potential to increase sales, especially for social enterprises from Kur-zeme region with a high proportion of male customers which should be taken into account by marketing specialists.
Direct mail is the least preferred means of communication among consumers, the preference for direct mail increases with consumer age, which should be taken into account by social enterprises with consumers of older age groups.
Social networks and e-mail communication are relatively low budget options that social enterprises can and should use, the high scores consumers indicated for such traditional information channels as radio and television cannot be ignored.
the synergy effect of integrated marketing communications, support is needed from the Ministry of Welfare in the form of additional funding for radio and tV programmes and possibly advertising campaigns that would help generate greater publicity and public awareness about social enterprises and their role in pro-moting social inclusion, sustainable regional development and other important social and economic aspects. r e f e r e n c e s
Ayman, I., Johnson, B. (2019). Managing Organizational Paradoxes in Social Enterprises: Case Studies from the MENA region. Voluntas, Vol. 30, No. 3, p. 516–534.
Bacq, S., Janssen, F., Noel, C. (2019). What Happens Next? A Qualitative Study of Founder Succession in Social En -terprises. Journal of Small Business Management, Vol. 57, No. 3, p. 820–844.
Cherrier, H., Goswami, H., ray, S. (2018). Social entrepreneurship:Creating value in the context of institutional com -plexity. Journal of Business Research, Vol. 86, p. 245–258.
Currym, J. A., Donker, H., Michel, P. (2016). Social entrepreneurship and indigenous people. Journal of Co-operative Organization and Management, Vol. 4, No. 2, p. 108–115.
Duralia, O. (2018). Integrated Marketing Communication and Its Impact on Consumer Behavior. Studies in Business
and Economics, Vol. 13, No. 2, p. 92–102.
Geradts, t. H. J., Bocken, N. M. P. (2019). Driving Sustainability-Oriented Innovation – Organizations can innovate to address environmental and social problems-but they need to build the right culture. Mit Sloan Management Review, Vol. 60, No. 2, p. 78–83.
Kimbua, A. N., Ngoasong, M. Z. (2016). Women as vectors of social entrepreneurship. Annals of Tourism Research, Vol. 60, p. 63–79.
Klepek, M., Starzyczyna, H. Marketing Communication Model for Social Networks. Journal of Business Economics
and Management, Vol. 19, No. 3, p. 500–520.
Ko, W. W., Liu, G., Yusoff, W. t. W. (2019). Social Entrepreneurial Passion and Social Innovation Performance.
Non-profit and Voluntary Sector Quarterly, Vol. 48, No. 4, p 759–783.
Korstenbroek, t., Smets, P. (2019). Developing the Potential for Change: Challenging Power through Social Entrepre -neurship in the Netherlands. Voluntas, Vol. 30, No. 3, p. 475–486.
Kotler, P., Keller, K. L. (2016). Marketing Management. 15th ed. Pearson Education Limited, 708 p.
Lall, S. A. (2019). From Legitimacy to Learning: How Impact Measurement Perceptions and Practices Evolve in Social Enterprise-Social Finance Organization relationships. Voluntas, Vol. 30, No. 3, p. 562–577.
Martinez, N. C., rubio, B. A., Fernandez, L. A. (2019). Social Entrepreneur: Same or Different from the rest? Voluntas, Vol. 30, No. 3, p. 443–459.
Muñoza, P., Kimmitt, J. (2019). Social mission as competitive advantage: A configurational analysis of the strategic conditions of social entrepreneurship. Journal of Business Research, Vol. 101, p. 854–861.
Pal, r., Altay, N. (2019). Identifying Key Success Factors for Social Enterprises Serving Base-of-Pyramid Markets through Analysis of Value Chain Complexities. Journal of BusinessLogistics, Vol. 40, No. 2, p. 161–179.
Palacios-Marquésa, D., García, M. G., Sánchez, M. M., Pilar, M., Mari, A. (2019). Social entrepreneurship and organi -zational performance: A study of the mediating role of distinctive competencies in marketing. Journal of Business Research, Vol. 101, p. 426–432.
Peštek, A. (2012). Managing Mass Media Influence on Consumer Buying Behavior. Interdisciplinary Management Research, Vol. 8, p. 41–50.
rahdari, A., Sepasi, S., Moradi, M. (2016). Achieving sustainability through Schumpeterian social entrepreneurship:
the role of social enterprises. Journal of Cleaner Production, Vol. 137, p. 347–360.
Satu, A. (2019). Social innovation and sustainable entrepreneurship. International Small Business Journal –
Research-ing Entrepreneurship, Vol. 37, No. 5, p. 551–552 .
Sekliuckiene, J., Kisielius, E. (2015). Development of Social Entrepreneurship Initiatives: A theoretical Framework.
Procedia – Social and Behavioral Sciences, Vol. 213, p. 1015–1019.
Spieth, P., Schneider, S., Clauss, t. (2019). Value drivers of social businesses: A business model perspective. Long Range Planning, Vol. 52, No. 3, p. 427–444.
Stolyarova, E., rialp, J. (2014). Synergies Among Advertising Channels: An Efficiency Analysis. Journal of Promotion Management, Vol. 20, No. 2, p. 200–218.
Sukwoong, C., Namil, K., Wonjoon, K. (2019). Are social entrepreneurs more risk-averse? Applied Economics Let -ters, Vol. 26, No. 11, p. 933–937.
Wenke, W., tang, Y., Liu, Y. (2019). Can Sense of Opportunity Identification Efficacy Play a Mediating role? relation -ship Between Network Embeddedness and Social Entrepreneurial Intention of University Students. Frontiers in
SVARBŪS INFORMACINIAI KANAlAI:
SOCIAlINĖS ĮMONĖS KlIENTŲ ATVEJO lATVIJOJE ANAlIzĖ
Kristīne Casno, Daina Šķiltere, Biruta SlokaLatvijos universitetas (Latvija) Santrauka
Socialinis verslumas vis populiarėja, nes daugėja žmonių, kurie norėtų prisidėti prie socialinių įmonių veiklos, yra pasirengę tapti socialinių įmonių klientais ir taip dalyvauti, siekdami mažinti skurdą šalyje bei remti verslumo plėtrą.
Norint, kad socialinių įmonių rinkodaros komunikacija būtų veiksminga, reikia ne tik atrasti veiksmin-giausius informacijos kanalus, bet ir suprasti, kokiais prioritetiniais informaciniais kanalais klientai naudo-jasi, iš kurių kanalų norėtų gauti informacijos.
tyrimu siekta ištirti Latvijos socialinių įmonių klientų informacinių kanalų pasirinkimą. tyrimo me-todai: mokslinių publikacijų analizė, anksčiau atliktų tyrimų rezultatų analizė. tyrimo rezultatai atskleidė, kad nuolatiniai socialinių įmonių klientai renkasi tokius informacijos kanalus kaip socialiniai tinklai, tada televizija ir radijas. tas pats pasakytina ir apie potencialius socialinių įmonių produktų bei paslaugų vartoto-jus ir klientus, kurie pirko dažniau nei kartą per mėnesį. Klientai, kurie pirko dažniau nei kartą per mėnesį, taip pat labai vertina bendravimą el. paštu, tai patvirtina statistiškai reikšmingas ryšys. taigi bendravimas el. paštu gali didinti Latvijos socialinių įmonių pardavimus. ryšį el. paštu labiausiai vertina 16–25 ir 46–55 metų vartotojai, radiją paprastai renkasi 16–25 ir 26–35 metų vartotojai. Socialinius tinklus labiausiai mėgsta 46–55 metų amžiaus vartotojai, mažiau – 36–45, 16–25 ir 26–35 metų grupės. tiesioginis paštas apskritai yra mažiausiai pageidaujamas informacijos kanalas visose amžiaus grupėse, tačiau, atsižvelgiant į tai, kad vyresni vartotojai vis tiek naudojasi paštu, kaip informacijos kanalo jo visiškai atsisakyti negalima, tai pa-tvirtina statistiškai reikšmingas koreliacinis ryšys. televiziją labiausiai mėgsta 46–55 ir 26–35 metų amžiaus vartotojai. Socialiniai tinklai ir bendravimas el. paštu yra mažo biudžeto priemonės, kuriomis gali ir turėtų naudotis socialinės įmonės, tiesa, nereikėtų ignoruoti ir aukšto lygio vartotojų, nurodytų tokiems tradici-niams informacijos kanalams kaip radijas ir televizija.
PAGrINDINIAI ŽODŽIAI: socialinė įmonė, informacijos kanalai, sprendimų priėmimas, socialinis
verslumas, apklausa.
JEL KLASIFIKACIJA: M14; M31; M38.
Received: 2019-08-21 Revised: 2019-09-14 Accepted: 2019-10-01