ePrints Soton
Copyright © and Moral Rights for this thesis are retained by the author and/or other
copyright owners. A copy can be downloaded for personal non-commercial
research or study, without prior permission or charge. This thesis cannot be
reproduced or quoted extensively from without first obtaining permission in writing
from the copyright holder/s. The content must not be changed in any way or sold
commercially in any format or medium without the formal permission of the
copyright holders.
When referring to this work, full bibliographic details including the author, title,
awarding institution and date of the thesis must be given e.g.
AUTHOR (year of submission) "Full thesis title", University of Southampton, name
of the University School or Department, PhD Thesis, pagination
UNIVERSITY OF SOUTHAMPTON
FACULTY OF ENGINEERING AND THE ENVIRONMENT
Engineering Sciences
Development of infrared techniques for practical defect identification in bonded joints
by
Rachael C. Waugh
Thesis for the degree of Doctor of Philosophy
UNIVERSITY OF SOUTHAMPTON
ABSTRACT
FACULTY OF ENGINEERING AND THE ENVIRONMENT Thesis for the degree of Doctor of Philosophy
DEVELOPMENT OF INFRARED TECHNIQUES FOR PRACTICAL DEFECT IDENTIFICATION IN BONDED JOINTS
Rachael Caroline Waugh
Identification of kissing defects in adhesive bonds has been reported to be an area of concern across a range of industries. To date the majority of work on this matter has focused on the development of advanced ultrasonic techniques. The current thesis focuses on the use of thermography, specifically pulsed and pulse phase thermography (PT and PPT), for the identification of kissing defects. Initially the thesis focuses on the application of PT and PPT for the identification of a range of defect types in a variety of materials to establish the effect of material properties on identification of defects. A numerical model has been developed to simulate the thermal evolution created during a PT or PPT experiment. After validation through a series of case studies, this model has then been used as a predictive tool to relate defect detectability to the thermal property contrast between defect and bulk materials. Where insufficient thermal property contrast exists defects have a limited effect on heat propagation through a component and therefore are not detected using PT or PPT. A means of producing realistic kissing defects in bonded joints is established. The addition of a small load to bonds containing kissing defects was found to open the defects sufficiently to enable their detection. Initial experiments use the application of a tensile load, via a test machine, to successfully investigate simulated kissing defects in single lap joints. A technique using vacuum loading on one adherend of an adhesive bond while PPT is carried out from the other adherend was successfully trialled. Vacuum loading enables the technique to be taken out of the laboratory. A low cost infrared detector, Flir Tau320, compared to the research based photon detector, Flir SC5000, was demonstrated to be suitable for application in PT, thus enabling a significantly lower cost tool to be developed.
Contents
Contents ... i
List of tables ... v
List of figures ... vii
DECLARATION OF AUTHORSHIP ... xv
Acknowledgements ... xvii
Nomenclature ... xix
Abbreviations ... xxi
1.
Introduction... 1
1.1 Background and motivation ... 1
1.2 Aims and objectives ... 3
1.3 Novelty ... 3
1.4 Structure of thesis ... 5
2.
Adhesive bonding ... 9
2.1 Introduction ... 9
2.2 Defects in adhesive bonds ... 10
2.2.1 Adhesive bond failure ... 11
2.3 Laboratory created defects ... 11
2.3.1 Experimentally simulated kissing defects ... 13
2.4 GTT MkIII adhesive bonding and inspection techniques ... 14
2.4.1 Construction of Triplex adhesive bonds ... 14
2.4.2 Current testing techniques for Triplex bonds ... 17
2.4.3 Current research on Triplex bonds ... 18
2.5 Summary ... 21
3.
Non-destructive evaluation ... 23
3.1 Introduction ... 23
3.2 Current non-destructive evaluation techniques ... 24
3.2.1 Ultrasonic testing ... 24
3.2.2 Radiography ... 27
3.2.3 Eddy current ... 29
3.2.4 Shearography... 29
3.2.6 Acoustic emission ... 34
3.3 Non-destructive evaluation of bonded joints ... 35
3.4 Summary ... 37
4.
The physics and implementation of thermography ... 41
4.1 Introduction ... 41
4.2 Types of thermography ... 41
4.3 IR detectors ... 44
4.4 Heat transfer ... 45
4.5 Defect size prediction ... 52
4.6 Pulsed/pulse phase thermography ... 53
4.6.1 Experimental set up and data collection ... 53
4.6.2 Software ... 55
4.6.3 Data processing ... 56
4.7 Summary ... 62
5.
Preliminary results ... 65
5.1 Introduction ... 65
5.2 Simulated defects in aluminium alloy ... 66
5.2.1 Test specimen ... 66
5.2.2 Test arrangements ... 67
5.2.3 Results ... 67
5.2.4 Discussion ... 70
5.3 Simulated defects in carbon fibre reinforced composites ... 70
5.3.1 Test specimens ... 70
5.3.2 Test arrangements ... 72
5.3.3 Results ... 72
5.3.4 Discussion ... 76
5.4 Simulated defects in glass fibre reinforced composites ... 77
5.4.1 Test specimens ... 77
5.4.2 Test arrangements ... 77
5.4.3 Results ... 78
5.4.4 Discussion ... 79
5.5 Simulated defects in bonded joints ... 80
5.5.1 Test specimen ... 80
5.5.2 Test arrangements ... 81
5.5.3 Results ... 81
5.5.4 Discussion ... 83
6.1 Introduction ... 85
6.2 Model development ... 87
6.2.1 Constructing the model ... 88
6.2.2 Assumptions and limitations ... 89
6.2.3 Case studies ... 90
6.3 Pulsed thermography model results ... 91
6.3.1 Case study 1: Aluminium with flat bottom hole ... 92
6.3.2 Case study 2: CFRP ... 96
6.3.3 Case study 3: CFRP-CFRP adhesive lap joint ... 99
6.4 Pulse phase thermography model results ... 102
6.5 Modelling of defect detectability ... 105
6.6 Summary ... 111
7.
Kissing defects ... 113
7.1 Introduction ... 113
7.2 Model of the presence of the effect of a small air gap ... 113
7.3 Test specimens with kissing defects ... 116
7.3.1 Lap joint configuration ... 116
7.3.2 Defects ... 116 7.3.3 Test setup ... 118 7.4 Results... 120 7.4.1 PTFE ... 120 7.4.2 Silicon grease ... 122 7.5 Summary ... 123
8.
Practical application of PT/PPT ... 125
8.1 Introduction ... 125 8.2 Vacuum loading ... 125 8.3 Low cost PPT ... 130 8.4 Summary ... 1329.
Industrial applications ... 135
9.1 Introduction ... 135 9.2 GTT MkIII LNG carriers ... 135 9.2.1 Test specimens ... 135 9.2.2 Test arrangements ... 137 9.2.3 Results... 138 9.2.4 Summary ... 142 9.3 CFRP repair patches ... 1439.3.2 Results ... 145 9.3.3 Summary ... 154 9.4 Porosity investigation ... 155 9.4.1 Test specimens ... 155 9.4.2 Testing arrangements ... 156 9.4.3 Results ... 156 9.4.4 Summary ... 159
9.5 Thick GFRP panels investigation ... 160
9.5.1 Results ... 161
9.5.2 Finite Element Analysis (FEA) ... 163
9.5.3 Summary ... 167
10.
Conclusions and future work ... 169
10.1 Conclusions ... 169
10.2 Recommendations for future work ... 173
10.2.1 Development of PPT and vacuum loading ... 173
10.2.2 Automation ... 173
10.2.3 Numerical modelling ... 174
List of tables
Table 1 The potential for NDE techniques to be used for assessment of composite structures and bonded joints. ... 38 Table 2 Aluminium sample and defect descriptions. ... 66 Table 3 Defect size predictions of 16 mm diameter 0.3 mm and 1.3 mm deep
defects in aluminium using FWHM and visual estimates from PT thermal and PPT phase data. ... 70 Table 4 CFRP sample and defect descriptions. *Polytetrafluoroethylene (PTFE)71 Table 5 Defect size predictions of 20 and 10 mm diameter PTFE inserts at
0.325 and 0.675 mm deep in the CFRP panel using PPT phase data via FWHM and visual estimates. ... 74 Table 6 GFRP sample description. ... 77 Table 7 Bonded samples with inserts descriptions. ... 80 Table 8 Defect size predictions of 20, 10 and 5 mm PTFE inserts at 0.5 mm
deep in the CFRP-CFRP bonded panels using epoxy film adhesive found using FWHM and visual estimates. ... 82 Table 9 Case study specimen information. ... 90 Table 10 Material properties used in the model, taken from literature [116,
132]. ... 91 Table 11 Ratio of modelled and experimental frequency at which the peak
phase contrast occurs and ratio of magnitude of maximum phase contrast peak for each case study. ... 105 Table 12 Threshold values within which defects are no longer visible using PT
ΔT values and PPT Δϕ values as a percentage of bulk material
Table 13 Threshold values within which defects are no longer visible using PT
ΔT values and PPT Δϕ values with relation to thermal effusivity
ratios. ... 110 Table 14 Failure load and effective adhesive area for failed lap joints
containing no defect, Frekote and silicon grease. ... 118 Table 15 Testing and loading regime for TSA and loaded PPT experiments. 119 Table 16 Description of Triplex bonded joint sample configurations. ... 136 Table 17 Ratio of modelled and experimental frequency at which the peak
phase contrast occurs and ratio of magnitude of maximum phase contrast peak. ... 152 Table 18 Material data taken from literature [116]. ... 164
List of figures
Figure 1 Three categories of defects typically found in adhesive joints; a) inclusions, b) voids and c) kissing defects. ... 10 Figure 2 Laboratory created defects, a) a dry contact compressively loaded
defect and b) a liquid layer defect with a thin layer of contamination between adhesive and adherend. ... 13 Figure 3 Schematic diagram of the insulation system for the GTT MkIII type
LNG carrier membrane system tanks [40]. ... 15 Figure 4 Construction of adhesive Triplex bonds in the secondary membrane
of the GTT MkIII insulation system [40]. ... 16 Figure 5 Schematic of ultrasonic C-scan in pulse echo mode inspecting a
bonded joint with interfaces numbered to correspond to oscilloscope trace peaks in Figure 6. ... 25 Figure 6 Sample oscilloscope trace with time on the x axis for a 1.2 mm thick
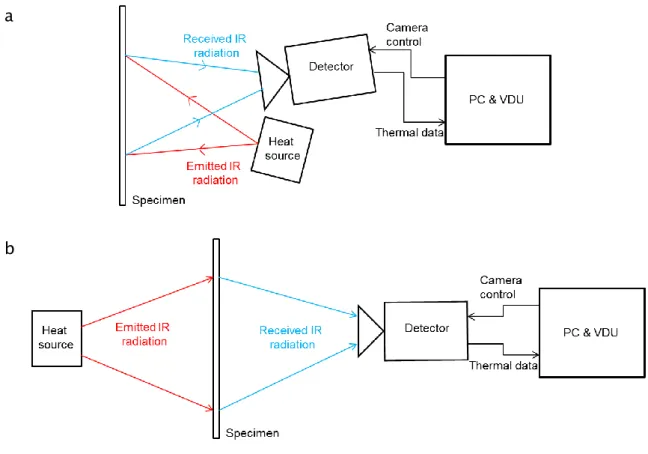
CFRP-CFRP single lap joint which is used to identify key areas of the joint and set data collection windows for an ultrasonic C-scan. ... 26 Figure 7 Schematic diagrams of thermographic NDE in transmission and
reflection setup. ... 31 Figure 8 Thermal front propagation (right to left in image) through a material
with a defect of lower thermal conductivity than the bulk material, highlighting a non-uniform temperature distribution on the front (right) surface. ... 32 Figure 9 Thermal decay of surface temperature after application of a heat
pulse over defective and non-defective material. ... 49 Figure 10 Schematic showing defect depth, L, and reference or full material
depth, Lr, where the front surface of this sample is the top surface in the diagram. ... 50
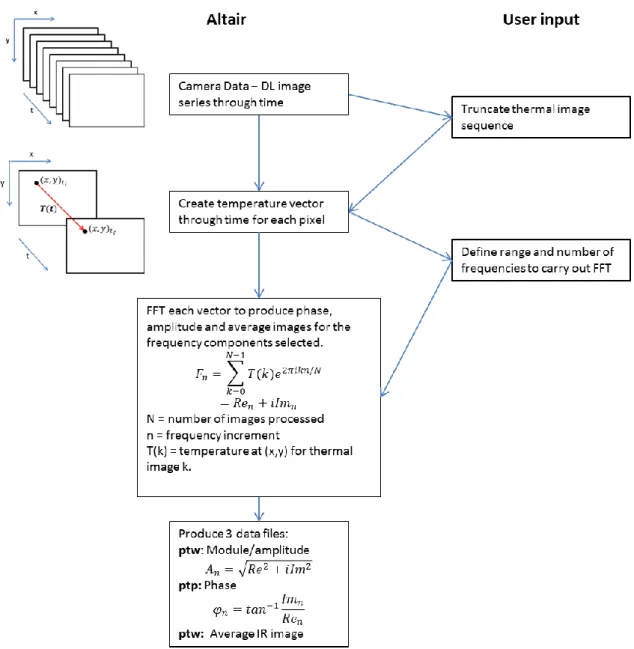
Figure 11 Temperature contrast ΔV against dimensionless time ωr for different values of thickness ratio, y [78]. ... 51 Figure 12 FWHM approach to sizing defects... 52 Figure 13 Schematic of PT/PPT experimental set-up. ... 55 Figure 14 Flow diagram illustrating data processing routine using Altair and
Altair LI. ... 57 Figure 15 Phase image of CFRP panel showing defect (1) and non-defect (2)
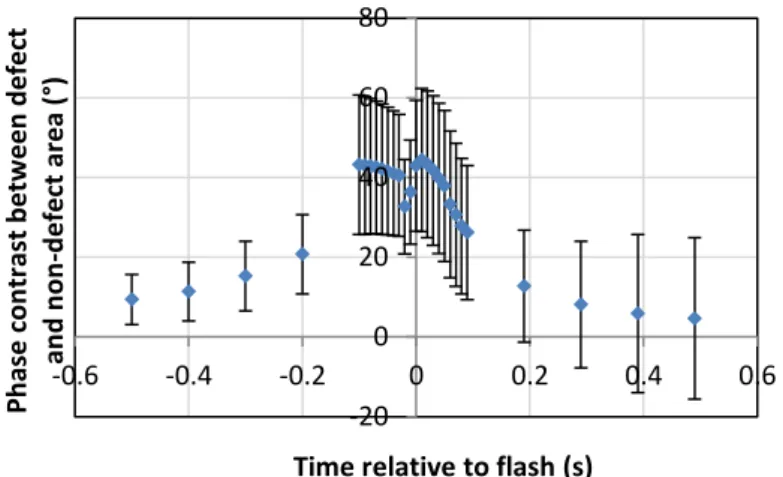
areas used for calculation of effect of processing parameters on phase contrast. ... 58 Figure 16 Effect of varying FFT start position relative to heat pulse on phase
contrast. ... 59 Figure 17 Variation of recording duration after heat pulse on phase contrast
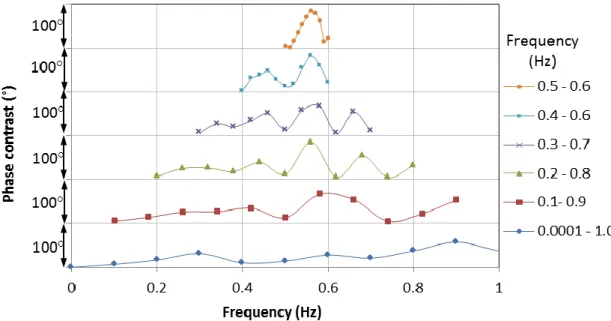
between defect and non-defect areas. ... 60 Figure 18 Phase contrast between defect and non-defect areas for a variety of
frequency ranges and intervals. ... 61 Figure 19 Frequency value used in FFT against the mean phase contrast for
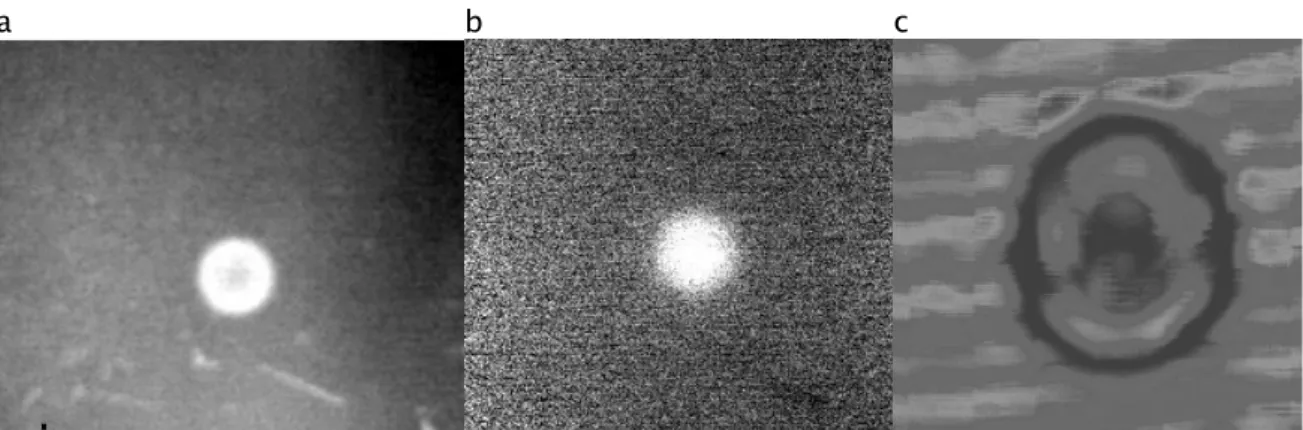
each sampling frequency found between defective and non-defective areas showing repeatability of phase data. ... 62 Figure 20 Aluminium with flat bottom hole simulated defects. ... 66 Figure 21 Experimental data for 10 mm diameter, 0.3 mm deep defect a)
thermal PT image, b) PPT phase image and c) UT image (spatial scale different to thermal data). ... 68 Figure 22 Phase difference images for aluminium plate with flat bottom holes
drilled to simulate defects of depths (left to right in each image) a) 1.3 and 1.1 mm, b) 0.9 and 0.7 mm and c) 0.5 and 0.3 mm from the front surface. ... 68 Figure 23 Profile plots taken across a) the deepest, 1.3 mm and b) the
shallowest, 0.3 mm, 16 mm diameter defects in the aluminium plate (estimated defect locations shown as a guide). ... 69
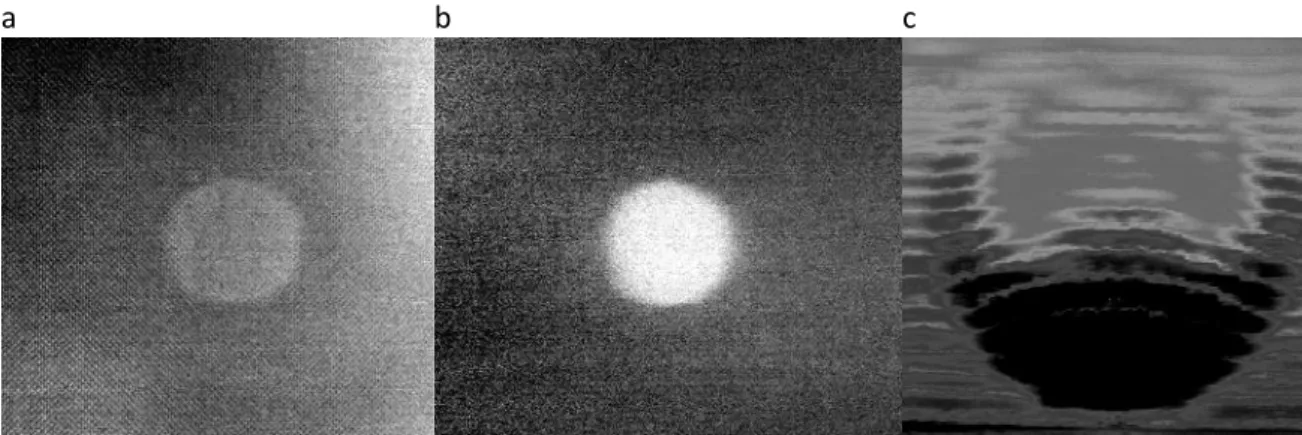
Figure 24 CFRP panel with PTFE inserts. ... 71 Figure 25 CFRP panel with aluminium and PTFE inserts. ... 72 Figure 26 Experimental data for CFRP with PTFE insert at 0.375 mm deep: a)
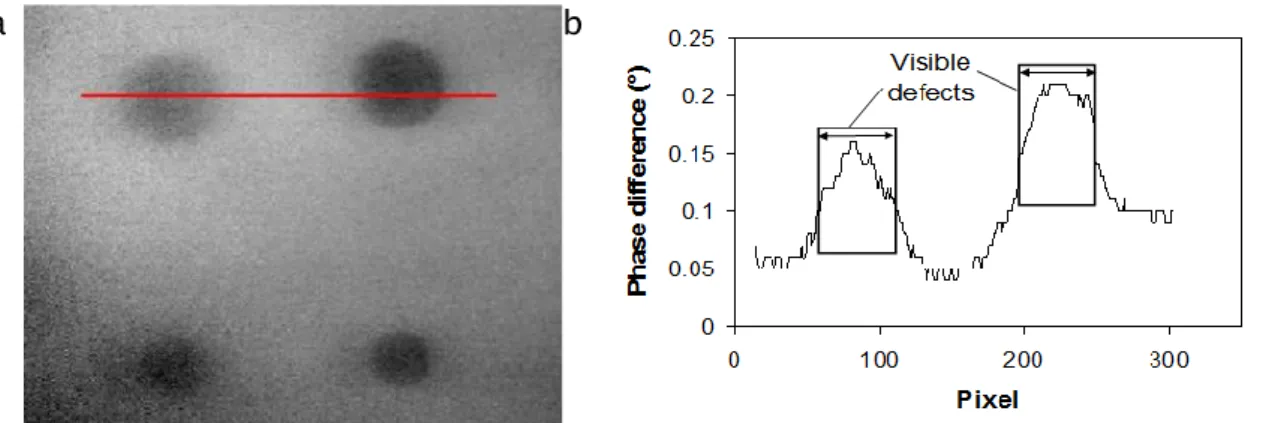
thermal PT image, b) PPT phase image and c) UT image. ... 73 Figure 27 a) Phase image for CFRP plate with PTFE inserts of diameters 20 mm
(top row) and 10 mm (bottom row) where the left defect of each size has depth 0.625 mm and the right 0.375 mm, b) Phase difference profile across all four defects in a). ... 74 Figure 28 PPT phase image showing the deeper PTFE defects detected using a
5 second heating from an IR lamp. Defects indicated by red arrows are found at depths of 1.75 mm (right) and the maximum tested depth of 2.00 mm (left). ... 75 Figure 29 PPT phase data of a CFRP panel containing a) PTFE and b) aluminium
inserts. ... 76 Figure 30 PPT phase contrast data taken across PTFE and aluminium defect in
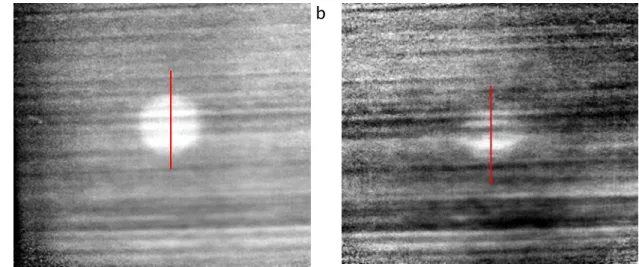
CFRP panel... 76 Figure 31 GFRP sample with 10 mm PTFE inserts at 0.2 and 0.4 mm. ... 77 Figure 32 a) Phase difference image showing PTFE inserts in GFRP at 0.2 mm
(upper defect) and 0.4 mm deep (lower defect) and b) phase profile across the upper defect with defect location estimated from a). ... 78 Figure 33 a) UT image of GFRP with PTFE at 0.2 and 0.4 mm deep using a very
high frequency probe (50 Hz) and b) PPT phase image of the same sample with voids highlighted in the red ovals. ... 79 Figure 34 sample diagrams for a) CFRP bonded panel with PFTE inserts and b)
CFRP single lap joint with PTFE insert. ... 81 Figure 35 a) PPT phase image of PTFE defects with epoxy film adhesive in
CFRP (4 ply) bonded joint. b) Profile plot taken across full image width through the three defects. Defect sizes 20, 10 and 5 mm.82
Figure 36 Experimental data for sample 3: a) PT thermal image at 0.514 s, b) PPT phase image at 0.053 Hz and c) UT image. ... 83 Figure 37 Profile plots taken across the width of the defect visible in the PPT
data shown in Figure 35a & b. ... 83 Figure 38 Modelled view of example sample with defect in 2D model. ... 88 Figure 39 Schematics of the four case study samples with heated surface
indicated by orange arrows. 1) flat bottom hole milled into aluminium, 2) CFRP with PTFE inserted between plies 3 and 4 from the front, 3) a CFRP single lap joint made with epoxy adhesive with a PTFE insert in the bond line between front adherend and adhesive. ... 91 Figure 40 Data point positions for comparisons between modelled and
experimental data. ... 92 Figure 41 Surface temperature data comparison of PT data for CS1 showing
modelled and experimental data for a) DC, b) DE, c) ND and d) all three data points. ... 95 Figure 42 Modelled and experimental surface thermal contrast data between
defect and non-defect regions. ... 95 Figure 43 Comparison between current ‘Southampton model’, virtual heat
source (VHS) model and experimental data for aluminium sample. ... 96 Figure 44 Surface temperature data comparison of PT data for CS2 showing
modelled and experimental data for a) DC, b) DE, c) ND and d) all three data points. ... 98 Figure 45 Modelled and experimental surface thermal contrast data between
defect and non-defect regions. ... 99 Figure 46 Surface temperature data comparison of PT data for CS3 showing
modelled and experimental data for a) DC, b) DE, c) ND and d) all three data points. ... 101
Figure 47 Modelled and experimental surface thermal contrast data between defect and non-defect regions... 102 Figure 48 Phase contrast between DC and ND for experimental and modelled
data for a) CS1: Aluminium, b) CS2: CFRP with PTFE, c) CS3: CFRP-CFRP adhesive lap. ... 105 Figure 49 a) ΔT values and b) Δϕ values as ratio between defect and bulk
thermal diffusivity, γD/γ0, is varied. ... 108 Figure 50 a) ΔT values and b) Δϕ values as ratio between defect and bulk
thermal effusivity, eD/e0, is varied. ... 110 Figure 51 a) Thermal contrast through time between the surface temperature
over the defect centre and a non-defect region for air gaps of 50 – 200 µm, b) maximum thermal contrast produced for varied air gap defects. ... 115 Figure 52 Lap joint specimen diagram giving sample geometry and tensile load
and resulting bending moment illustrated by the blue arrows.116 Figure 53 Failed lap joints containing no defect, Frekote mould release agent and silicon grease. ... 118 Figure 54 Schematic for TSA and PPT with the addition of static tensile load for
PPT and cyclic tensile load for TSA. ... 119 Figure 55 PTFE insert results a) TSA ΔT (3+1kN), b) TSA phase data, c) PPT
phase data (0 kN) and d) PPT phase data (3 kN). ... 121 Figure 56 a) Position of profile data and b) PPT phase contrast data taken
along the profile line across the PTFE insert for both the unloaded and 3 kN static loaded PPT results. ... 121 Figure 57 Silicon grease contamination results a) TSA ΔT (3+1kN), b) TSA
phase data, c) PPT phase data (0 kN) and d) PPT phase data (3 kN). ... 123 Figure 58 a) Position of profile data and b) PPT phase contrast data taken
along the profile line across the silicon grease contamination for both the unloaded and 3 kN static loaded PPT results. ... 123
Figure 59 Schematic of CFRP – Aluminium bonded joint with silicon grease kissing defect for vacuum loading. ... 126 Figure 60 PPT and vacuum loading schematic with two sided access for
feasibility study. ... 126 Figure 61 PPT phase data for the CFRP/Aluminium bonded sample a) unloaded
and b) full vacuum applied to the rear of the sample. ... 127 Figure 62 a) Phase contrast profiles taken across the defect location as shown
in Figure 61 for vacuum pressures between 0 and 100% and b) the mean Δɸ created by the defect at variable vacuum pressures.128 Figure 63 a) displacement across defect from defect centre (0 mm) to defect
edge (10 mm) and b) mean adherend displacement for varied applied vacuum pressure. ... 130 Figure 64 a) labelled diagram identifying PT setup and b) bolometer raw data.131 Figure 65 Bolometer profile data taken across the defect showing a) the raw
profile data and b) profile with thermal gradient removed. .... 132 Figure 66 a) Rigid Triplex and flexible Triplex adhesive bond containing PTFE
and silicon grease and b) flexible Triplex adhered to CFRP panel containing a single silicon grease simulated kissing defect. .. 137 Figure 67 Vacuum loading on CFRP-Triplex bond with simulated kissing
defect. ... 138 Figure 68 a) PT thermal and b) PPT phase for Triplex bonded joint using epoxy
film adhesive with PTFE insert. ... 138 Figure 69 Left: Temperature (left) and PPT phase (right) profiles taken across
PTFE defect in the Triplex joint with epoxy film adhesive... 139 Figure 70 PPT phase data for silicon grease defect indicated by the circle in a
Triplex bonded joint using epoxy film adhesive. ... 139 Figure 71 a) displacement across defect from defect centre (0 mm) to defect
edge (10 mm) and b) mean adherend displacement for varied applied vacuum pressure. ... 140
Figure 72 PPT phase data for the CFRP/Triplex bonded sample a) unloaded and b) full vacuum applied to the rear of the sample. ... 141 Figure 73 a) phase contrast profiles taken across the defect region under
vacuum loading conditions of 100% vacuum and 0% vacuum and b) the mean phase contrast between defect and non-defect regions taken across the width of the defect related to partial vacuum percentage applied. ... 142 Figure 74 a) CFRP reinforcement installed on bridge with the onsite set up of
PPT also shown on the decommissioned bridge and b) samples A and B. ... 144 Figure 75 a) Sample schematic and b) bridge composite repair schematic. .. 145 Figure 76 PT and PPT data for the largest defect in sample A to compare PT
and PPT techniques a) PT thermal image at 12.5 s, b) PPT phase image at 0.84 Hz. ... 146 Figure 77 Profile plots taken across the width of the defect visible in the PT
and PPT data shown in Figure 76a and b. ... 146 Figure 78 Sample A PPT data with red arrows indicating detected PTFE inserts
and yellow arrows indicating manufacturing defects. ... 147 Figure 79 Sample A UT data taken using a 30 MHz transducer using the
double through thickness method with a step size of 0.5 mm.147 Figure 80 Sample B PPT data with red arrows indicating detected PTFE inserts and yellow arrows indicating manufacturing defects. ... 147 Figure 81 Surface temperature data comparison of PT data for CFRP-Concrete
showing modelled and experimental data for a) DC, b) DE, c) ND and d) all three data points. ... 150 Figure 82 Modelled and experimental surface thermal contrast data between
defect and non-defect regions... 151 Figure 83 Phase contrast between DC and ND for experimental and modelled
Figure 84 PPT data of bridge reinforcement side 1 with yellow arrows indicating detected manufacturing defects. ... 152 Figure 85 PPT data of bridge reinforcement side 2 with yellow arrows
indicating detected manufacturing defects. ... 152 Figure 86 Bridge reinforcement side 1 – repeated visits a-d. ... 153 Figure 87 Bridge reinforcement side 2 – repeated visits a-d. ... 154 Figure 88 Samples provided containing various levels of porosity. Samples are
labelled 1, F and D, left to right. ... 156 Figure 89 Surface temperature evolution when heated in transmission mode
for the three samples. ... 157 Figure 90 PT transmission thermal data taken at 10 s for the three samples.157 Figure 91 Surface temperature evolution when heated in reflection mode for the three samples. ... 158 Figure 92 PT reflection thermal data taken at 0.175 s for the three samples.158 Figure 93 PT transmission data for the three samples unpainted. ... 159 Figure 94 PPT setup with two higher powered flash lamps for the large panels.161 Figure 95 PPT phase images of panel 5 – sandwich construction. ... 162 Figure 96 PPT phase images of Panel 6 – bonded skin construction. ... 163 Figure 97 GFRP block model a) schematic of geometry and b) FEA results for air
and PTFE insert at 5 and 15 mm. ... 165 Figure 98 Sandwich panel model a) schematic of geometry and b) FEA results
for 20 and 100 mm diameter air and PTFE inserts under the 5 mm thick front face sheet. ... 166 Figure 99 Bonded panel model a) schematic of the geometry and b) FEA results
for 20 and diameter air and PTFE inserts under the 15 mm thick front adherend. ... 167
DECLARATION OF AUTHORSHIP
I, Rachael Caroline Waughdeclare that the thesis entitled
Development of infrared techniques for practical defect identification in bonded joints
and the work presented in the thesis are both my own, and have been generated by me as the result of my own original research. I confirm that:
this work was done wholly or mainly while in candidature for a research degree at this University;
where any part of this thesis has previously been submitted for a degree or any other qualification at this University or any other institution, this has been clearly stated;
where I have consulted the published work of others, this is always clearly attributed;
where I have quoted from the work of others, the source is always given. With the exception of such quotations, this thesis is entirely my own work; I have acknowledged all main sources of help;
where the thesis is based on work done by myself jointly with others, I have made clear exactly what was done by others and what I have contributed myself;
parts of this work have been published as: Journal papers
Waugh, R. C., Dulieu-Barton, J. M. and Quinn, S., Infrared thermography to identify low volume defects in adhesive bonds, in preparation.
Waugh, R. C., Dulieu-Barton, J. M. and Quinn, S., Modelling and evaluation of pulsed and pulse phase thermography through application of composite and metallic case studies, NDT&E International, 66: p. 52-66. 2014.
Peer reviewed conference papers
Waugh, R.C., Dulieu-Barton, J.M. and Quinn, S. Defect detection using pulse
phase thermography – repeatability and reliability of data, Key Engineering
Materials Vols. 569 – 570, p. 1164-1169. 2013.
Waugh, R. C., Dulieu-Barton, J. M. and Quinn, S., Pulse phase thermography and its application to kissing defects in adhesively bonded joints, Applied Mechanics and Materials, 70, p. 369-374. 2011.
Signed: ………..
Acknowledgements
Thank you to Lloyds Register Foundation who financially supported this work. Special thanks to David Howarth at Lloyds Register for providing his knowledge and answering my questions. A massive thank you to my supervisors, Janice and Simon, for their guidance, motivation, and encouragement throughout the PhD. Also thank you to all my friends in the department; from lab buddies, to sporty break friends, to Friday beers attendees – thanks for keeping me sane. Thanks especially to Richard, Duncan and Andy for keeping the tea flowing. Thank you to all my family and friends for their support. A special thank you to Matt, for keeping me motivated throughout my PhD, supporting me when I needed it and taking me away to play when it was required. A big thank you to Antony who earns the prestigious title of ‘chief initial proof reader’. Finally, thank you to my Mum and Dad for giving me the courage to do what I want to do.
Nomenclature
γ m2/s Thermal diffusivity
ϕ ° Phase
ρ kg/m2 Material density
ω Dimensionless time for thickness of material ωr Dimensionless time for defect depth
e J/m2Ks0.5 Material effusivity
g m Small depth in material in which Q is absorbed uniformly
k Thermal image number
k W/mK Thermal conductivity
m kg Mass
t s Time
t0 s Initial time
u Initial temperature term
x m Depth from surface of material
y Ratio of defect depth to thickness of material
A Amplitude
C J/mol.K Heat capacity C(t) K Thermal contrast
L m Depth to defect
Lr m Depth of material
N Total number of thermal images
Q J Heat
T K Temperature
Ti K Temperature over area of interest
Ts K Temperature over known non-defective material T(x,0) K Initial temperature distribution
Abbreviations
CFRP Carbon fibre reinforced plastic
CT X-ray computed tomography
DC Defect centre
DE Defect edge
ECT Eddy current thermography
FEA Finite element analysis
FFT Fast Fourier transform
FT Flexible Triplex
FWHM Full width at half maximum
GFRP Glass fibre reinforced plastic
IR Infrared
LNG Liquefied natural gas
LT Lockin thermography
ND No defect
NDE Non-destructive evaluation
PPT Pulse phase thermography
PT Pulsed thermography
PTFE Polytetrafluoroethylene
PU Polyurethane
PUF Polyurethane foam
RT Rigid Triplex
SE Surface energy
TSA Thermoelastic stress analysis
TSR Thermal signal reconstruction
UD Unidirectional
1.
Introduction
1.1
Background and motivation
Advances in manufacturing techniques and the requirement to make structures lighter has led to the increased use of composite materials in a wide range of applications as they can offer significant weight saving advantages over their metallic counterparts. Drilling holes in composite components for joining using traditional mechanical fastenings, such as bolts or rivets, can lead to damage within the material. Mechanically fastened joints are also prone to large stress concentrations around fastenings through which the load is transferred. Adhesive bonds enable a more uniform load transfer through the joint thus removing the stress concentrations associated with mechanical fastenings [1]. The use of adhesive instead of mechanical fastenings also allows weight saving to be maximised, and adhesives provide high levels of corrosion resistance [2]. The advantages of using adhesive over mechanical fastenings have led to the increased use of adhesive joints. To date many of these uses have been in secondary structures. To allow adhesive joints to be used more widely in primary structural roles they must be known to be reliable [3]. A full understanding of the type and likelihood of defects that may affect the joint efficiency must be established. Therefore, non-destructive evaluation (NDE) inspection procedures must be developed that are able to detect all types of defects that can occur in adhesive bonds. Robust NDE approaches must be developed that are suitable for use during the manufacturing and construction stages as well as for through life assessment.
Current NDE for mechanical joints include X-ray radiography and ultrasound (UT). Inspection of composites is primarily carried out using UT, although shearography and thermography are also used [4]. Non-destructive assessment methods for bonded joints have generally followed those used for composites with UT being the most widely used. Current techniques are able to identify defects with a volume associated with them, such as voids, as they create sufficient contrast to the surrounding materials. Such contrast may be a variation in density, thermal properties or other material property differences. Defects with very small or negligible volume are known as kissing defects. Kissing defects are extremely difficult to detect and with current techniques
there is a high potential for them to go undetected. Research has been carried out into new or adapted NDE procedures that could be used to successfully identify kissing defects, e.g. [5]. To date such research has been mainly focused on ultrasonic approaches and several advanced ultrasonic inspection methods have been developed [6-8]. While these approaches have had success for specific applications or materials, none have been shown to be consistent and reliable at detecting low volume defects across a range of materials. Thermographic approaches are full field and so allow large areas to be evaluated efficiently [9]. An infrared detector is used that provides image based results that are easy to interpret. When considering the application of NDE on-site, thermography may be a practical and relatively robust approach. Thermography may also be applied with access to only one side of the joint as may be required in many in service or production situations [10].
The current research focuses on the use of thermography, specifically pulsed thermography (PT) and pulse phase thermography (PPT), for the identification of defects in adhesively bonded joints. Such a technique would be of great benefit in a range of industries including automotive and maritime. In the automotive industry the increased use of composite materials has led to an increase in adhesive bonds [11]. In the maritime industry a particular application has been raised in the construction of adhesive joints in large ship production, namely on the Gaz Transport and Technigaz (GTT) MkIII vessel. Within this sector of the ship building industry a good bond is assumed to be a good bond for life [D. Howarth, Lloyds Register, personal communication 17th November 2010], therefore any defective bonds need to be identified in the construction stages. Currently there is uncertainty in the reliability of the inspection techniques used to assess the adhesive joints sealing the secondary membrane pieces together. The ability to identify defects in the adhesive bonds that require repair in the production stages will decrease the need for the costly process of removing the ship from service for repairs in the future and increase confidence in the secondary membrane. This detection will lead to reduced material consumption and minimise waste, which will lead to an improvement in the sustainability of ship building and a reduction in the environmental impact of future ship repair.
1.2
Aims and objectives
The aim of the current research is to explore the potential of using thermographic methods to develop a reliable method of identifying kissing defects in adhesive bonds. The goal is to define the technology required to make a practical and portable device for NDE of adhesive bonds in the field. To achieve this goal it is necessary to address the following objectives:
1. Define the underlying physics of thermographic techniques with particular reference to pulsed and pulse phase thermography (PT/PPT). 2. Identify the potential and limitations of PT/PPT applied to a range of
metallic and polymer materials.
3. Define kissing defects and establish a method of accurately experimentally simulating and introducing kissing defects into structures.
4. Apply PPT to the experimentally simulated kissing defects and assess if they are detectable using the thermographic techniques.
5. Compare and validate PPT with other NDE methods such as water coupled ultrasound.
6. Develop a numerical model of the heat interactions in a structure to understand the physics of PT/PPT and tailor experiments to particular component configurations.
7. Assess how the technique may need to be adapted from the laboratory set-up to become a practical, portable tool for use in the field.
8. Consider the practicalities of applying PPT as a tool for use in a shipyard environment.
1.3
Novelty
The novelty of the current research described in the thesis may be categorised in two sections:
1. The development of a thermographic technique to enable kissing defect identification via the addition of a small load to enhance thermal contrast.
2. The development of a numerical model able to accurately simulate PT and PPT to establish the limits of defect detectability and investigate experimental parameters.
A literature survey has shown that it is not currently possible to consistently and reliably identify kissing defects in adhesively bonded joints [12]. The need for such an inspection technique is of interest to several industries including the marine industry where kissing defects are considered a problem in the adhesive bonded joints found in the MkIII LNG carrier [D. Howarth, Lloyds Register, personal communication 17th November 2010]. In studies that have used thermography to identify defects in adhesive bonds the defects of interest provide sufficient thermal contrast to facilitate their detection i.e. they have a volume associated with them, e.g. [13]. The nature of kissing defects suggests that such low volume defects cannot cause sufficient perturbation to heat propagation for detection using PT or PPT in standard application. A means of creating simulated defects that fit the criteria of real kissing defects so that experiments can be carried out on specimens with kissing defects at known locations to properly verify the methodology.
No published literature is available that investigates the effect of kissing defect visibility using the addition of a load while inspecting using thermographic approaches. A patent application [14] filed in 1999 describes very loosely this idea, without recourse to any experimental verification or numerical simulation. In the present thesis the use of a small load to open defects to enhance contrast has been explored in detail. It is shown in a laboratory based experiment using a test machine that the application of a small load enhanced the thermal contrast of kissing defects and enabled their detection where it was not previously possible. The feasibility of applying the load outside the laboratory was explored using a vacuum applied to one side of a join while PPT inspection was undertaken. Hence a significant contribution to knowledge has been made by the work described in the thesis by demonstrating the feasibility of developing a tool for application of thermographic techniques for onsite inspections.
Previous numerical models developed to simulate PT have attempted to inform experimental data collection parameters, such as the duration of data collection required, or predict defect depth [15, 16]. While some use is made
of these models it is the methods used to simulate defects within components that misses the complexity of a real defect. Previous models tend to model defects as either flat bottom holes, e.g. [16, 17] or areas of perfect insulation, e.g. [15]. Where defect material properties are considered, as in [18], the defect material is used to replace the full thickness of the adhesive layer. All of these approaches of modelling defects will enhance thermal contrast and simplify the thermal interactions. In the current work a new numerical model, is created that more accurately simulates defects, thus enabling the physical understanding of PT to be advanced. The model has enabled PT to be tailored to specific applications. The modelled PT data was then processed to provide a model for PPT. The model can also be used to assess defect detectability by defining the component material and the constituents of the defect and its depth. A further area of novelty is the use of the model to relate defect detectability to the contrast of defect and bulk material properties enabling predictions of potentially detectable / undetectable defects.
1.4
Structure of thesis
The thesis is comprised of ten chapters. Chapter 1 introduces the background and motivation for the work and describes the objectives set to achieve the project aims and the novelty found in the thesis. Chapter 2 begins by giving a general overview of adhesive bonding. The creation and categorisation of defects and specifically kissing defects is introduced and previous methods used to experimentally simulate defects, including flat bottom holes, inserts and liquid layer defects, are reviewed. The manufacturing methodology used to create the Triplex bonds found in the MkIII LNG carriers is then discussed. Current inspection techniques used to assess the quality of the Triplex bonds are then reported. The Triplex joints are discussed at this stage as they underpin some decisions when selecting appropriate NDE techniques.
In Chapter 3 current NDE techniques used for the inspection of composite materials across a range of industries and applications are assessed. A basic description of each technique is given before techniques specifically used for adhesive bonds are covered. The techniques are compared in terms of their suitability for onsite bond inspections before thermography is selected as a promising technique worth investigating further.
An overview of specific thermographic techniques is presented in Chapter 4 before pulsed and pulse phase thermography (PT/PPT) are identified as thermographic techniques of interest for the remainder of the thesis. The underpinning heat transfer physics that enables defect detection is introduced. The experimental setup and data processing associated with PT and PPT are then discussed. Experimental work begins by investigating the data processing variables and their impact on the contrast created between the data directly over the defect and that from a non-defect area. Such contrast is directly related to the detectability of a defect. This study is then used to aid in parameter selection in the remainder of the thesis
In Chapter 5 experimental work to establish the suitability of PT and PPT for a range of materials and defect types is described. An ultrasound (UT) C-scan system is used to enable comparison between the more established UT technique and the thermography methods. Work begins by testing isotropic material with strongly thermally contrasting flat bottom hole style defects before moving to more complex samples. Composite materials with insert style simulated defects are used to test the limits of detectability of PT and PPT and compare the two thermographic techniques. Bonded joints with insert ssimulated defects are then tested, where the advantages of PPT over PT become more obvious as PPT is able to reveal defects that PT cannot.
A numerical model developed using Ansys finite element software is presented in Chapter 6. The purpose of the model is to enable the ability of PT and PPT to identify defects in a range of applications to be investigated. The model is validated using three case studies. The model is then used as a predictive tool to investigate the detectability of defects of various materials in three bulk materials including aluminium and fibre-reinforced composites. Combinations of thermal properties of the bulk material and the defect are considered to define the limits of detectability. Kissing defects are shown as being below the identification thresholds due to the lack of thermal contrast between the bulk and defective materials.
Experimental work focusing on the identification of kissing defects is presented in Chapter 7. The conclusions of the model that kissing defects would not be identified using PT and PPT were confirmed. A methodology using the addition of a load to a sample to enable kissing defect identification
was introduced. Initial experiments focused on the use of a test machine to impart a load into single lap joint samples which showed the technique to be possible.
The success of the laboratory based tests then led to a feasibility study using the application of a vacuum to open simulated kissing defects in Chapter 8. A vacuum was applied onto the rear of a bonded joint to open the defect while the bond was inspected by using PPT on the front surface. A structural model was developed to identify the displacement required to enable defect detection. A further feasibility study into the use of a lower cost bolometer type infrared detector for the application of PT is also presented to give ideas for future work to develop the approach as a more affordable tool for industrial application.
In Chapter 9 a range of industrial applications of PT and PPT are reported to demonstrate the versatility of the technique to a variety of applications. A section covering the development of the technique through applications using the MkIII Triplex joints containing increasingly complex configurations and defect types is included. This section demonstrated the successful identification of an experimentally simulated kissing defect in a representative CFRP – Triplex bond using vacuum loading. The CFRP was used in this case to enhance the stiffness of the bond as it would be adhered to the insulation while maintaining the two sided bond access currently required for the vacuum application. Further studies undertaken into the identification and monitoring of defects in the adhesive bonds of CFRP repair patches in civil engineering structures, the identification of the level of porosity in adhesive bonds and finally the application of PPT to thick composite structures are also presented. Conclusions are drawn and future work is discussed in Chapter 10. The opportunities for future work include development of a complete tool combining the PPT and vacuum loading to enable single sided access to be enabled, implementation of automation procedures, greatly reducing man hours and the development of a combined thermal and structural model to be coupled with the developed tool.
2.
Adhesive bonding
2.1
Introduction
A thorough understanding of the types of defects that frequently occur in adhesively bonded joints is required. Any defect found in an adhesive bond has the potential to affect the strength of that bond. Industry requires a method of not only identifying such defects but also the setting of threshold criteria, to define acceptable / unacceptable defects. The threshold criteria are dependent on where the joint is to be deployed and tailored its application. The first step in this process is to categorise types of defects in adhesive bonds and then to develop reliable methods of NDE that can identify the defect type before tailoring the threshold criteria.
There are two fundamental methods in which an adhesive adheres to a substrate, mechanical interlocking and chemical interaction. Mechanical interlocking is dependent on the adherend surface finish. If a surface is very smooth there is no opportunity for mechanical interlocking, whereas if a surface is too rough air may become trapped in the troughs of the surface [19]. Both situations will reduce bond strength as the area of actual bonding is decreased. If any contamination, such as dust, is present on the adherend surface the adhesive will adhere to it, instead of the adherend, again reducing the total bonded area and weakening the joint. Chemical interactions or chemical bonding is governed by the Van der Waals forces interacting between molecules [20]. The combined strength of these forces varies for different types of materials and affects the surface energy (SE) of the adherend [21]. For a good bond to be produced a high SE is preferable, as this attracts the adhesive and enhances surface wetting [22]. A very low SE repels other materials and so bonding is much more difficult. Typically plastics tend to have low SE and so generally present challenges during bonding [20]. Polypropylene has the lowest surface energy of thermoplastics at 31.2 mN m-1, epoxy resin has a surface energy of 32.9 mN m-1, both very low when compared to metals and glass which have a surface energies of 1000 - 5000 mN m-1 and 300 mN m-1 respectively [23]. Most issues associated with bonding can be mitigated by appropriate adherend surface preparation and adhesive selection. Unfortunately in large structures perfect surface preparation is
difficult to achieve and there is a risk of contamination so there is a requirement to accurately inspect if defects have formed during the bonding process.
2.2
Defects in adhesive bonds
Several types of defects occur in adhesive bonds [24, 25]. These may be considered to fall into three main categories, see Figure 1. The first type is an inclusion, which is the physical inclusion of a foreign material in the adhesive joint, as in Figure 1a. This could occur, for example, if positioning tape is left on the adherend and has adhesive applied over it. The second type are voids, which is the inclusion of air in the joint, see Figure 1b. This could occur between the adhesive and adherend during joint assembly or be found in the adhesive itself if air is introduced during mixing of a two part adhesive. Voids may also be found in the adherend. The final category of defect are kissing defects, see Figure 1c. Kissing defects are the result of improper adhesion between the adhesive and the adherend where the adhesive / adherend interface is not as strong as expected for that joint configuration [26]. A decreased level of adhesion leads to reduced joint strength and is a significant threat to structural integrity. As all components of the joint are present and in contact, kissing defects are the most difficult type of defect to detect using NDE techniques as very little material property contrast is created.
a b c
Figure 1 Three categories of defects typically found in adhesive joints; a) inclusions, b) voids and c) kissing defects.
2.2.1 Adhesive bond failure
Adhesive bonds may fail in three ways [27]: Adherend failure
Cohesive failure Adhesive failure
If the bond fails via adherend failure the bond has been properly designed and manufactured, as the bond is not the weakest part of the structure and the adherend material has been used to its full potential. This type of failure is not due to problems with the bond. Cohesive failure is failure within the adhesive itself. This may be caused by excessive shear or peel stresses in the bond resulting from a poor joint design and is characterised by the presence of adhesive on both adherend surfaces of a failed joint. Adhesive failure is the failure between the adhesive and adherend, also known as interfacial failure and is caused by the improper preparation or pairing of the adherend and adhesive pairing. Adhesive failure is reported to only occur if there is a problem in the initial joint construction and is not caused through fatigue of the joint [28].
It is noted that for the early failure to be attributed to a kissing defect the failure mode must be adhesive, i.e. at the interface between the adhesive and adherend. As an attempt to quantitatively define a kissing defect a minimum strength reduction of 80% of the shear strength of a perfect joint found during a lap shear test has been suggested to confirm that joints contained kissing defects [29]. It is acknowledged that this criteria is partly arbitrary, although is based on the observed nature of kissing defects.
2.3
Laboratory created defects
In order to develop and understand NDE techniques components or specimens containing defects must be used. There are several methods commonly used for the creation of defects in a laboratory in metallic and composite samples. The most common methods shall be discussed in this section as well as a discussion specifically concerning the simulation of kissing defects.
Flat bottom holes
One of the most common techniques used to simulate defects in metallic materials and ceramics is to mill a flat bottom hole in the rear of the sample thus creating a locally thinned material to simulate a defect [30]. This method originated as a method of simulating corrosion in metals but has been used for other purposes and applied to the study of composites. While this method was appropriate to simulate the loss of material associated with corrosion it is not a realistic means of simulating a commonly occurring defect in composite materials that are not prone to corrosion although due to the strong contrast that flat bottom holes create they are often used when developing techniques in initial studies [31].
Inserts
The most common means of creating an experimentally simulated defect in a fibre reinforced composite material such as carbon fibre reinforced plastic (CFRP) and glass fibre reinforced plastic (GFRP) is the addition of an insert between plies during manufacture. There has been broad use of the addition of PTFE or Teflon inserts typically of circular or square geometry placed at various depths throughout the thickness of the component, e.g. [32-34]. PTFE inserts are typically used to simulate a delamination between plies. This type of experimentally simulated defect is easy to produce and gives an accurately known defect location and geometry.
‘Real’ damage
Impact damage is frequently introduced in a controlled manner with known impact energies to introduce a controlled experimentally simulated defect that is more realistic of a defect a component may acquire while in service, e.g. [35, 36]. Core crushing has also been introduced when looking at studying sandwich structures [33]. Finally, using composites it is generally possible to manufacture a sample that has an inherent weakness in its layup which is prone to failure in a particular mode and a particular location when subjected to loading. Such contrived samples have been used to produce delaminations in composites or disbonds in adhesive bonds [37]. The nature of creating a ‘real’ defect is that the precise location and geometry of the defect is not known prior to experiments therefore they can be used to conclusively
parameterise defect comparisons of a developing technique. The technique must then be compared to an established NDE technique or destructive testing undertaken to verify results.
2.3.1 Experimentally simulated kissing defects
Voids and inclusions are of known origin and are therefore relatively easy to recreate in the laboratory, however, the exact cause of kissing defects is unknown. Possible causes are thought to be contamination, abnormality in the adhesive chemistry or curing process, moisture ingress, residual stresses, or a combination of these factors [29, 38]. Several studies have focused on the recreation of kissing defects in the laboratory, e.g. [6]. Most have categorised kissing defects into two types, dry contact and liquid layer [39]. In a dry contact recreation, adhesive is applied to one adherend and cured. The other adherend is put in position and held in place by compressive loading, as shown in Figure 2a. No actual adhesion occurs between the adhesive and adherend. A liquid layer defect is achieved by the introduction of a thin layer of a contaminant such as grease at the adhesive/adherend interface, Figure 2b. The thickness of the contaminant is much thinner than the thickness of the adhesive layer but this thin defect has a detrimental effect on the strength of the joint.
Figure 2 Laboratory created defects, a) a dry contact compressively loaded defect and b) a liquid layer defect with a thin layer of contamination between adhesive and adherend.
2.4
GTT MkIII adhesive bonding and inspection
techniques
An application of concern in this work is the adhesively bonded Triplex joints found in the secondary membrane of GTT MkIII LNG carriers. As these joints are enclosed during construction of the vessel and unable to be accessed once completed, it is of paramount importance that they are inspected and found to be defect free, to avoid costly and disruptive remedial repair work having to be carried out during service.
2.4.1 Construction of Triplex adhesive bonds
In the MkIII carriers the liquefied natural gas (LNG) is stored in several tanks; each made using a membrane system. Working inwards from the inner hull of the ship, the system comprises of a secondary layer of insulation that is attached to the inner hull using mastic, a secondary membrane, a primary layer of insulation and a primary membrane which contains the LNG, see Figure 3. The primary membrane is 1.2 mm thick stainless steel, which is corrugated to allow for thermal expansion. The 1 m x 3 m steel sheets are robotically welded together using a TIG (tungsten inert gas) process. The primary and secondary insulation blocks are typically 100 mm and 170 mm thick respectively and are both made of polyurethane foam surrounded by plywood. The secondary membrane is constructed using a specialised Triplex material, which is a 0.7 mm thick sheet of aluminium with a layer of glass cloth on either side attached using a resin system, the specifics of which are confidential.
Figure 3 Schematic diagram of the insulation system for the GTT MkIII type LNG carrier membrane system tanks [40].
Prefabricated units comprising both layers of insulation and the secondary membrane measuring 3 m x 1 m are brought into the shipyard where they are attached to the inner hull. A piece of flexible Triplex (FT) is then used to join the rigid Triplex (RT) on the prefabricated boxes to form a continuous secondary membrane, Figure 4. The only difference between the two Triplex materials is the type of resin used to bond the glass fibre to the aluminium, which determines its flexible or rigid nature. In the RT epoxy resin is used and infused into the glass fibre whereas a layer of rubber adhesive is added in the FT. This difference allows the FT to be flexible, enabling easier application. Currently the FT is attached to the RT using either epoxy adhesive, which is applied by hand, or polyurethane (PU) adhesive, which is usually applied by an automated process but only in very small, specific areas of the ship. Due to the improved properties of the PU adhesive at low temperatures compared to the epoxy, there is a push towards using an increased amount of the PU. Epoxy remains the most widely used as manipulation times for the PU are insufficient for the manual application procedures used in most areas of the ships.
Figure 4 Construction of adhesive Triplex bonds in the secondary membrane of the GTT MkIII insulation system [40].
The vast majority of prefabricated units delivered to the shipyard are 3 m x 1 m, with special pieces being fabricated for the corners and more complex areas. These blocks are adhesively bonded and pinned to the inner hull [41]. Any gap between the prefabricated blocks is filled with more insulation. Adhesive is then applied to the RT and the FT is overlaid. The adhesive is hand spread to a thickness of between 0.2 - 0.8 mm, with an ideal thickness of 0.4 mm. In the epoxy adhesive a thickness of greater than 0.8 mm becomes too brittle when exposed to low temperatures and when the adhesive is less than 0.2 mm thick the strength of bonding is reduced. Although reducing the range of acceptable adhesive thicknesses would improve the quality of the joint while a manual application procedure is employed it is impractical to do so. The amount of adhesive applied is monitored by using a known weight of adhesive for a set area, which is typically a 3 m long bond or 0.3 m width. A pressure bag is then used to apply 150 g/cm2 of pressure, although pressures in the range 120 – 400 g/cm2 are acceptable. Pressures above 400 g/cm2 are not accepted as this leads to the adhesive being squeezed out from the joint and pressures less than 120 g/cm2 are considered insufficient to adhere the Triplex fully. The pressure is applied for 12 hours as the epoxy cures.
Tank spaces found in the MkIII are 60 m x 33 m x 75 m and in the current fleets there are 5 of these tanks. The total length of adhesive joints to be assessed in a single MkIII carrier is currently 50-60 km. There are plans to increase the size of the carriers to accommodate 12 tanks in the future, more than doubling the length of adhesive joints that require inspection.
2.4.2 Current testing techniques for Triplex bonds
Once the bond has cured and the pressure bag has been removed a series of inspection techniques are carried out. Squeezed out adhesive along the edges of the bonds is visually inspected. The quality of this squeezed out adhesive has been found to be indicative of the quality of the adhesive in the joint. For example, if there are air bubbles in the squeezed out adhesive there are typically air bubbles in the joint, leading to a reduction in the quality of the joint. In another visual test the surface of the FT is illuminated to allow shadows to be cast by any bumps on the surface. These could indicate any defects caused by larger air bubbles or any solid contamination. Another manual test is to take a thin object, such as a coin, and perform a tap test across the surface. Defects that cause a discontinuity below the surface of the material can be heard by the inspector. The effectiveness of this method is dependent on the skill and experience of the inspector. A final test that is carried out on junctions between different pieces of FT is a local tightness test [42]. A vacuum is applied encompassing the full width of the FT and sealed onto the RT. A soap solution is applied to the surface of the joint and as the vacuum is applied the joints are monitored to see if any bubbles form. These bubbles indicate that air is being pulled through the joint from the insulation side by the vacuum and so the joint is not air tight and may allow the LNG to leak through to the inner hull.
Once the construction is complete a total tightness test is carried out [42]. Leaks are detected by sensors between the primary and secondary membranes and the secondary membrane and the inner hull during construction. Nitrogen gas is pumped into the gap between the primary and secondary membrane. The detectors in the space between the secondary membrane and the inner hull monitor for leaks. Whilst this method allows leaks to be detected, it is extremely difficult to locate them accurately and expensive to repair them once they are already sealed into the membrane system.
If a defect or leak is detected by using any of the previously mentioned inspection techniques the joint must be removed and replaced or repaired. This is a costly process due to the nature and size of the joints. For example, if a leak is detected during the total tightness test then the primary membrane and primary insulation must be removed to access the joint. The Triplex joint
must then be disassembled without causing damage to the rigid Triplex or secondary insulation and the joint must be remanufactured. The remaining layers must then be reattached and retested. This is a very time consuming process that should be avoided if at all possible. If a leak is found during the vessel’s service then the ship must be taken out of service, costing the ship owners a substantial amount of money in revenue as well as the cost of the repair, which currently totals in the region of $15 million (USD) per incident depending on the extent of the repair required [D. Howarth, Lloyds Register, personal communication 30th March 2010].
As has been described, most current inspection techniques are manual. The practicalities of this lead to only selected ‘high risk’ areas of the ships being routinely tested, as a full inspection is impractical. Therefore there is demand for an automated inspection method that could quickly collect and process the data, identifying any problem bonds. The total length of the bonds of interest dictates that a time efficient NDE approach must be developed in order for it to be feasible for application in a shipyard.
2.4.3 Current research on Triplex bonds
The main subject of research related to the membrane style LNG carriers is sloshing investigations, e.g. [43, 44]. These studies focus on the effect of sloshing impact of the LNG on the membrane system and mitigation of excessive transfer of impact load to the primary insulation layer via the introduction of composite mats between the primary membrane and the primary insulation. The structural reliability of the membrane containment system under various capacity conditions has been investigated. This research has led to increased awareness of the most dangerous capacities to carry and so has resulted in new loading guidelines being established [45]. Other real scale experimental tests have been carried out focusing on the structural behaviour of the secondary barrier in a MkIII LNG carrier [46]. The structural response was studied for thermal and mechanical loading. Strains were measured via strain gauges and fibre Bragg gratings in the adhesive layer. This experimental work was then correlated with a finite element model. Three adhesive systems were compared: the standard epoxy adhesive used, the PU adhesive previously mentioned and an epoxy adhesive cured using a heat pad.
of the joint the impracticalities associated with the short work time of the PU and the added cost of the heated cure epoxy meant that currently joints continue to be constructed using the standard epoxy. As the standard epoxy provides a safety factor of more than six [46], a change in adhesive is not necessary to withstand the structural loading imparted on the Triplex joints in service.
A further study has investigated the use of a vibration isolation system to reduce the impact of cavitation caused during LNG boil off transmitted between the primary membrane and the primary insulation [47]. An E-glass/epoxy composite corrugated plate type vibration isolation system to be located beneath the primary membrane was developed, which was found to successfully reduce impact and protect the primary foam insulation with good fatigue resistance.
Research has also been carried out focusing on a slightly varied membrane design where the secondary barrier is simply made of aluminium and the insulation used is polyurethane foam (PUF) [48]. Cracks originating in the aluminium and propagating through the foam at low temperatures were found to be an issue in this construction. The addition of glass fibre in the PUF was found to be a solution. As the aluminium found in the Triplex material is faced with glass fibre the secondary membrane found in the MkIII has not been reported to experience cracking problems.
The main issue reported with the secondary membrane of the MkIII carriers is the detection of leaks, which leads to extremely costly repairs being required. Kim et al [49] have found the primary leakage path through the Triplex barrier to be at the interface between the flexible Triplex and the adhesive. It was shown that this was due to a lack of impregnation of the adhesive into the glass fabric caused by the high viscosity of the epoxy. Adapted curing cycles have been suggested, involving heating of the epoxy for an initial period, while fibre wetting takes place and then a reduced temperature while solidification of the epoxy occurs, thus avoiding introduction of thermal residual stresses. Whilst it was shown that this increased the adhesive impregnation of the fibres and thus reduced leakages it did not mention the cost associated with the heated curing regime and how realistic this is to implement in shipyards. Despite the promising results, to date there has been no application of this
![Figure 3 Schematic diagram of the insulation system for the GTT MkIII type LNG carrier membrane system tanks [40]](https://thumb-us.123doks.com/thumbv2/123dok_us/1867420.2772329/42.892.255.728.120.397/figure-schematic-diagram-insulation-mkiii-carrier-membrane-tanks.webp)
![Figure 4 Construction of adhesive Triplex bonds in the secondary membrane of the GTT MkIII insulation system [40]](https://thumb-us.123doks.com/thumbv2/123dok_us/1867420.2772329/43.892.185.621.117.366/figure-construction-adhesive-triplex-secondary-membrane-mkiii-insulation.webp)