VAR Model Averaging for Multi-Step Forecasting
Johannes Mayr
Dirk Ulbricht
Ifo Working Paper No. 48
August 2007
Ifo Working Paper No. 48
VAR Model Averaging for Multi-Step Forecasting
Abstract
Given the relatively low computational effort involved, vector autoregressive (VAR) models are frequently used for macroeconomic forecasting purposes. However, the usu-ally limited number of observations obliges the researcher to focus on a relatively small set of key variables, possibly discarding valuable information. This paper proposes an easy way out of this dilemma: Do not make a choice. A wide range of theoretical and empirical literature has already demonstrated the superiority of combined to single-model based forecasts. Thus, the estimation and combination of parsimonious VARs, employing every reasonably estimable combination of the relevant variables, pose a viable path of dealing with the degrees of freedom restriction. The results of a broad empirical analysis based on pseudo out-of-sample forecasts indicate that attributing equal weights systemati-cally out-performs single models as well as most more refined weighting schemes in terms of forecast accuracy and especially in terms of forecast stability.
JEL Code: C52, C53, E37.
Keywords: VAR-forecasting, model averaging.
Johannes Mayr
Ifo Institute for Economic Research at the University of Munich
Poschingerstr. 5 81679 Munich, Germany Phone: +49(0)89/9224-1228
Dirk Ulbricht
Ifo Institute for Economic Research at the University of Munich
Poschingerstr. 5 81679 Munich, Germany Phone: +49(0)89/9224-1301
1
Introduction
Given the relatively low computational effort involved, vector autoregressive (VAR) models are frequently used for macroeconomic forecasting purposes. However, the usually limited number of observations obliges the researcher to focus on a relatively small set of key variables, possibly discarding valuable information. Standard econometric techniques like iterative elimination of variables based on information criteria only provide an unsatisfactory solu-tion. This paper proposes an easy way out of this dilemma: Do not make a choice. A wide range of theoretical and empirical literature, e.g. Tim-mermann (2005) or Stock and Watson (2004) has already demonstrated the superiority of combined to single-model based forecasts. Thus, pooling the predictions derived of multiple parsimonious VARs, employing every reason-ably estimable combination of the relevant variables, poses a viable path of dealing with the dilemma of a limited number of observations. The aim of our paper is to test empirically how this can best be done.
Empirical contributions to the literature of forecast combination demonstrate that, due to the higher estimation uncertainty, estimating optimal weights via OLS often yields higher forecast errors than building the weights exclu-sively on the past forecast performance of the individual models employed in the averaging scheme. Furthermore a simple average of the forecasts of the individual models often dominates all more elaborate schemes, favoring equal weights. This phenomenon is known as the ”Combination Puzzle”. This paper tries to shed new light on this issue as it not only employs dif-ferent approaches of exploiting past information but tests mixtures of these approaches, too. Furthermore, in contrast to the existing literature that pre-dominantly focuses on forecast accuracy of the models, stability is examined rigorously as well. In order to choose the right model specification for future forecast purposes, the practioneer is typically not only interested in obtain-ing the best performobtain-ing model on average over time, but on the performance of the candidate approaches within different time periods as well. The en-suing analysis gives an insight into which model saves the forecaster from unwanted surprises. However, the most intriguing aspect of the analysis is the huge number of multivariate VAR models entering the combination ap-proach.
For every country sample 6885 models are iteratively estimated and pseudo out–of–sample forecast are derived. The analysis rests on a broad G4 data set employing 18 standard macroeconomic variables. The forecast combina-tion schemes considered comprise the simple equally weighted average, the trimming technique, the discounting method as well as restrictions concern-ing the maximum number of endogenous variables per sconcern-ingle model. When
it comes to forecast accuracy, the empirical results demonstrate that the VAR model-averaging approach consistently outperforms most of the em-ployed individual models and especially the – in most cases surprisingly hard to beat – autoregressive benchmark process. While the separate applica-tion of past-performance weights give a mixed picture when compared to the naive average, some combinations of different weighting schemes making use of past performance beat this benchmark considerably. However, the naive models in most cases do have a marked edge over past-performance schemes in terms of reliability. The structure of the paper is as follows. In Section 2, we present the theory of combining forecasts and describe the advantages of pooled forecasts in empirical applications. The VAR forecasting–framework, that builds the basis of our model averaging approaches is introduced in sec-tion 3. Secsec-tion 4 gives an outline of the relevant literature. The estimasec-tion and forecasting procedure of the individual VAR–models as well as the differ-ent pooling schemes employed are described in section 5. Section 6 presdiffer-ents the data and the results are reported in section 7. In section 8 we summarize conclusions and and point out our main findings.
2
Theory of Combining Forecasts
Optimizing forecasts is clearly associated with the unpredictability of the resulting forecast errors on the basis of information available at the time the forecast is made. Brown and Maital (1981) thereby differentiate between par-tial optimality, which refers to unpredictability of forecast errors with respect to some subset of available information, and full optimality that requires the forecast error to be unpredictable on the basis of all in formation available at the time the forecast is made. As, in general, models are only intentional abstractions of a more complex reality and thus are built on a subset of all information, it is common sense that in practice all forecasting models are at the most partial optimal and are thus misspecified in the context of full information. Under the assumption that information sets can be combined costlessly and without any time lag it is optimal to pool information sets and thus specify a model built on all information available at the time a forecast is derived. In practice however, pooling of information sets is typically im-possible or prohibitively costly. The idea of improving the accuracy of model based forecasts regarding a certain target variable by combining the forecasts of different models rather than the information sets was first published by Bates and Granger (1969) and has gained wide acceptance since then. Al-though the authors discussed only the combination of pairs of predictions, the procedure can easily be extended to the combination of a greater number
of single forecasts.
2.1
The optimal weights
2.1.1 Combination of a pair of forecasts
Following Bates and Granger (1969) we first consider the case of two single competing point forecasts,f1,tand f2,t, of some quantityyt, derivedhperiods
ago. As the single forecasts are assumed to be unconditionally unbiased, the forecast errors
ei,t =yt−fi,t, i= 1,2 (1)
are normally distributed, i.e.
ei,t ∼ ¡ 0, σ2 i ¢ , i= 1,2. (2) where σ2
i =var(ei,t) and σ1,2 =ρ1,2σ1σ2 denotes the covariance between e1,t
and e1,t and ρ1,2 is their correlation. The linear combination
ct=kf1t+ (1−k)f2t (3)
of the two forecasts, which is a weighted average, is then unbiased in the same sense, so that the forecast error of the combined forecast
ec,t =ke1t+ (1−k)e2t (4)
has zero mean and variance
σc2 =k2σ12+ (1−k)2σ22+ 2k(1−k)σ1,2 (5)
The optimal value kopt can thus be derived by minimizing the error variance
σ2
c, i.e. by differentiating (5) with respect to k and solving the first order
condition: kopt = σ 2 2−σ1,2 σ2 1+σ22−2σ1,2 (6) 1−kopt = σ2 1 −σ1,2 σ2 1 +σ22−2σ1,2 (7) Individual forecasts that yield a lower forecast error variance and are thus more accurate are assigned a higher weight in the combination process. The resulting forecast error variance of the combined forecast is then
σc2(kopt) = σ2 1σ22 ¡ 1−ρ2 1,2 ¢ σ2 1 +σ22−2ρ1,2σ1σ2 (8)
Empirically, the optimal weights can be derived as the coefficients in a regres-sion ofe2,tone2,t−e1,t, which is equivalent to the extended realization-forecast
regression
yt=α+β1f1,t+β2f2,t+εt (9)
with the restrictions α = 0 and β1+β2 = 1. Deriving the weights building
on this realization-forecast regression admits values for kopt outside the (0,1)
interval. A weight k, which is then equivalent to the coefficient β1, based on
an estimation of (9) is negative, whenever s1,2 > s22 and it exceeds a value of
one whenever s1,2 > s21, withsi, i= 1,2 being the sample standard deviation
and s1,2 denoting the sample covariance. However, a negative weight on an
individual prediction does not imply that the forecast should be omitted from the combination approach. As shown by e.g. Bunn (1985), whenever ρ1,2 >
σ2/σ1, the combination weights kopt that minimize the combined forecast
error variance σ2
c are no longer convex, so that one weight will exceed unity
and the other is negative. Under the assumption of unbiasedness of the individual predictions, it can be shown, that
σc2(kopt)≤min
¡
σ21, σ22¢. (10) The resulting predominance of combined to single model based forecasts is denoted as the diversification gain. This diversification gain is zero only in the following special cases:
• σ1,t or σ2,t equals zero
• σ1,t=σ2,t and ρ1,2 = 1
• ρ1,2 =σ1,t/σ2,t
To measure the potential diversification gain of a combination of two indi-vidual forecasts, one needs to build the ratio of σ2
c(kopt) to min(σ12, σ22). We
define κ=σ2/σ1 with κ <1, i.e. σ1 > σ2. The ratio is then calculated as
σ2 c(kopt) σ2 2 = 1−ρ 2 1,2 1 +κ2−2ρ1,2κ (11)
As shown by Timmermann (2005), the diversification gain is a complex func-tion of the correlafunc-tion between the forecast errors ρ1,2 and the ratio of the
variances of the forecast errors κ. The authors conclude that diversification through the combination of individual predictions is more effective when the ratio of the variances of the forecast errors equals one. The efficiency gain is then an increasing function of the correlation between the forecast errors.
2.1.2 Combination of multiple forecasts
The above described procedure of combining two individual forecasts can easily be extended to the combination of a greater number of single predic-tions. Let f0
t = (f1,t, f2,t, . . . , fn,t) denote n single unbiased forecasts of some
quantity yt, derived h periods ago. The linear combination
ct=k0ft (12)
with k0 = (k
1, k1, . . . , kn),k01 = 1, 0≤ki ≤1 (for all i) and 10 = (1,1, . . . ,1)
will then be unbiased as well. The optimal weightskoptof the single forecasts,
i.e. the weights that minimize the variance of the combined forecast errors can be calculated as
kopt =
¡
Σ−11¢/¡10Σ−11¢. (13)
Σ denotes the covariance matrix of the errors of the individual forecasts and is given as Σ = E(ete0t) with et = yt1− ft. Note that et represents the
vector of the forecast errors and ft denotes the vector of the forecasts of
the single models at time t. In general, values for k can be found, that generate a combined forecast ct which yields a smaller error variance than
each individual prediction. As the optimal combination weights kopt are a
priori unknown, they need to be estimated. The optimal weights can again be recognized as the coefficients in a extended realization-forecast regression of the form
yt=α+β1f1,t+β2f2,t+. . .+βnfn,t+²t (14)
with the restrictions α = 0 and Pni=1βi = 1, Granger and Ramanathan
(1984) suggested estimating the weights via OLS. In finite samples however, especially when the sample size is small relative to the number of candi-date forecasts, the OLS estimators are no longer consistent and the resulting estimation errors might cause a reversal of the underlying theoretical opti-mality result. A back door to this estimation problem, proposed by Bates and Granger (1969) and adopted by Stock and Watson (2004) is simply to neglect the estimation of a large number of covariances and thus of optimal weights. The idea behind their approach is to simply disregard any correlation be-tween the forecast errors of the single predictions and set all off-diagonal elements of the covariance matrix Σ equal to zero and thus largely reduce the number of estimated coefficients. The combination scheme thus weights the individual forecasts inversely to their relative mean squared forecast error (MSE). In the simpler case of combining two single forecasts the weights are then given as
k∗ opt = σ2 2 σ2 1+σ22 (15) 1−k∗ opt = σ2 1 σ2 1 +σ22 (16) The resulting forecast error variance is then
σ2 c(kopt∗ ) = σ2 1σ22(σ12+σ22+ 2ρ1,2σ1σ2) (σ2 1 +σ22) 2 . (17)
The ratio of the forecast error variance under the inverse MSE schemeσ2
c(kopt∗ )
and the forecast error variance under optimal combination weights σ2
c(kopt)
poses a measure for the loss in accuracy by disregarding any correlations between the forecast errors of the single predictions within the combination approach: σ2 c(k∗opt) σ2 c(kopt) = µ 1 1−ρ2 1,2 ¶ Ã 1− µ 2σ1,2 σ2 1 +σ22 ¶2! (18) Whenever σ1 6= σ2 and ρ1,2 6= 0, the ratio exceeds unity and thus ignoring
the correlations between the forecast errors of the single models yields to less accuracy of the combined predictions. Only when σ1 =σ2, the ratio equals
unity irrespective of the value of ρ1,2. Simplifying the estimation of weights
attributed to the single forecasts by setting all off-diagonal elements of the covariance matrix Σ equal to zero therefore yields only optimal results in large samples under the assumption of identical forecast error variances and truly uncorrelated forecasts. A more far-reaching simplification of the pooling scheme poses the attribution of equal weights to the individual forecasts. This approach is widely used, especially when the aim is at combining a large number of single predictions. The variance of the resulting forecast error is then given as
σ2 c(kequal) = 1 4σ 2 1 + 1 4σ 2 2 + 1 2σ1σ2ρ1,2 (19)
The ratio of the forecast error variances again measures the resulting loss in accuracy compared to case of using optimal weights:
σ2 c(kequal) σ2 c(kopt) = Ã (σ2 1+σ22) 2 −4σ2 1,2 4σ2 1σ22 ¡ 1−ρ2 1,2 ¢ ! (20)
The ratio exceeds unity unless σ1 = σ2. Attributing equal weights to the
individual forecasts is thus only optimal if all single predictions yield equal forecast error variances.
2.1.3 Gain of pooling forecasts in empirical applications
The predominance of forecast pooling against single-model based forecasts in empirical applications can be justified by a number of reasons. The above described diversification gain poses the major advantage of combined fore-casts towards predictions based on an individual model. Another important reason for using pooled forecast is that combined predictions are more robust to structural changes or breaks, caused e.g. by institutional or technologi-cal shocks, as they do not depend closely on the specifications applied to one individual model. The mis–specification of a single model thus effects the forecast performance only to a minor degree. The advantages of pooled forecasts gain even more relevance in the context of VAR–models. A vast body of empirical work examines instabilities in smaller econometric time series models, see e.g. Stock and Watson (1996), Stock and Watson (1999), Roberts (2004) and Clark and McCracken (2005) and a number of studies have shown that small-scale VAR-models maybe prone to instabilities, see e.g. Webb (1995), Boivin (1999), Cogley and Sargent (2001) and Cogley and Sargent (2005). Furthermore, combined forecasts are based on a broader in-formation set, as they take a greater number of variables into account. This is especially relevant for predictions derived from VAR models which are traditionally based on a limited number of variables, due to the degrees of freedom restriction and thus suffer from omitting relevant information. Sev-eral other arguments in favor of as well as against combination forecast have been proposed in the literature, see e.g. Timmermann (2005). Armstrong (2001) summarizes results from empirical studies of combining forecasts and proposes the following list of key principles:
• use different forecasting methods and/or data
• use at least five individual forecasts for combining
• use formal procedures for combining
• use equal weights when facing high uncertainty
• use trimmed means when combining more than 5 individual forecasts
• use weights based on track records
• use weights based on good domain knowledge
Additionally, he concludes that combining forecasts is particularly use-ful when there is
• uncertainty as to the selection of the most accurate forecasting method
• uncertainty associated with the forecasting situation
• high costs for large forecast errors
3
The VAR framework
In contrast to existing empirical studies that mainly use ADL–models, see e.g. Stock and Watson (2004), we build our forecast combination approach on vector autoregressive (VAR) models. Using VARs for macroeconomic fore-casting purposes follows the idea of first to exploit the dynamic correlation patterns among observed time series without imposing strong restrictions re-lating to the structure of the economy and then to use this information to predict likely future values for each of the endogenous variables within the VAR system. A VAR model in reduced form can be written as
Yt =µ+A1Yt−1 +. . .+ApYt−p +²t. (21)
The current values of each of the n endogenous time series Yt are thus
ex-pressed as a weighted average of the recent past values of all series within the system and a term µ that contains all deterministic influences such as constants and linear trends. When deciding on the number of lags included, one is faced with a trade-off: Choosing a short lag length p might restrict potential intertemporal dynamics and thus yield autocorrelated residuals. Choosing a higher order of lags might however lead to overparameterization problems. Due to insufficient degrees of freedom, the model parameters are then imprecisely estimated, yielding large standard errors and high estima-tion uncertainty.1 The use of information criteria that build on the likelihood
function guarantees the specification of parsimonious VAR models, as they not only reward goodness of fit, but include a penalty term, that is an in-creasing function of the number of estimated parameters. This penalty term thus discourages an overfitting of the system.
1This is a severe problem in forecasting as it has been shown that high estimation
un-certainty is likely to influence adversely the out–of–sample forecast performance of econo-metric models, see e.g. Fair and Shiller (1990)
Multi–Step Forecasting with VAR–models As, in general, all vari-ables in VAR systems are endogenous, the models do not need assumptions about the course of exogenous variables for the period of the forecast horizon and dynamic, multi–step forecasts are straightforward to compute. Unlike conditional forecasts, these unconditional predictions do not assume a spe-cific path of the future course of any exogenous influences. In our study, we derive multi–step forecasts of a VAR model by a recursive procedure of the following form:
Ytf+τ = ˆA1Yt+τ−1+. . .+ ˆApYt+τ−p (22)
Ytf+τ denotes the τ-step ahead forecast of Yt derived at time t and ˆAi with
i = 1, . . . , p denote the estimated coefficient matrices of the system. For
τ = 1, i.e. a one–step–ahead forecast, the predictions can be derived by simply inserting the observed values of the time series, whereas for τ >1 the predicted values are employed recursively, yielding aniterated multi–step or dynamic forecast. The underlying one–step estimation (21) that minimizes the the square of the one–step ahead residuals is the standard procedure, from which multi–step forecasts are obtained by iterated multi–step (IMS). An alternative approach for deriving multi–step forecasts widely used in lit-erature are predictions based on direct multi–step estimations (DMS), see e.g. Stock and Watson (2004). Similar to the above described iterated
multi–step approach for VARs, the procedure enables the forecaster to pre-dict values of a target more than one period ahead from simple regression models without making assumptions about the future path of an exogenous variable. The idea behind is to estimate a model which minimizes the de-sired multi–step function of the in–sample errors, thereby matching design and evaluation. Yet, it is a priori not univocal which of the two approaches yields more accurate forecasts and the results crucial depend on the struc-ture of the underlying data generating process (DGP) and thus the degree of model mis–specification and the size of the data sample. Chevillon and Hendry (2005) and Schorfheide (2005) found thatdirectmulti–step forecasts tend to be more accurate in small samples but restrict their conclusions to stationary models under the assumption of some forms of empirical model mis–specification. Furthermore, gains from DMS fade rapidly as the forecast horizon increases. In our case, the effects of model mis–specification should be mitigated when averaging a large number of single forecasts. Addition-ally, the use of data in levels yields non–stationary individual models. As it is thus unclear from the outset which of the competing approaches generates more accurate predictions, we restrict our analysis on iterated multi–step forecasts of parsimonious VAR–models.
4
Literature Rewiew
A vast body of empirical work has shown the predominance of combined over individual models with respect to forecast accuracy. Path-breaking work has been presented by Bates and Granger (1969). They analyze two different sets of forecasts of airline passenger data and conclude that pairwisely combined forecasts can result in lower forecast MSE than either of the individual fore-casts. Several years later Granger and Newbold (1976) analyzed forecasts for 80 monthly and 26 quarterly time series using three different extrapolation methods. The results for combinations of more than two forecasts confirmed the superiority of combination schemes to individual models. Granger and Ramanathan (1984) show that the optimal weights for the individual fore-casts entering the combination approach can be derived from an extended realisation–forecast regression and analyse different model specifications.
Jordan and Savioz (2002) find that, when forecasting Swiss inflation, a combination of forecasts derived from a number of parsimonious VAR-models predominates the single models and naive forecasts significantly in terms of out–of–sample forecast RMSE.2 They restrict their analysis by combining
forecasts only from a minor number of VAR-models, consisting of the same number of endogenous, yielding a maximum number of 6 individual forecasts. The simple average thereby poses the dominant weighting scheme when de-riving 4–quarters ahead pseudo out–of–sample predictions and outperforms schemes deriving optimal weights via realisation–forecast regressions. Within 8- and 12-quarters ahead forecast competitions however, pooling schemes based on OLS–regression estimated weights yield more accurate predictions of Swiss inflation. Furthermore their results suggest, that the forecast per-formance of the combined predictions improves with the number of forecasts included and with the number of variables entering the VARs.
Yang (2004) proposes an algorithm for combining forecasts for adapta-tion. His approach assigns weights to the candidate models according to their past performances and relies on the specification of the forms of the condi-tional distributions of the target variable given the past data and the current outside information. He theoretically shows that, compared to procedures which aim at selecting the best single model, combining with appropriate weights as done by the algorithm gives more stable predictions and accord-ingly yields a better forecast performance. Furthermore, studying linear combination schemes, he characterizes the ”price” for estimating ”optimal” weights in the sense of a lower prediction accuracy compared to the best linear 2The resulting Theil’s U of up to 0.25 gives a somehow biased picture compared to the
combination and quantifies this ”price” and the potential gains. His results show that combining does not necessarily improve forecast performance and that indiscriminate combining can yield a much worse performance compared to the best individual prediction. Additionally, the study supports the find-ings that a ”naive” pooling scheme, attributing equal weights, is capable of successfully balancing the potential gain of combination approaches and the complexity penalty.
Stock and Watson (2004) present a broad study on combined forecasts of inflation and GDP-growth for the G7 countries. They employ autoregres-sive distributed lag models (ADL) where every individual model comprises one additional explanatory variable. However, in contrast to the present ap-proach they employ a comparatively low number of individual models per iteration, per variable and country – the maximum number reaching 73 in-dividual forecasts. They consider different forecast horizons and examine the performance of pseudo out-of-sample forecasts in a recursive estimation and forecasting scheme. They find that some combination approaches consis-tently improve forecast accuracy and stability compared to individual ADL models and dynamic factor models as benchmark. They thereby measure accuracy by the Theil’s U with a AIC–optimized AR–process and stability as the rank stability between two subsamples. Consistent with the related literature, simple combination schemes that do not make use of the histor-ical performance outperform those combinations that do, i.e. the so called ”forecast combination puzzle” holds in their analysis.
Clark and McCracken (2004) examine the issue of including variables in forecasting models that have low predictive content. Through theoretical derivations and simulation studies they show the effectiveness of combining nested models. Their empirical analysis concludes that simple combinations of restricted and unrestricted models as well as Baysian Model Averaging ap-proaches do outperform each of the individual models with respect to forecast accuracy. The data sample used is comparably broad as the one of Stock and Watson (2004) and the analysis is implemented in a recursive scheme, as well. In contrast to the nested VAR models employed in the present study, however, they use simple ADL models.
Hendry and Clements (2004) examine the performance of pooled fore-casts in the presence of structural breaks and mis–specified models. Both, an empirical approach employing the data used by Bates and Granger (1969) and a Monte Carlo simulation using a non-constant data generating process confirm the predominance of the simple average of forecasts, outperforming the best individual predictions by far.
Employing a Monte Carlo study, Smith and Wallis (2005) show that only when the optimal weights of the single forecasts differ largely from equal,
the bias effect dominates the parameter estimation effect and a combination based on estimated weights outperforms a simple average. Following Bates and Granger (1969) and Stock and Watson (2004) they additionally conclude that if past performance of individual models is used to pool the forecasts, covariances between the single forecast errors should be neglected and the weights should be based on the inverse of the MSE alone. Revisiting the study of Stock and Watson (2003) deriving 2 and 4 quarter ahead forecasts of US real GDP growth and US Industrial Production growth, they show that the simple average forecasts slightly dominate weighted averages in terms of forecast MSE. However, as the differences are only minor, they conclude that the ”forecast combination puzzle” does not hold in their analysis.
In a recent study Clark and McCracken (2006) analyze the commonly observed instabilities of VAR models in the context of forecasts, employing US vintage data. Additionally to improving stability by using different esti-mation and forecasting methods such as differentiation, intercept correction and the use of different approaches to lag selection, they compare several model-averaging schemes. Their study focuses on 86 variations of the widely used standard model comprising GDP, interest rates and inflation measures, derived by adding additional variables. They find, that in view of the un-certainty due to structural breaks, model averaging techniques and Bayesian shrinkage methods present the most effective methods.
5
Implementation
5.1
Estimation and Forecasting of single models
The aim of our approach is to analyze whether the combination of forecasts from a broad range of parsimonious VAR models can outperform the forecasts of any single model with respect to accuracy and reliability. In order to give a robust empirical basis, the analysis is implemented for a G4 country data set. For each country we first select 16 candidate standard macroeconomic variables that are likely to explain real Gross Domestic Product (GDP) as our variable of interest. The variables are chosen on the basis of a priori knowledge about the correlations and interdependencies within the different economies. Given that real GDP forms part of every single model, we built the different VAR specifications by permuting the candidate variables and allowing for a maximum of up to 6 endogenous per single model, including real GDP. The specification of different models by permutating the candidate endogenous variables follows the idea that it is a prior impossible to discard a certain VAR–model specification, as VARs can only be seen as intentional
and strict abstractions of a more complex reality built on a tight subset of all information. The maximum number of variables per single model is chosen with regards to the limited number of observations in the time dimen-sion. Our procedure thus differs from earlier studies, see e.g. J. and Savioz (2003) and Lack (2006) as we do not determine the model structure via a search and evaluation process but include all combinations of the candidate variables available. Our procedure results in a large scale number of 6885 parsimonious VAR models for each of the countries which then built the ba-sis of our forecast combination scheme. To pose the analyba-sis of the forecast accuracy of the individual models, of the different combination schemes and the benchmark models on a robust basis, we estimate the single models using a recursive window approach spanning a period of 15 to 25 years, depending on the country under consideration and derive pseudo out–of–sample fore-casts of real GDP at each estimation step.3 Within the recursive approach,
the VAR models are re-estimated as the forecast origin, i.e. the point on the timeline where the forecasts start from, advances and more past data becomes available. Each iteration, the estimation sample is expanded one quarter and thus gradually growths in time. The lag lengths of the single VAR models is thereby dynamically optimized using the Aikaike informa-tion criteria (AIC). Based on the estimated coefficients of the models, the 1 to 8–step–ahead pseudo out–of–sample forecasts are derived at each itera-tion step, yielding an average number of 3.6 million single forecasts for every country. As a practioneer is typically interested in point forecasts of a cer-tain target variable, we leave the issue of interval forecasts to future research.
The Forecasting Experiment: The USA Case
Estimate Forecast k periods ahead
k = 1 k = 2 k = 3 ... k = 8 1970 Q1 −→1980Q1 1980 Q2 1980 Q3 1980 Q4 ... 1982 Q1 1970 Q1 −→1980Q2 1980 Q3 1980 Q4 1981 Q1 ... 1982 Q2 1970 Q1 −→1980Q3 1980 Q4 1981 Q1 1981 Q2 ... 1982 Q3 1970 Q1 −→1980Q4 1981 Q1 1981 Q2 1981 Q3 ... 1982 Q4 ... 1970 Q1 −→2004Q1 2004 Q2 2004 Q3 2004 Q4 ... 2006 Q1 3We repeated our analysis built on a rolling window estimation approach. Similar to the
recursive estimation and forecasting procedure, the model estimates are thereby updated with the timeline proceeding, but the size of the estimation sample is kept constant. As a new observation is added to the end of the sample, one quarter is removed from the beginning. In general, the out–of–sample accuracy of the single models’ forecasts decreased compared to the recursive window approach and the results are thus not reported in the following.
5.2
Forecast Combination
Forecast combination denotes the combination of two or more individual predictions from single models to produce one single forecast of a target variable. As discussed in chapter (4), various methods for the estimation of appropriate combination weights, i.e. the weights attributed to each of the single forecasts, have been proposed in the literature. In the following, we focus on the most promising approaches, according to earlier empirical results, see e.g. Stock and Watson (2004). Due to the large number of single models and forecasts, some of the standard combination procedures, such as estimating the combining weights via OLS or restricted least squares, see e.g. Granger and Ramanathan (1984), and thus accounting for correla-tions across forecast errors are inadequate in our context. As the number of regressors is proportionally high relative to the sample size, the OLS es-timators within a realization–forecast regression are not consistent and the combination approach does not yield forecasts that are asymptotically first– order optimal. Under a large number of single forecasts, the estimation of combination weights by regarding correlations across forecast errors leads to large estimation errors, due to difficulties in estimating the covariance matrix. According to Bates and Granger (1969) and Newbold (1974), we thus restrict our analysis to combination procedures that ignore these corre-lations. A number of alternative methods for combining a large number of single forecasts have been developed. The approaches differ in the way they use information on the historical forecast performance of the single models. Although there is evidence that nonlinear combination schemes can improve forecast performance, see e.g. Deutsch, Granger, and Terasvirta (1994), we restrict the analysis on linear combination approaches, as the number of sin-gle forecasts is too large for nonlinear combination schemes to be effective. Except for the naive weighting scheme, where all models are assigned equal weights, the past performance up to the point in timetthe forecast is derived builds the basis of the weights employed. The pure inverse RMSE–weighting scheme thereby poses the simplest approach. For the specification of the different weighting schemes employed, we use a generalized form of the out– of–sample RMSE as a measure of the past forecast performance, defined as: RMSE(λ)=qPtτ=t−p(yτ,hf −yτ)2∗λτ/p (23)
where 0 < λ ≤ 1 discounts the squared forecast errors and p denotes the forecast horizon length. If 0 < λ < 1, the term λτ gets smaller the older
the squared forecast errors are. The smaller λ is, the less weight is as-signed to more distant squared forecast errors and the more weight is given to more recent squared forecast errors. If λ equals one, all squared errors
are weighted equally regardless of their period τ yielding the simple inverse RMSE–weighting scheme. The weights ω(λ, π, ν)t+h,t,i of the modeliat time
t including integer(N/100∗π) models, i.e. the π percent models that per-formed best in the past, in the weighting scheme are then given by
ω(λ, π, ν)t+h,t,i = 1/RMSE(λ)ν t+h,t,i PN j=11/RMSE(λ)νt+h,t,j . (24)
π thus poses the trimming factor, ν is a measure of the general influence of a model´s past forecast performance on its weight. The closer ν is to zero, the less past performance as such influences the weights and the weighting scheme converges to the simple average. If ν = 0, the weight ω(λ, π, ν) attributed to model i equals 1/N, i.e. all models are weighted equally. If
ν ≥1 the past performance gets more decisive the higher ν is. The resulting weights are employed to form the combined h-horizon forecast ˆyc
t+h,t: ˆ yc t+h,t = N X i=1 ωt+h,t,i(λ, π, ν)ytf+h,t,i (25)
As no forecaster would consider predictions, that yield unrealistic future val-ues ex ante, individualh-step-ahead forecasts that imply growth rates of real GDP that exceed 2h-percent are temporarely discarded. We thereby allow a model that was excluded in a period, to re-enter the combination forecast with a weight unequal to zero in the following iterations. However, though the model itself is given a weight of zero in the respective forecasting period, the forecast error does enter the calculation of its further out–of–sample RMSE and thus reduces its weight in the following iterations, taking the temporary weakness into account. The first combined one–horizon forecast is based on the forecast errors of the eight preceding periods, and the n–horizon forecast is based on the 9-npreceding forecast errors. With each further iteration one additional forecast error is used in the composition of the individual weights. As no information is used, unknown to a forecaster in the period the forecast is derived, the weighted forecasts conceptionally follow the pseudo out–of– sample approach employed for the individual forecast. Thus, by calculating the weights using only information available to a forecaster in real time, this procedure allows for a direct and fair comparison of each of the combination schemes with the individual models.
6
The Data
The data entering the individual VAR–models that build the basis for our forecast combination approach are standard macroeconomic time–series and
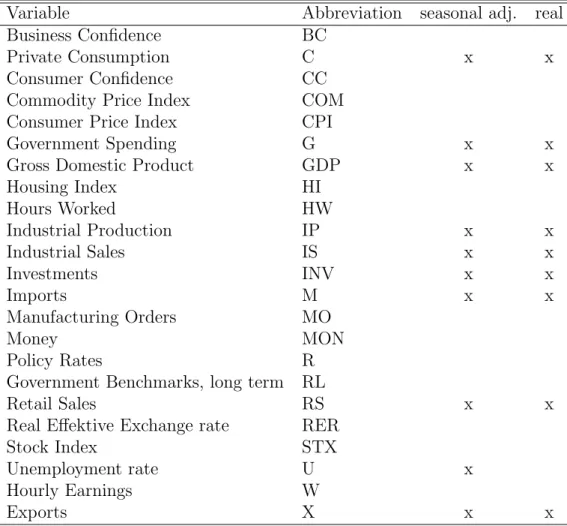
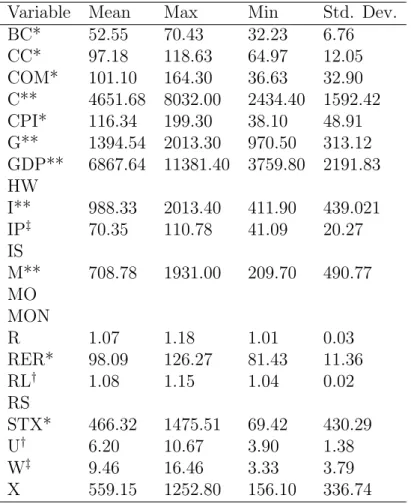
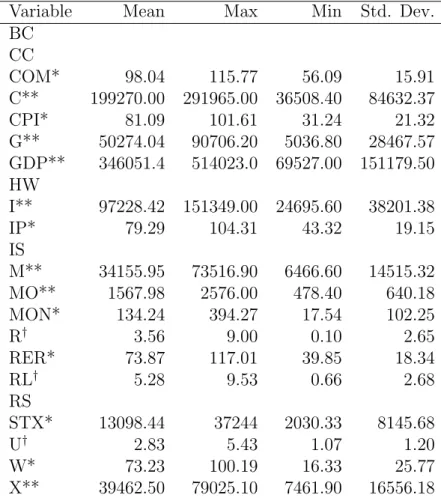
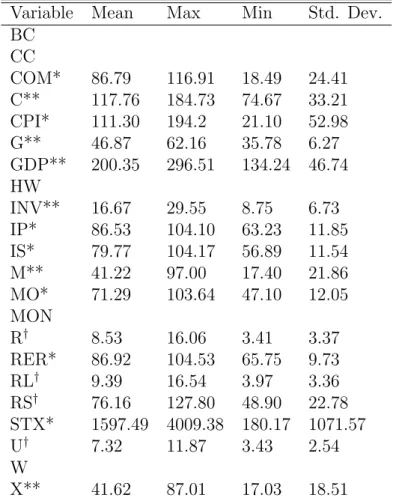
business–cycle indicators commonly used for forecasting real GDP. They have been mainly obtained from national statistic agencies, the International Mon-etary Fund (IMF) and Eurostat. As the analysis is implemented for the G4, the resulting data sets differ between the countries, especially in the case of business–cycle indicators. Table 2 in the appendix presents a complete list of the variables employed in the analysis. Furthermore tables 3 to 6 re-port some basic descriptive statistics of the time series on a country level. Additionally to a standard VAR–setup, widely used in literature when fore-casting quarterly real GDP, which comprises gross domestic product (GDP) as target variable, the short–term interest–rate (R) and an inflation measure (CPI), several candidate aggregates and indicators are included. A certain core group of macroeconomic aggregates, including the expenditure compo-nents of real GDP thereby forms part of each country data sets. Additionally to the imports series (M) and exports series (X), the real effective exchange rate (RER) as well as a commodity price index (COM) cover the external influences on a country´s real GDP. The interactions between monetary pol-icy and the real economy are further taken into consideration by including long–term interest rates (RL) and a measure of money supply (MON). La-bor market indicators are incorporated in terms of the official unemployment rate (U), hours worked (HW) as an indicator for volume of work and hourly earnings (W) as a measure for wages and salaries. The major stock–price indices (STX) and coincident and leading business–cycle indicators such as industrial production (IP), industrial sales (IS), manufacturing orders (MO) and producer (BC) and consumer sentiments (CC) complete the list of candi-date endogenous variables entering the single VAR–models. Given real GDP as target variable, the analysis is restricted to quarterly data. Employing such a broad set off candidate endogenous variables automatically limits the number of observations for the different countries due to data availability. The sample sizes, the date which poses the starting point for the recursive estimation and forecasting procedure as well as the resulting number of iter-ations are shown in 1 in the appendix. For each of the countries in the set, the sample ends with the 1st quarter 2006 and starts with the 1st quarter
1970 for the USA and Japan, with the 1st quarter 1972 for the UK and with
the 1st quarter 1991 for Germany. The restricted length of the German data,
yielding only 61 quarterly observations, is due to the break caused by the re–unification. The number of estimation and forecast iterations, thus ranges from 18 in the case of Germany to 97 for the USA and Japan.
7
Results
7.1
Forecast Accuracy
7.1.1 Measuring forecast accuracy
We evaluate the forecast accuracy of the different combination approaches in comparison to the individual VAR–models employing the out–of–sample Root Mean Squared Error (RMSE).4 The RMSE is calculated as
RMSE = v u u t TX+h t=T+1 (byt−yt)2/h (26)
However, as the values of the level series of real GDP differ largely between the countries under consideration, inter–country comparisons purely based on the out–of–sample RMSE yield strongly biased results. Therefore, the accuracy of the predictions of the different models are presented as Theil´s U, i.e. as a ratio of their out–of–sample RMSE to the out–of–sample RMSE of a univariate autoregressive benchmark model (AR).5 It is composed as
T heil´sU = RM SEi
RMSEAR
. (27)
If model i outperforms (underperforms) the AR–benchmark process its out– of–sample RMSE is smaller (bigger) than the one of the AR–Process and the resulting Theil’s U is smaller (bigger) than one. Thus, for each country, the Theil´s U gives the relative accuracy of the respective model i to the AR–benchmark. A value of 0.1 indicates an RMSEi that is only a tenth
of the RM SEAR. The use of Theil´s U thus enables us to compare the
relative forecast performance of the forecast combination approaches between the coutries. In the following, we report the results for a set of candidate pooling schemes and try to arrive at conclusions concerning recommendable specifications of the single models and the combination approach.
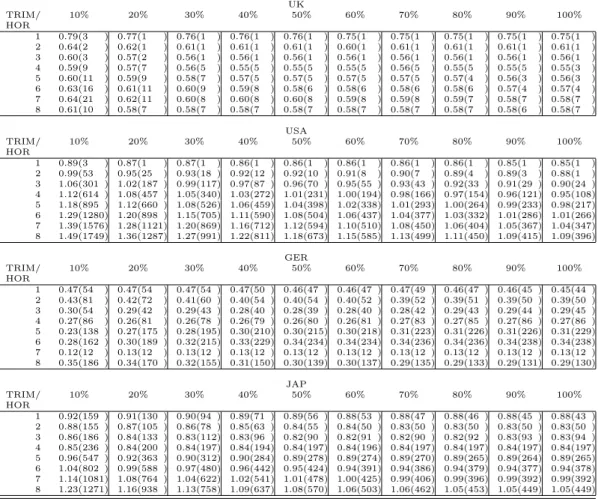
7.1.2 Optimizing the number of variables per VAR–model
Table 7 in the appendix explores the consequences of restricting the max-imum number of variables per individual VAR–model to less than 5. The 4Due to the huge number of single and pooled models, we abstain from employing more
sophisticated statistics testing for forecast accuracy.
5For each country, the specified AR–model stems from the permutation approach.
Fol-lowing the estimation set up of the single VAR–models, the lag length is again dynamically optimized using the AIC information criteria. The AR–benchmark thus additionally forms part of the different pooling schemes.
analysis thereby exclusively builds on combination schemes employing equal weights. In each of the country tables column one to five give Theil’U for the naive averages of the models containing up to one, two, three, four and five variables in addition to the GDP. The respective ranks of the models when compared to the whole set of individual models are given in brackets next to the Theil’s U. The rows give the results for each forecast–horizon between one and eight. The best model for each line is presented in fat letters. In al-most all model combinations, the naive average prediction beats the reference model. The best Theil’s U is given for the four–step forecast for Germany making use of models containing up to six variables yielding 0.32, while the worst Theil’s U is given by the eight–horizon forecast for the Japanese GDP employing up to three variables giving a Theil’s U of 1.07. For the US (British) data set, the naive combination approach even ranks top concerning forecast–horizons one to three (one and two). The worst rank is given for the five–step forecast of German GDP employing up to one variable yielding the 801thrank. However, it is still among the 12 percent best performing models
for this horizon. Overall, there is a clear tendency that the employment of more variables per individual model improves forecast accuracy of the naive combination approach. For 22 out of 32 country–horizon combinations the best naive pooled forecasts are obtained permitting up to 6 variables. Fur-thermore, the combined forecasts predominate the AR–benchmark model in terms of forecast accuracy measured by means of the out–of–sample RMSE distinctively.
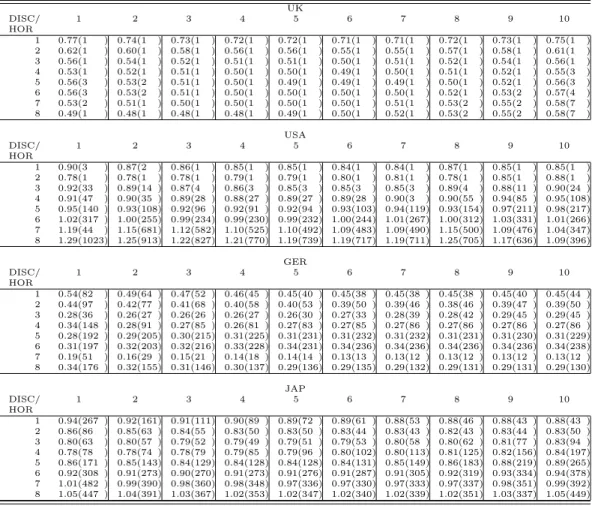
7.1.3 Trimming the worst performing models
Table 8 presents the results of the simple average combination schemes, dis-carding the models with the worst past performance. Thereby, trimming is analyzed separately, i.e. all models, whether they include one or six explana-tory variables are considered. The columns of each country table present the Theil’s U and the ranks obtained using only the 10 percent (20 percent, . . . , 100 percent) best performing models in the naive weighting scheme. Again, the rows give the results for the different forecast horizons. The maxima of the Theil´s U and the associated ranks within the total set of models increase with the exclusion of a higher number of models and thus with respect to the results of the non–trimmed naive pooling schemes presented above. While the best Theil’s U (Germany, 7th horizon, 10 percent best) is 20 percent
better than the best model observed so far with respect to the benchmark, the Theil’U of the worst model observed (USA, 8th horizon, 10 percent best)
performs 42 percent worse with respect to the benchmark. The latter also yields the worst rank giving 1749 which is a rank difference of 848 when
com-pared to the worst rank observed in case of the non–trimmed combination approaches. Conclusively, there are no clear signs, that discarding a certain set of worst performing models improves the overall performance of the simple combination scheme. In 19 out of 32 country–horizon combinations including the total set of single forecasts in the pooling approach, here labeled as the 100 percent column, dominate the best trimming scheme.
7.1.4 Discounted weights based on past forecast performance
The rows of Table 9 give the results of pooling schemes weighting the fore-casts of the individual models according to their past inverse out–of–sample RMSE. The squared errors used for the calculation of the RMSE are dis-counted as described above. The first column gives the Theil’s U and the respective ranks employing λ = 0.1, the next column using λ = 0.2 etc., so that the last line employing λ = 1, is equivalent to the weighting scheme based on the inverse RMSE alone, not employing any discount factor. As with the trimming scheme, employing weights based on past inverse out–of– sample RMSEs wides the maxima ranks compared to the case of the naive weighting scheme. Compared with the latter, the worst rank is 222 higher (USA, 8th horizon, λ = 0.1) showing a Theil’s U which is 22 percent higher
than the worst obvserved in emploing the naive pooling scheme. However, the best Theil’s U (Germany, 7th horizon ,λ = 1) is 19 percent better than
the best one in the naive scheme. None of the cases when the squared errors where not discounted gave the best performance, and in 217 out of 288 cases discounting outperforms non–discounting. Strikingly, for the UK sample, at least 6 pooled forecasts per horizon beat every individual forecast and the other 16 forecasts would at most lose out to 6 of the individual models. How-ever, their is no clear tendency that low discount values yield better results than high discount factors or viceversa. Furthermore, weighting the single models with regard to their past forecast performance does not predominate a simple equal weighted average. Nevertheless, discounting the inverse–RMSE based weights seems a promising approach.
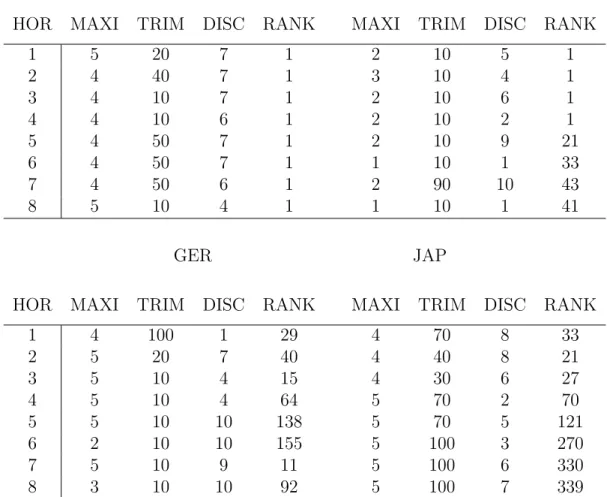
7.1.5 Searching for the best combination approach
The rows in table 10 give the Theil´s U and the respective ranks of the best models obtained when combining trimming and discounting schemes and/or naive weighting schemes on all variables or on subsets containing models that make use of up to a certain number of variables are applied. A describtion of the respective models is given in table 11. All but one of the pooled forecast(Japan, 8th-horizon) yielding a Theil’s U of 1.02 and the 339thrank
improve over the AR–benchmark model. At best the Theil’s U is 0.12 in the case of the 7-quarter-ahead forecast for Germany. For the UK-sample, the best weighting schemes rank first for all forecast horizons. While there is no such thing as an optimal weighting scheme that can be applied to ev-ery country or forecast horizon, nor any clear tendency, it can be observed, that weighting schemes outperform the AR–benchmark for all countries and almost all forecast horizons in the data. Furthermore, employing more en-hanced approaches than equal weighting schemes yields significant gains in terms of forecast accuracy. None of the models presented in tables 10 and 11 are outperformed by the naive weighting scheme. The good performance of some of the individual VAR-models is somewhat nonrelevant as it seems accidental for the forecaster to choose those a prior unknown models from the huge number of candidate rival VAR–specifications.
7.2
Forecast Stability
The forecaster is interested in models that constantly yield accurate predic-tions. Mainly due to structural breaks, single models typically do not perform constantly proper over a longer time period. Phases of high forecasting– performance alter with phases of sometimes very low forecast–accuracy in total as well as in relative examination. One of the main advantages of model–averaging approaches is their ability to lower the risk of choosing the wrong model at one specific moment on the timeline resulting in a high forecast error. In the following, we examine whether the pooling schemes employed here manage to deal with the forecast stability requirements. Two measures in this respect are applied.
7.2.1 Rank Stability
The first one is the rank–stability, i.e. the performance of a model relative to the others over time. Analogous to the out–of–sample RMSE, it is computed as the root of the average squared rank change over p periods:
Stability = v u u t TX+h t=T+1 (rankt−rankt−1)2/p (28)
Table 12 reports the stability of the best pooling schemes found – i.e. the specifications yielding the lowest out–of–sample RMSE – to the naive weighted approaches containing up to six variables per single model and to the average stability of the all individual models. The rows give the results
for the respective forecast horizons. For the best and the naive combination approach as well as for the average of the single models, the stability values decrease with the forecast horizon. Furthermore, for all horizons the best combination schemes as well as the naive average both considerably improve stability compared to the average of the individual models. The only ex-ception is the best three-quarter forecast for the UK. The simple forecast combination scheme, attributing equal weights, tends to be more stable than the best models found in the first four forecast horizons, while there is no such tendency for the longer forecast horizons. For the first to the fourth horizon forecast, only two best forecast models (GER, 3rd horizon and JAP,
2nd horizon) are more stable than the naive models. For the US (Japanese)
dataset, 3(5) out of 8 of the best model forecasts and 5 (6) out of 8 of the fore-casts applying the naive scheme are more stable than any individual model. The models are earmarked with a star.
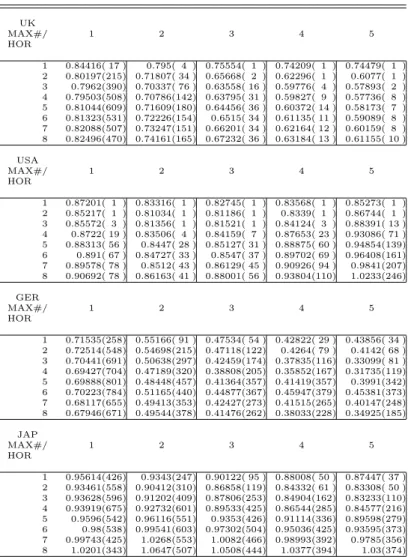
7.2.2 Maximum Jump
The second measure of forecast reliability employed here is the biggest jump (MAX) a model has made within the ranking of all models. It represents a worst case scenario the forecaster might be faced when choosing the re-spective model. The results are reported in Table 13, where the rows again give the respective forecast–horizons. The first, second and third column report MAX for the best pooling approaches, the simple average scheme and the five percent percentile (5PERC) of the individual models respectively. The fourth, fifth and sixth column show the differences between 5PERC and the best pooling schemes, 5PERC and the simple average forecasts and the difference between the best and the simple pooling schemes in terms of rank jumps. As expected, the forecasts of the best (naive) pooling approach clearly outperform the average individual model, giving MAX that are at least 351 (568) ranks better than 5PERC. However, the rank-differences be-tween the best and the naive models range from 1819 (UK 4th horizon) to
1208 (Germany 7th horizon). Still, with the exception of the first horizon for
Germany and the first horizon for Japan there are cleary two different pat-terns for Germany and the other three countries. For UK, USA and Japan the simple average schemes dominate the best combination approaches with respect to MAX. Only for Germany the opposite holds. The results resting on a solid empirical basis indicate that, on average, the combined forecast of real GDP outperform all specified single VAR models, including the univari-ate processes. the literature, the application of equal weights guarantees a good forecast performance and is hard to beat by more elaborate weighting schemes. Our approach offers the practitioner a tool that is easy to
8
Conclusion
This article proposes the applied forecaster a way of dealing with the vast amount of possibly relevant data making use of the widely used VAR method-ology. It tries to answer three aspects of her everyday work. Firstly, how to select the relevant variables when forecasting real GDP. Secondly, whether model averaging approaches ensure a higher forecast accuracy and forecast
reliability over time compared to single models. And finally, which of the candidate pooling schemes perform best regarding point forecasts of real GDP.
In doing this, a large number of parsimonious VAR–systems, employ-ing every reasonably estimable combination of a broad set of candidate vari-ables likely to explain real GDP are pooled making use of different weighting schemes – both individually and in mixed form. The resulting point forecasts are compared to the performance of single VAR– and benchmark models. The evaluation is implemented in a recursive pseudo out-of-sample analysis for a G4 country panel. The results show that in general, averaging a large num-ber of small VAR–models considerably improves both forecast accuracy and reliability compared to predictions based on single VAR–models, especially when forecast horizons up to four quarters are considered. Overall, 5 main findings concerning the forecast performance need to be pointed out: Firstly, in line with the existing literature the results report a clear tendency that the employment of more variables per individual model improves forecast accuracy of the naive combination approach. Surprisingly, with the forecast horizon growing, the stability of the forecasts increases. These results hold for all pooling schemes employed in the analysis. Secondly, focusing on the models with the best track record and thus discarding a certain percentage of the worst past performing models via a trimming scheme does not improve forecast performance of an equally weighted average. Thirdly, weighting the single VAR–models exclusively with regard to their past forecast performance does not yield a higher accuracy of present point forecasts. Fourthly, their is no clear tendency that discounting forecast errors within the calculation of inverse RMSE based weights improves forecast performance. And finally, there is not the optimal weighting scheme applicable to every country or forecast horizon. Even though the simple average poses a strong approach when forecasting real GDP and outperforms the AR–benchmark process as well as single parsimonous VAR–models, significant improvements can be achieved by combining past performance weights with discounting and trim-ming schemes, which perform poorly when applied alone. However, these gains come at the price of less stability. Employing equal weights ensures the most reliable forecasting approach compared to all single models as well
as to the competing pooling schemes. Overall, while we cannot support the ”combination puzzle” findings regarding forecast accuracy, we find empirical evidence regarding forecast reliability.
References
Armstrong, J. S. (2001): “Combining Forecasts,” in Principles of
Fore-casting: A Handbook for Researchers and Practitioners, ed. by J. S. Arm-strong. Kluwer Academic Publishers.
Bates, J., and C. W. J. Granger (1969): “The combination of
fore-casts,” Operations Research Quarterly, 20, 319–25.
Boivin, J. (1999): “Revisiting the Evidence on the Stability of Monetary
VARs,” Manuscript, Columbia University.
Brown, B., and S. Maital (1981): “What do economists know? An
empirical study of experts´ expectations,” Econometrica, 49, 491–504.
Bunn, D. (1985): “Statistical efficiency in the linear combination for fore-casts,” International Journal of Forcasting, 1, 151–163.
Chevillon, G., and D. F. Hendry(2005): “Non-parametric direct
multi-step estimation for forecasting economic process,” International Journal of Forecasting, 21, 201–218.
Clark, T., and M. McCracken (2004): Improving Forecast Accuracy
by Combining Recursive and Rolling Forecasts. Federal Reserve Bank of Kansas City.
(2005): “The Predictive Content of the Output Gap for Inflation: Resolving In–Sample and Out–of–Sample Evidence,” Journal of Money, Credit, and Banking.
(2006): Averaging Forecasts from VARs with Uncertain Instabilities. Research Division, Federal Reserve Bank of Kansas City.
Cogley, T., and T. Sargent (2001): “Evolving Post-World War II US
Inflation Dynamics,” NBER Macroeconomics Annual, 16(1), 331–73.
Cogley, T., and T. J. Sargent (2005): “Drifts and Volatilities:
Mone-tary Policies and Outcomes in the Post WWII US,” Review of Economic Dynamics, 8(2), 262–302.
Deutsch, M., C. W. J. Granger, and T. Terasvirta (1994): “The
combination of forecasts using changing weights,” International Journal of Forecasting, 10(1), 47–57.
Fair, R. C., and R. J. Shiller (1990): “Comparing Information in Fore-casts from Econometric Models,”American Economic Review, 80(3), 375– 389.
Granger, C., and P. Newbold (1976): “Forecasting Transformed
Se-ries,” Journal of the Royal Statistical Society, B 38, B 38.
Granger, C. W. J., and R. Ramanathan (1984): “Improved methods
for combining forecasts,” Journal of Forecasting, 3, 197–204.
Hendry, D., and M. Clements (2004): “Pooling of forecasts,” The
Econometrics Journal, 7(1), 1–31.
J., J. T., and M. R. Savioz(2003): “Does it Make Sense to Combine
Fore-casts from VAR Models? An Empirical Analysis with Inflation ForeFore-casts for Switzerland,” Swiss National Bank Quarterly Bulletin, 4.
Jordan, T.,and M. Savioz(2002): “Does It Make Sense to Combine
Fore-casts from VAR Models: An Empirical Analysis with Inflation ForeFore-casts for Switzerland,” SNB Quarterly Bulletin, 4, 80–93.
Lack, C. (2006): “Forecasting Swiss inflation using VAR models,” Swiss
National Bank Economic Studies, 2.
Newbold, P. (1974): “The exact likelihood function for a mixed
autoregressive-moving average process,”Biometrika, 61(3), 423–426.
Roberts, J. (2004): Monetary Policy and Inflation Dynamics. Divisions of
Research & Statistics and Monetary Affairs, Federal Reserve Board.
Schorfheide, F. (2005): “VAR Forecasting under Misspecification,”
Jour-nal of Econometrics, 128, 99–136.
Smith, J., and K. F. Wallis (2005): “Combining Point Forecasts: The
Simple Average Rules, OK?,” Discussion paper, Department of Economics.
Stock, J., and M. Watson(1996): “Evidence on Structural Instability in
Macroeconomic Time Series Relations,” Journal of Business & Economic Statistics, 14(1), 11–30.
(1999): “Forecasting Inflation,” .
(2003): “How did leading indicator forecasts do during the 2001 recession,”Federal Reserve Bank of Richmond Economic Quarterly, 89(3), 71–90.
Stock, J., and M. Watson (2004): “Combination Forecasts of Output Growth in a Seven-country Data Set,” Journal of Forecasting, 23, 405– 430.
Timmermann, A. (2005): “Forecast Combinations,” in Handbook of
Eco-nomic Forecasting, ed. by G. C. W. J. Elliott, G., and A. Timmermann. North Holland.
Webb, R. (1995): “Forecasts of Inflation from VAR Models,” Journal of
Forecasting, 14(3), 267–285.
Yang, Y. (2004): “Combining Forecasting Procedures: Some Theoretical
A
Tables
Country sample 1st iteration # iterations
Germany 1991:1 - 2006:1 1999:4 18
Japan 1970:1 - 2006:1 1980:1 97
UK 1972:1 - 2006:1 1982:1 89
USA 1970:1 - 2006:1 1980:1 97
Variable Abbreviation seasonal adj. real
Business Confidence BC
Private Consumption C x x
Consumer Confidence CC
Commodity Price Index COM
Consumer Price Index CPI
Government Spending G x x
Gross Domestic Product GDP x x
Housing Index HI Hours Worked HW Industrial Production IP x x Industrial Sales IS x x Investments INV x x Imports M x x Manufacturing Orders MO Money MON Policy Rates R
Government Benchmarks, long term RL
Retail Sales RS x x
Real Effektive Exchange rate RER
Stock Index STX
Unemployment rate U x
Hourly Earnings W
Exports X x x
Variable Mean Max Min Std. Dev. BC* 52.55 70.43 32.23 6.76 CC* 97.18 118.63 64.97 12.05 COM* 101.10 164.30 36.63 32.90 C** 4651.68 8032.00 2434.40 1592.42 CPI* 116.34 199.30 38.10 48.91 G** 1394.54 2013.30 970.50 313.12 GDP** 6867.64 11381.40 3759.80 2191.83 HW I** 988.33 2013.40 411.90 439.021 IP‡ 70.35 110.78 41.09 20.27 IS M** 708.78 1931.00 209.70 490.77 MO MON R 1.07 1.18 1.01 0.03 RER* 98.09 126.27 81.43 11.36 RL† 1.08 1.15 1.04 0.02 RS STX* 466.32 1475.51 69.42 430.29 U† 6.20 10.67 3.90 1.38 W‡ 9.46 16.46 3.33 3.79 X 559.15 1252.80 156.10 336.74
Note: * marks variables that represent indices, ** are level data given in Billion USD, † are percentage variables, and ‡
indicate variables in USD.
Variable Mean Max Min Std. Dev. BC CC COM* 98.04 115.77 56.09 15.91 C** 199270.00 291965.00 36508.40 84632.37 CPI* 81.09 101.61 31.24 21.32 G** 50274.04 90706.20 5036.80 28467.57 GDP** 346051.4 514023.0 69527.00 151179.50 HW I** 97228.42 151349.00 24695.60 38201.38 IP* 79.29 104.31 43.32 19.15 IS M** 34155.95 73516.90 6466.60 14515.32 MO** 1567.98 2576.00 478.40 640.18 MON* 134.24 394.27 17.54 102.25 R† 3.56 9.00 0.10 2.65 RER* 73.87 117.01 39.85 18.34 RL† 5.28 9.53 0.66 2.68 RS STX* 13098.44 37244 2030.33 8145.68 U† 2.83 5.43 1.07 1.20 W* 73.23 100.19 16.33 25.77 X** 39462.50 79025.10 7461.90 16556.18
Note: * marks variables that represent indices, ** are level data given in Billion YEN, and† are percentage variables.
Variable Mean Max Min Std. Dev. BC CC COM* 86.79 116.91 18.49 24.41 C** 117.76 184.73 74.67 33.21 CPI* 111.30 194.2 21.10 52.98 G** 46.87 62.16 35.78 6.27 GDP** 200.35 296.51 134.24 46.74 HW INV** 16.67 29.55 8.75 6.73 IP* 86.53 104.10 63.23 11.85 IS* 79.77 104.17 56.89 11.54 M** 41.22 97.00 17.40 21.86 MO* 71.29 103.64 47.10 12.05 MON R† 8.53 16.06 3.41 3.37 RER* 86.92 104.53 65.75 9.73 RL† 9.39 16.54 3.97 3.36 RS† 76.16 127.80 48.90 22.78 STX* 1597.49 4009.38 180.17 1071.57 U† 7.32 11.87 3.43 2.54 W X** 41.62 87.01 17.03 18.51
Note: * marks variables that represent indices, ** are level data given in Billion GBP, and† are percentage variables.
Variable Mean Max Min Std. Dev. BC* 95.24 106.1 86.20 4.76 CC COM* 100.23 114.80 94.00 4.66 C** 281.32 302.86 245.8 17.12 CPI* 97.56 110.07 80.13 7.51 G GDP* 95.24 105.26 84.91 6.32 HW‡ 12193.84 13202.10 11645.60 384.03 I** 100.43 111.65 92.36 4.74 IP* 95.23 107.93 85.77 5.50 IS M* 147.00 222.04 99.11 36.29 MO* 90.24 116.76 73.00 11.50 MON* R† 3.38 8.58 1.00 2.24 RER* 107.53 119.73 98.01 5.46 RL† 5.51 8.51 3.17 1.47 RS STX* 3719.63 7359.85 1494.99 1693.72 U† 8.10 10.00 5.53 1.20 W* 209.68 229.89 167.70 17.15 X* 153.23 249.59 95.89 46.29
Note: * marks variables that represent indices, ** are level data given in Billion EUR, † are percentage variables, and ‡ indicate
variables in hours.
UK MAX#/ 1 2 3 4 5 HOR 1 0.84416( 17 ) 0.795( 4 ) 0.75554( 1 ) 0.74209( 1 ) 0.74479( 1 ) 2 0.80197(215) 0.71807( 34 ) 0.65668( 2 ) 0.62296( 1 ) 0.6077( 1 ) 3 0.7962(390) 0.70337( 76 ) 0.63558( 16 ) 0.59776( 4 ) 0.57893( 2 ) 4 0.79503(508) 0.70786(142) 0.63795( 31 ) 0.59827( 9 ) 0.57736( 8 ) 5 0.81044(609) 0.71609(180) 0.64456( 36 ) 0.60372( 14 ) 0.58173( 7 ) 6 0.81323(531) 0.72226(154) 0.6515( 34 ) 0.61135( 11 ) 0.59089( 8 ) 7 0.82088(507) 0.73247(151) 0.66201( 34 ) 0.62164( 12 ) 0.60159( 8 ) 8 0.82496(470) 0.74161(165) 0.67232( 36 ) 0.63184( 13 ) 0.61155( 10 ) USA MAX#/ 1 2 3 4 5 HOR 1 0.87201( 1 ) 0.83316( 1 ) 0.82745( 1 ) 0.83568( 1 ) 0.85273( 1 ) 2 0.85217( 1 ) 0.81034( 1 ) 0.81186( 1 ) 0.8339( 1 ) 0.86744( 1 ) 3 0.85572( 3 ) 0.81356( 1 ) 0.81521( 1 ) 0.84124( 3 ) 0.88391( 13 ) 4 0.8722( 19 ) 0.83506( 4 ) 0.84159( 7 ) 0.87653( 23 ) 0.93086( 71 ) 5 0.88313( 56 ) 0.8447( 28 ) 0.85127( 31 ) 0.88875( 60 ) 0.94854(139) 6 0.891( 67 ) 0.84727( 33 ) 0.8547( 37 ) 0.89702( 69 ) 0.96408(161) 7 0.89578( 78 ) 0.8512( 43 ) 0.86129( 45 ) 0.90926( 94 ) 0.9841(207) 8 0.90692( 78 ) 0.86163( 41 ) 0.88001( 56 ) 0.93804(110) 1.0233(246) GER MAX#/ 1 2 3 4 5 HOR 1 0.71535(258) 0.55166( 91 ) 0.47534( 54 ) 0.42822( 29 ) 0.43856( 34 ) 2 0.72514(548) 0.54698(215) 0.47118(122) 0.4264( 79 ) 0.4142( 68 ) 3 0.70441(691) 0.50638(297) 0.42459(174) 0.37835(116) 0.33099( 81 ) 4 0.69427(704) 0.47189(320) 0.38808(205) 0.35852(167) 0.31735(119) 5 0.69888(801) 0.48448(457) 0.41364(357) 0.41419(357) 0.3991(342) 6 0.70223(784) 0.51165(440) 0.44877(367) 0.45947(379) 0.45381(373) 7 0.68117(655) 0.49413(353) 0.42427(273) 0.41515(265) 0.40147(248) 8 0.67946(671) 0.49544(378) 0.41476(262) 0.38033(228) 0.34925(185) JAP MAX#/ 1 2 3 4 5 HOR 1 0.95614(426) 0.9343(247) 0.90122( 95 ) 0.88008( 50 ) 0.87447( 37 ) 2 0.93461(558) 0.90412(310) 0.86858(119) 0.84332( 61 ) 0.83308( 50 ) 3 0.93628(596) 0.91202(409) 0.87806(253) 0.84904(162) 0.83233(110) 4 0.93919(675) 0.92732(601) 0.89533(425) 0.86544(285) 0.84577(216) 5 0.9596(542) 0.96116(551) 0.9353(426) 0.91114(336) 0.89598(279) 6 0.98(538) 0.99541(603) 0.97302(504) 0.95036(425) 0.93595(373) 7 0.99743(425) 1.0268(553) 1.0082(466) 0.98993(392) 0.9785(356) 8 1.0201(343) 1.0647(507) 1.0508(444) 1.0377(394) 1.03(374)