Procedia IUTAM 14 ( 2015 ) 423 – 432
2210-9838 © 2015 The Authors. Published by Elsevier B.V. This is an open access article under the CC BY-NC-ND license (http://creativecommons.org/licenses/by-nc-nd/4.0/).
Selection and peer-review under responsibility of ABCM (Brazilian Society of Mechanical Sciences and Engineering) doi: 10.1016/j.piutam.2015.03.070
ScienceDirect
IUTAM ABCM Symposium on Laminar Turbulent Transition
Nonlinear mode interactions in the wake of a medium height
roughness element
Benjamin Plogmann
a,∗, Werner W¨urz
a, Ewald Kr¨amer
aaInstitute of Aerodynamics and Gas Dynamics (IAG), Pfaffenwaldring 21, 70569 Stuttgart
Abstract
The present study is devoted to nonlinear (resonant) mode interactions in the wake of a medium height, cylindrical roughness element, which is placed in a laminar, airfoil boundary layer. The roughness element causes a considerable mean flow distortion in the near wake centerline region and two counter-rotating vortex pairs arise in the outer spanwise domain. In the streamwise evolution the mean flow stabilizes and a spanwise uniform flow is recovered in the far wake. Upstream of the roughness controlled, low-amplitude Tollmien-Schlichting (TS) wave modes are excited in the upper branch unstable region. The interference of the excited, 2D fundamental modes with the roughness results in the excitation of oblique modes in a broad spanwise wave number range. Nonlinear interactions in-between the (oblique) fundamental modes in the destabilized near wake lead to the generation of primary, low-frequency modes at the difference frequencies of the fundamental modes, before the fundamental modes can recover linear stability characteristics in the far wake. In contrast, the primary, subharmonic-type modes experience a nonlinear growth, which is a result of frequency and spanwise wave number detuned resonant mode interactions with the 2D fundamental modes. The resonant growth of the primary interaction modes initiates a symmetrization of the spectrum in the low-frequency, subharmonic range. That is, symmetric subharmonic-type (secondary) modes are resonantly amplified in the far wake. Therefore, although the fundamental modes recover linear stability characteristics with the stabilization of the mean flow, resonant mode interactions in the low-frequency, subharmonic range initiate the onset of boundary layer transition in the far wake of the medium height roughness element.
c
2014 The Authors. Published by Elsevier B.V.
Selection and peer-review under responsibility of ABCM (Brazilian Society of Mechanical Sciences and Engineering). Keywords: Laminar boundary layer; controlled disturbance excitation; medium roughness height element; resonant mode interactions;
1. Introduction
Roughness induced laminar to turbulent transition sustains a topic of high interest as a detailed understanding is crucial for the design of efficient airfoils and in recent times, especially, for the development of wind turbine blades. In general, roughness elements can be distinguished depending on their shape into two-dimensional elements, isolated three-dimensional elements1and distributed (sandpaper) roughness2. Additionally, the flow phenomena and, there-with, the transition mechanism downstream of the roughness strongly depend on the particular roughness height. For low roughness heights (i), the mean flow distortion in the roughness wake is small and external disturbances - such as free stream turbulence or sound - couple into the boundary layer mainly via a linear receptivity process at the rough-ness3. In the medium height range the receptivity process at the roughness becomes nonlinear and a substantial mean
∗Corresponding author, Tel.:+49-711-685-69976 E-mail address:[email protected]
© 2015 The Authors. Published by Elsevier B.V. This is an open access article under the CC BY-NC-ND license (http://creativecommons.org/licenses/by-nc-nd/4.0/).
flow distortion downstream of the roughness element alters the stability characteristics of the boundary layer flow. For a single, cylindrical roughness element (as used in the present study), a horseshoe shaped vortex wraps around the front side of the element and a pair of spiral filaments rises vertically in the wake leading to a counter-rotating vortex pair on each side of roughness centerline1,4. However, in the far wake these vortical structures eventually decay so that a spanwise uniform mean flow is recovered. The nonlinear disturbance growth, that is initiated by the bound-ary layer roughness interaction, is most distinctive in the near wake, since the stabilization of the mean flow in the streamwise evolution counteracts the unsteady disturbance growth5. In the far wake, the disturbances excited by the
boundary layer roughness interference decrease without causing transition leading to a critical roughness Reynolds numberReh,critfor isolated three-dimensional roughness elements, below which no significant effect on transition is
expected1,6. In contrast, if the critical roughness Reynolds number is exceeded, that is for high roughness elements
(iii), a highly nonlinear disturbance evolution and pronounced vortical structures in the immediate wake of the element are associated with bypass transition in the near roughness vicinity7.
The present study is devoted to the evolution of controlled Tollmien-Schlichting (TS) wave modes and the subse-quent mode interactions in the wake of a single roughness element in the medium height range. Previous investiga-tions in this field addressed the local receptivity of a TS-wave scattering at a three-dimensional roughness8. For a
low-amplitude TS-wave mode at the roughness subharmonic modes prevail within secondary instability, whereas the fundamental mode is dominant for large TS-wave amplitudes. For roughness elements in the medium height range, the scattering of an initially two-dimensional TS-wave at a cylindrical roughness element leads to the formation of pronounced oblique modes at the fundamental mode frequency9. Experimental investigations have shown that these spanwise structures decay in the streamwise evolution for low-amplitude TS-wave modes, in contrast to a continuous growth of the oblique modes in the roughness wake for large initial TS-wave amplitudes at the roughness position10.
Dominant spanwise modes were observed for wave propagation angles close toθ = 45◦ and the interaction with the roughness element was found to be most pronounced for instability modes near the upper branch of the neutral stability curve11.
The present paper describes the evolution of three simultaneously excited, low-amplitude TS-wave modes in the wake of the cylindrical, medium height roughness element. The focus is set on the nonlinear mode interaction in-between the fundamental modes and the subsequent resonant amplification of low-frequency, subharmonic-type modes, which are a consequence of the nonlinear excitation of the oblique fundamental modes at the roughness. The paper is organized as follows: Sec. 2 is devoted to the experimental setup and the methods of data acquisition, results are presented in Sec. 3 and, finally, Sec. 4 contains the concluding remarks.
2. Experimental Setup and Data Acquisition
The experiments were performed in the Laminar Wind Tunnel of the IAG12, which is of Eiffel type. An effective contraction ratio of 20:1 and several screens in the inlet section lead to a low longitudinal turbulence level ofT ux=
0.02 % for a frequency range of f = 10−5000 Hz and a free stream velocity of u∞ = 30 m/s. The closed test section has a cross section of 0.73×2.73 m2 and a length of 3.15 m. The diffusor section is equipped with noise
absorbing foam substantially reducing the background noise level in the test section13. During the measurements
the free stream velocity and not the Reynolds number was kept constant due to the quadratic influence of the non-dimensional frequency parameterF=2πfν/u2
∞on the free stream velocity (withνbeing the kinematic viscosity).
In order to achieve a close alignment of the experimental with operational conditions of wind turbines the experi-ments are performed on a specially designed airfoil section (BE72)14. For angles of attack corresponding to the upper
edge of the low drag bucket the pressure gradient in the leading edge region of theBE72 airfoil section is similar compared with the NACA 643−418 airfoil, which can be regarded as a typical airfoil for wind turbine applications.
However, the pressure distribution in the trailing edge section of theBE72was modified to reduce the model chord toc= 2.4 m. Therewith, experiments can be conducted at a typical Reynolds number for wind turbine applications (Re=6·106) and at low free stream velocity (u∞=20 m/s). For the present study, the pressure gradient is close to zero in the entire measurement domain resulting in an almost constant boundary layer edge velocity ofuδ=28.3 m/s. Subsequently, the boundary layer shape factor is nearly constant atH12 = 2.59. The boundary layer displacement
thickness and the Reynolds number based on displacement thickness at the roughness position areδ1,re f =0.72 mm
normalized with the displacement thickness at the roughness positionδ1,re f and the streamwise sand spanwise z
coordinate are normalized with the roughness diameterdr(see next paragraph).
A cylindrical roughness element with a diameterdr = 20 mm is integrated surface flush into the airfoil model
at a streamwise location of x/c = 0.15. The roughness height can be adjusted in a range 0 < h/δ1,re f < 2 with a
linear actuator and the height is monitored based on laser-triangulation with a linearity of±3μm corresponding to 0.4 percent of the boundary layer displacement thickness at the roughness position. Upstream of the roughness controlled TS-wave modes are excited atx/c =0.1 by a small slit (width 0.2 mm), which is integrated into the model surface. Beneath the slit, 128 tubes are connected to individually controllable loudspeakers, which are driven by a custom signal generator15. In order to ensure phase synchronism for the disturbance excitation the same clock is used for all
128 channels of the signal generator. In the reference case (zero roughness height), the streamwise evolution of the excited TS-waves complies well with linear theory within the measurement domain16. At the roughness position, the
standard deviation of the TS-wave amplitude and phase in spanwise direction is 8% of the mean amplitude and 6.8◦ for the TS-wave phase, i.d. 1.9 % of 360◦.
Phase-locked (with respect to the disturbance excitation) hot-wire measurements were performed with a single wire probe of type 55P15. The probe has a 5μm gold-plated tungsten wire and was operated with a DISA 55M10 bridge with a constant overheat ratio of 1.8. Prior to AD conversion the hot-wire signal was split into AC and DC part. For the DC part an active low-pass filter with a cut-offfrequency offcl =1 Hz was used. The AC part was high-pass
filtered with a passive RC-filter (fch=50 Hz). The AD-converter is equipped with an internal fcl =40 kHz low-pass
filter, which minimizes the effect of very high-frequency noise. No additional anti-aliasing filter was used due to a high sampling rate (fs= 15625 Hz) and a strong decay of the spectral density in the high-frequency range. AC and
DC part of the signal are acquired at the same time with a 18-Bit AD converter (NI USB-6289).
For each measurement point a total of 32768 samples was recorded. Prior to a Fast Fourier transformation (FFT) the fluctuation velocities are split into 8 blocks of 4096 samples and ensemble averaged in the temporal domain to increase the signal-to-noise ratio. For the FFT a rectangular window without overlap was applied, since the excited modes exactly correspond to single Fourier series coefficients. Spanwise boundary layer measurements were interpolated to an equidistant grid with a constant spanwise domain of −7.5 < z/dr < 7.5 to obtain spanwise wave number
spectra via complex FFT. Since the disturbance modes excited by the roughness spread in a wedge shaped region in the downstream evolution (compare e.g. Fig. 3), the amplitudes of the oblique modes have been corrected for the influence of the (in streamwise direction) increasing spanwise extend, which is affected by the boundary layer roughness interaction. The spanwise wave numberβ = 2π/λzis normalized with the roughness diameterdr (with
λzbeing the spanwise wavelength). That is,βdr =2πcorresponds to a wavelength equal to the roughness diameter.
Further details on the experimental setup and the methods of data processing are found inPlogmann et al.16.
3. Results and Discussion
3.1. Mean flow evolution
0 3 6 9 12 -1.5 -1 -0.5 0 0.5 1 1.5 δ δ 0 3 6 9 12 -0.1 -0.05 0 0.05
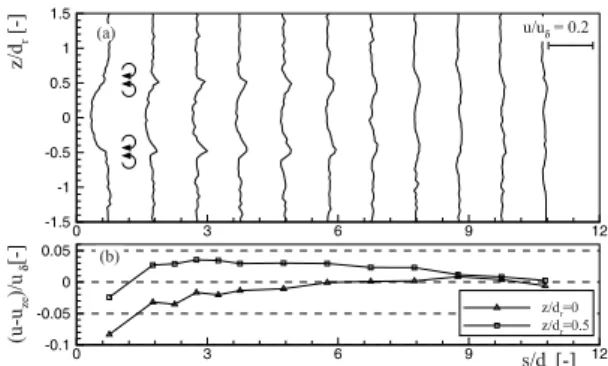
Fig. 1. Mean flow evolution in the streamwise-spanwise plane at
y/δ1,re f =0.9 (a) and streamwise development of streak amplitude (b)
for a roughness height ofh/δ1,re f =0.3. Fig. 1a shows the mean flow evolution downstream
of the medium height roughness element ath/δ1,re f =
0.3 in a streamwise-spanwise plane aty/δ1,re f = 0.9.
The associated roughness Reynolds number isReh =
70 (with Reh = uhh/ν and uh being the velocity at
the height of the roughness in reference case). In the near wake, a considerable velocity deficit is observed, which is most distinct in the centerline region. Fur-ther downstream the mean flow distortion in the cen-terline region decreases and distinct high speed streaks arise at spanwise positions ofz/dr=±0.5
correspond-ing to the location of the roughness edges (see also Fig. 1b). Here, uze is the mean flow velocity at the
undisturbed spanwise edges of the measurement do-main. At the outer spanwise edge of each high speed
δ δ 0 0.5 1 0 1 2 3 4 5 0 0.5 1 0 1 2 3 4 5 0 200 400 600 800 1000 1200 1400 10-14 10-12 10-10 10-8 10-6 10-4 10-2 100 102 104 0 0.5 1 δ Δ 0 200 400 600 800 1000 1200 1400 10-14 10-12 10-10 10-8 10-6 10-4 10-2 100 102 104 Δ Δ 0 200 400 600 800 1000 1200 1400 10-14 10-12 10-10 10-8 10-6 10-4 10-2 100 102 104 δ δ 0 3 6 9 12 10-4 10-3 δ δ 0 3 6 9 12 0.5 1 1.5 2 2.5 3 0 3 6 9 12 10-4 10-3
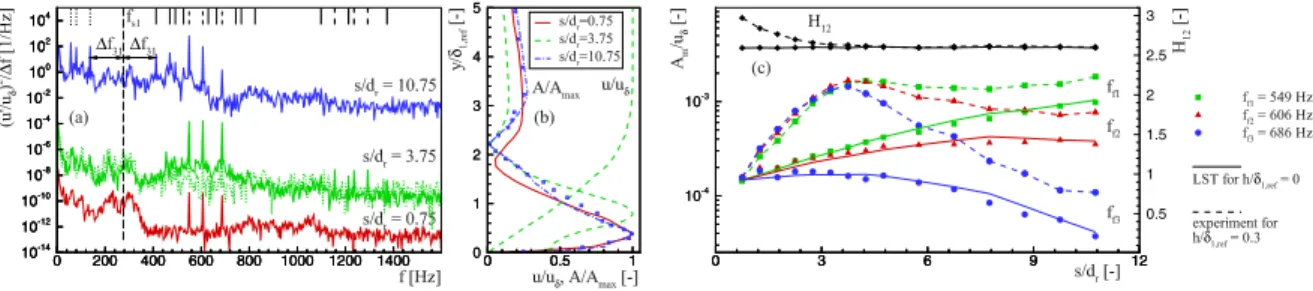
Fig. 2. Boundary layer spectra aty/δ1,re f=0.9 with reference spectrum (h/δ1,re f =0) indicated by dotted line ats/dr=3.75, shifted by one decade
perΔs/dr=1 (a), amplitude eigenfunctions of mode ff1=549 Hz with reference eigenfunction forh/δ1,re f =0 ats/dr=10.75 indicated with
symbols and mean velocity profile ats/dr =3.75 (b) and streamwise evolution of maximum wall normal amplitudeAmfor fundamental modes
ff1−3and of shape factor (c) on roughness centerline (frequencies of fundamental (ff), harmonic (fh), sum (fΣ), difference (fΔ) and secondary interaction (ff,Δ) modes indicated in (a) by thin dashed, thick solid, thick dashed, dotted and thin solid lines, respectively).
streak a weakly pronounced low speed streak is present. The streaks are most distinct for s/dr = 2−5 and persist
at a constant spanwise position in the streamwise evolution in compliance with previous findings11. The formation
of these high and low speed streaks suggests the presence of two counter-rotating vortex pairs as indicated in Fig. 1a. That is, in the inner region high momentum fluid is shifted of the wall (lift-up effect) by the (trailing) vortex pair, whereas both vortex pairs entrain high-momentum fluid towards the wall atz/dr=±0.5. The outer low speed streaks
are linked to the outer (horse shoe) vortex, which is known to wrap around the front side of medium height cylindrical roughness elements17. A comparison with e.g.Tani1shows that these vortical structures comply well with previous
findings in the wake of cylindrical elements. In the far wake (s/dr >5), the streaks and, therewith, the vortical
struc-tures decay and for s/dr > 10 a spanwise nearly uniform flow is recovered. If not stated otherwise, the following
results relate all to a roughness height ofh/δ1,re f =0.3.
3.2. Fundamental mode evolution
Upstream of the roughness a trio of two-dimensional TS-wave modes has been excited in the upper branch unstable region, that is at frequencies ff1=549 Hz, ff2=606 Hz and ff3=686 Hz (see Fig. 2a). The streamwise wavelength
of the three fundamental modes is in the same range as the roughness diameter, that isαrdr =2.2πfor ff3=686 Hz
andαrdr = 1.9πfor ff1 = 549 Hz. A stability diagram can be found inPlogmann et al.16. The maximum
(wall-normal) RMS amplitude of each fundamental mode isAm/u∞=0.02% resulting in a total RMS amplitude ofAmt/u∞=
0.035% at the roughness position. Fig. 2c shows the fundamental mode growth forh/δ1,re f = 0.3 in comparison to
the zero-roughness height case. Here, the growth is based on the maximum wall-normal amplitude on the roughness centerline (compare Fig. 2b). In the reference case (h/δ1,re f =0) the growth of the 2D fundamental modes matches
with linear theory up to the end of the measurement domain. In contrast, the boundary layer roughness interaction initiates a nonlinear growth of the fundamental modes in the near wake. This growth is associated with the formation of a second near wall peak close toy/δ1,re f = 0.9 in the amplitude eigenfunction (Fig. 2b). This amplitude peak is
located near the critical layer as can be seen from the comparison to the mean flow velocity profile ats/dr = 3.75
and can be linked to the formation of oblique (fundamental) modes in the near wake. From the spanwise amplitude distribution near the critical layer (y/δ1,re f =0.9), which is exemplary shown for the mode ff1 =549 Hz in Fig. 3a,
it becomes obvious that the growth is most distinct in the destabilized, low speed centerline region. In contrast, amplitude minima are present atz/dr = ±0.5, that is at the position of the high speed mean flow streaks showing
their stabilizing effect on the disturbance evolution in the near wake (compare Fig. 1a). Further outwards (in spanwise direction) the evolution of the fundamental modes is not considerably affected in the near wake (s/dr < 4). The
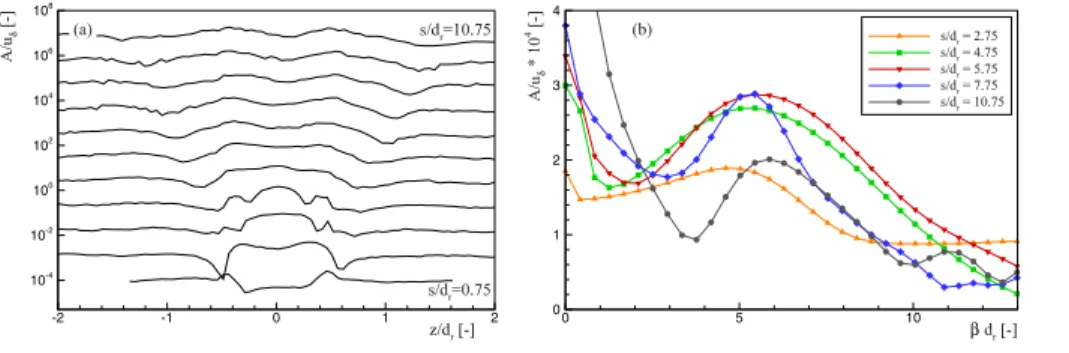
spanwise modulated fundamental modes in the near wake are associated with a broad spectrum of oblique modes in agreement with previous findings11(Fig. 3b). The peak in the spanwise wave number spectrum is located near
βdr =5−6 corresponding to a spanwise wavelength, which is close to the roughness diameter. Note, the spanwise
wave number spectra are averaged with respect to±βif not stated otherwise, since the disturbance evolution in the roughness wake is symmetric with regard to the roughness centerline.
The nonlinear growth of the fundamental modes in the near wake levels offwith the stabilization of the mean flow as can be seen from the comparison to the evolution of the shape factor on the roughness centerline (Fig. 2c, top).
δ -2 -1 0 1 2 10-4 10-2 100 102 104 106 108 β δ 0 5 10 0 1 2 3 4
Fig. 3. Amplitude evolu-tion in a streamwise-spanwise plane, shifted by 1 decade per
Δs/dr = 1 (a) and
span-wise wave number spectra (b) for fundamental mode ff1 =
549 Hz aty/δ1,re f=0.9.
Hence, a local amplitude maximum is present at s/dr ≈ 4, which appears rather independent of the fundamental
mode frequency for the excited modes ff1−3. Further downstream the fundamental modes are slightly damped, before
they grow/decay with a very similar characteristic as in the undisturbed reference case ath/δ1,re f =0. However, the
fundamental mode amplitude is increased byΔn=0.6−1 compared with the reference case (withΔn=ln(A(h/δ1,re f =
0.3)/A(h/δ1,re f =0)) ats/dr =10.75). The amplitude evolution in the streamwise-spanwise plane in Fig. 3a further
reveals that the minima atz/dr ≈ ±0.5 start to spread outwards in a wedge-shaped region when the amplitude of the
high speed mean flow streaks decreases in the far wake (compare Fig. 1b). In-between these two amplitude minima a wave-type structure is observed. The evolution of the associated spanwise wave number spectra reveals that the strongest growth is present for oblique modes close toβdr= 5−6. That is, the most dominant spanwise modes are
in the range of the streamwise fundamental mode wavelength leading to wave propagation angles nearΘ =45◦in compliance with previous observations11. However, in the streamwise evolution the oblique modes are damped with
the relaxation of the mean flow towards a spanwise uniform flow. Hence, no relevant (compared with the 2D mode) oblique modes from the TS-wave roughness interaction persist into the far wake. In compliance, the second near wall peak in the TS-wave eigenfunction on the roughness centerline decreases and the amplitude function approaches the linear eigenfunction of the undisturbed reference case (Fig. 2b).
3.3. Nonlinear mode interactions
The nonlinear growth of the fundamental modes in the destabilized near wake leads to mode interactions as can be seen in the boundary layer spectrum ats/dr=3.75 ands/dr=10.75 (Fig. 2a). The mode interactions become evident
in higher harmonic modes (fh) of the excited fundamental modes (ff) at frequenciesfh=n∗ff (withn=2,3, ..). The
higher harmonic mode frequencies are indicated by thick solid lines on top of Fig. 2a. Fig. 4a shows the streamwise evolution of the second (n=2) harmonic mode amplitude in relation to the fundamental mode amplitude. Here, the RMS amplitude of all modes belonging to a certain group is depicted. That is, the fundamental mode amplitude is e.g. ff = f2 f1+f 2 f2+ f 2
f3. The harmonic mode amplitude develops with the same characteristic as the fundamental
mode amplitude, that is the harmonic modes grow/decay with the fundamental ones. However, compared with the fundamental mode the harmonic mode amplitude remains substantially (2 orders of magnitude) lower within the entire measurement domain showing that the higher harmonic modes play an underpart in the first nonlinear stages of transition downstream of the medium height roughness element.
In the near wake, additional interaction modes arise at sum (fΣ) and difference (fΔ) frequencies of the three funda-mental modes. The sum and difference modes are indicated by dashed and dotted lines in Fig. 2a, respectively. The sum modes exhibit a similar growth behavior as the fundamental and its higher harmonic modes (Fig. 4a). Previous investigations have shown that the growth of the sum modes can be explained by a quadratic wave interaction of the respective fundamental modes16. This quadratic interaction seems to be slightly more effective since the amplitude of
the sum modes is increased compared with the second harmonic mode amplitude. However, the amplitude of the sum modes is still considerably lower with regard to the fundamental mode amplitude. Moreover, the decay in the far wake lead to similar amplitude levels for the sum and the harmonic modes, which are only marginally increased compared with the reference case ath/δ1,re f =0. Hence, the sum modes are (as the harmonic modes) of minor importance in the
transition process downstream of the medium height roughness (see also Fig. 2a). In contrast, for the low-frequency difference (fΔ) modes a continuous growth is present in the near wake, which levels offonly significantly further
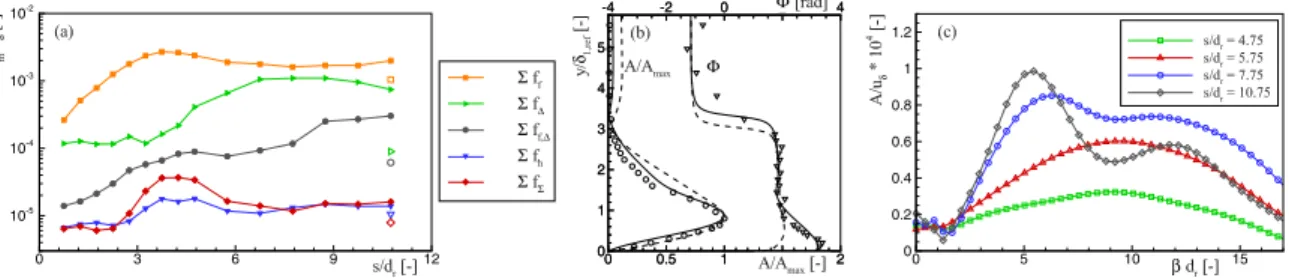
δ 0 3 6 9 12 10-5 10-4 10-3 10-2 Σ ΣΔ Σ Δ Σ ΣΣ 0 0.5 1 1.5 2 -4 -2 0 2 4 0 1 2 3 4 5 δ 0 0.5 1 1.5 2 -4 -2 0 2 4 0 1 2 3 4 5 Φ Φ β δ 0 5 10 15 0 0.2 0.4 0.6 0.8 1 1.2
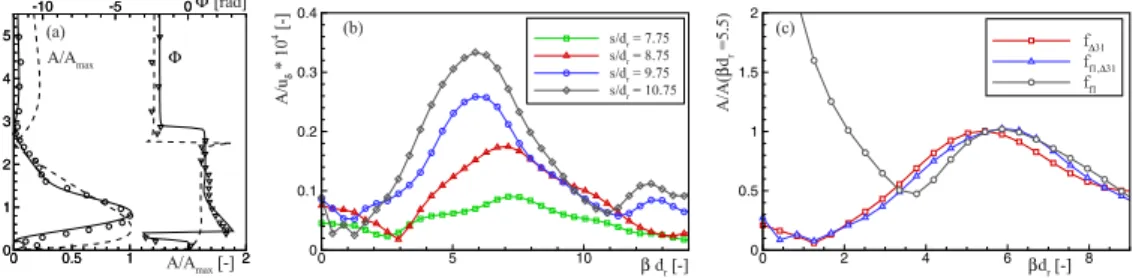
Fig. 4. Streamwise RMS amplitude evolution of modesff, fΔ,ff,Δ,fhandfΣforh/δ1,re f =0.3 with reference case (h/δ1,re f =0) indicated by
open symbols ats/dr=10.75 (a), amplitude (circle) and phase (gradient) eigenfunction ats/dr=8.75 with linear eigenfunctions forβ=0 (dashed
line) andβ=αr(solid line) (b) and spanwise wave number spectra aty/δ1,re f=0.9 (c), (a,b) on roughness centerline and (b,c) for difference mode
fΔ31=137 Hz.
downstream compared with the evolution of the sum and the harmonic modes. Accordingly, the amplitude of the difference modes reaches the same order of magnitude as the fundamental modes’ amplitude in the far wake (compare also Fig. 2a). Note, the constant amplitude level of the difference modes fors/dr<3 in Fig. 4a is due to the increased
noise level in the low-frequency range, which is caused by wind tunnel background noise and vibrations of the hot-wire traverse (see Fig. 2a). Therefore, low-frequency modes can only be tracked at higher amplitudes compared with the high-frequency modes.
Below, further light is shed on the nature of the low-frequency difference modes. Fig. 4b shows the wall-normal amplitude and phase function exemplarily for the difference mode fΔ31 = ff3− ff1 = 137 Hz on the roughness
centerline in the far wake. In the amplitude function a pronounced peak is observed near the critical layer (y/δ1,re f =
0.9−1), similar as observed in the fundamental mode eigenfunction in the near wake (compare Fig. 2b). A good match is obvious for the wall-normal amplitude and phase function of the difference mode with regard to the linear eigenfunction of an oblique mode withβ = αr revealing a TS-wave type character of the difference modes. The
oblique nature of the difference modes is also obvious in the spanwise amplitude and phase distributions near the critical layer (see Plogmann et al.16). The difference modes start to grow in the centerline region and spread outwards
in a wedge shaped region, which is limited in spanwise direction by the outer amplitude minima in the fundamental mode evolution (compare Fig. 3a). Fig. 4 shows the associated spanwise wave number spectra for the difference mode fΔ31=137 Hz. In the near wake difference modes arise in a broad spanwise wave number range with the peak
located nearβdr =9. Hence, in comparison to the fundamental mode spectra in the near wake (Fig. 3b) the peak is
shifted towards higher spanwise wave number modes for the difference modes at first. However, in the streamwise evolution the growth of the high spanwise wave number modes levels offand in the far wake a damping is observed. In contrast, lower spanwise wave number modes are stronger amplified and, accordingly, the maximum is shifted to lower spanwise wave numbers in the downstream evolution. Far downstream, the maximum is observed close toβdr=5−6
and a second less distinct peak becomes obvious close toβdr=12. Hence, in the far wake dominant oblique modes
are present in a similar spanwise wave number range for the fundamental and the associated low-frequency, difference modes (compare also Fig. 5c).
In the streamwise evolution further distinct spectral peaks at frequenciesff,Δin the boundary layer spectrum show
the development of secondary interaction modes (see Fig. 2a). Here, secondary interaction modes are referred to as modes, which imply the interference of a low-frequency difference (primary interaction) mode with a fundamental mode, that is ff,Δ= ff ± fΔ. Thin solid lines on the top of Fig. 2a indicate all secondary interaction modes that can
theoretically arise. The comparison with the boundary layer spectrum reveals that secondary interaction modes are most pronounced in the low-frequency range (f =400−500 Hz), that is for modes, which are based on an interaction with the fundamental mode ff1. In contrast, interactions of the primary with the higher frequency fundamental modes
cannot be observed likely due to the considerable decay of the fundamental modes ff2and ff3with the relaxation of
the mean flow in the far wake (compare Fig. 2c).
Fig. 4a shows the RMS amplitude of all secondary interaction modes in comparison with the fundamental and the primary interaction mode amplitudes. For the secondary modes, a continuous growth is observed in the downstream evolution. However, in the near wake discrete peaks at the secondary mode frequencies are not present in the boundary layer spectrum (Fig. 2a). Instead the growth in the ff,Δfrequency bands in the near wake can be linked to the naturally
0 0.5 1 1.5 2 -10 -5 0 0 1 2 3 4 5 δ 0 0.5 1 1.5 2 -10 -5 0 0 1 2 3 4 5 Φ Φ β δ 0 5 10 0 0.1 0.2 0.3 0.4 β β 0 2 4 6 8 0 0.5 1 1.5 2 Δ Δ
Fig. 5. Amplitude (circle) and phase (gradient) eigenfunction ats/dr=6.75 on roughness centerline with linear eigenfunctions forβ=0 (dashed
line) andβ=αr(solid line) (a), streamwise evolution of spanwise wave number spectra (b) and spanwise wave number spectra ats/dr=10.75 (c),
(a,b) for secondary modeff1,Δ31=412 Hz, (b,c) aty/δ1,re f =0.9.
arising disturbances in the near wake (compare Fig. 2a andPlogmann et al.16). In contrast, further downstream (s/d
r>
6) the growth in theff,Δfrequency bands can mainly be attributed to the discrete growth of the secondary interaction
modes. In the far wake, the amplitude of the secondary interaction modes is still an order of magnitude lower compared with the fundamental mode amplitude. However, the secondary interaction modes lead to a progressively filling up disturbance spectrum in the far wake, especially in the low-frequency, unstable TS-wave range (Fig. 2a).
The secondary interaction modes start to grow in the centerline region, in which the highest amplitudes are present for the fundamental and the difference modes, respectively. In the streamwise evolution the secondary interaction modes spread outwards in a wedge-shaped region, which is limited by the amplitude minima in the fundamental mode evolution16. Fig. 5a shows the wall-normal amplitude and phase function exemplarily for the secondary interaction
mode ff1,Δ31 = ff1− fΔ31 =412 Hz on the roughness centerline. The wall-normal amplitude maximum is observed
neary/δ1,re f = 0.9. That is, the secondary interactions are most distinct near the critical layer in agreement with
the observations for the primary modes (compare Fig. 4b). Moreover, good agreement with regard to the linear eigenfunction of a mode withβ=αrreveals a TS-wave type character of the secondary interaction modes. The ff,Δ
modes become most distinct in a spanwise wave number range ofβdr =4−7 in the downstream evolution, whereas
a significant growth at higher spanwise wave numbers (βdr >10) - as seen for the primary modes in the near wake
- cannot be observed (see Fig. 5b). Hence, the highest amplitudes are observed in the same spanwise wave number range as for the fundamental and the primary interaction modes in the far wake (Fig. 5c).
3.4. Resonant mode interactions in the low-frequency, subharmonic range
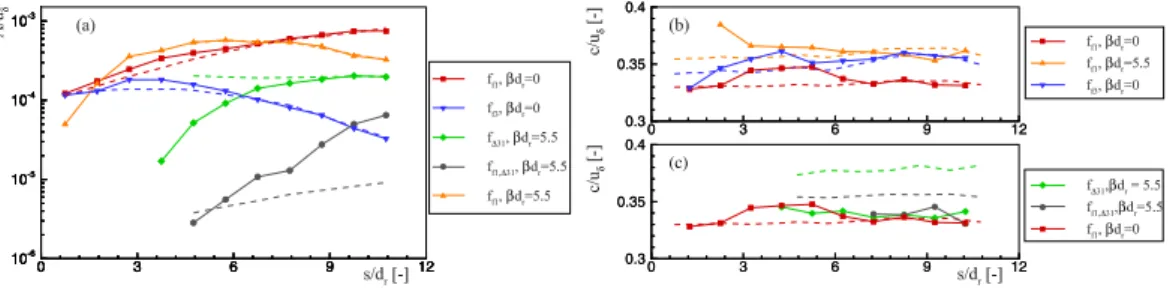
The discussion above has shown that the interference of the initially two-dimensional TS-wave modes with the cylindrical roughness element results in the formation of oblique modes at the fundamental mode frequencies. Fig. 6 shows the evolution of the amplitude (a) and the phase speeds (b) for the fundamental and the interaction modes exemplary for the modes ff1, ff3, fΔ31 and ff1,Δ31 at a spanwise wave number ofβdr = 5.5, which is close to the
maximum amplitude of the oblique fundamental and interaction modes, respectively (compare Fig. 5c). Here, the amplitude and phase evolutions are based on spanwise wave number spectra near the critical layer (y/δ1,re f = 0.9)
corresponding to the peak in the eigenfunction of the oblique modes withβdr = 5.5 (compare Fig. 2b, Fig. 4b and
Fig. 5a). The decreased amplitude of the 2D mode with regard to its maximum, which is located closer to the wall (see Fig. 2b), is corrected for by considering local linear eigenfunctions.
For the 2D fundamental modes a weak nonlinear growth is observed in the near wake, but for s/dr > 6 linear
growth rates are recovered. The phase speed of the 2D fundamental modes is slightly increased in the near wake, but matches with linear theory in the far wake. The oblique fundamental mode ff1 withβdr = 5.5 experiences a
strong nonlinear growth in the near wake, but similar as observed for the 2D fundamental modes linear growth rates and phase speeds are recovered in the far wake. That is, due to the low initial amplitudes at the roughness, the fundamental modes can recover linear stability characteristics with the relaxation of the boundary layer towards the undisturbed base flow as already hinted at in Fig. 2c. Moreover, the phase speeds of the fundamental mode ff3and
the oblique modeff1are very close in the far wake, but the linear growth gives evidence that no resonant interactions
occur. However, the nonlinear interactions in-between the oblique fundamental modes in the near wake lead to the generation of the low-frequency difference modes (compare Sec. 3.3). After their generation, those primary modes
0 3 6 9 12 10-6 10-5 10-4 10-3 β β Δ β Δ β β δ 0 3 6 9 12 10-6 10-5 10-4 10-3 0 3 6 9 12 10-6 10-5 10-4 10-3 0 3 6 9 12 10-6 10-5 10-4 10-3 0 3 6 9 12 0.3 0.35 0.4 δ 0 3 6 9 12 0.3 0.35 0.4 Δβ Δ β β δ 0 3 6 9 12 0.3 0.35 0.4 0 3 6 9 12 0.3 0.35 0.4 β β β (c)
Fig. 6. Amplitude evolution (a) and phase speeds (b,c) based on spanwise wave number spectra aty/δ1,re f =0.9 for fundamental modes and
subharmonic-type primary and secondary interaction modes (dashed lines indicate the evolutions based on linear theory).
can, in principle, also be understood as subharmonic-type modes with frequency and spanwise wave number detuning (as argued below). Hence, the nonlinear interactions in the near roughness wake lead to favorable initial conditions for a subharmonic-type breakdown scenario in the later stages of transition downstream of the medium roughness height element.
In this context, Fig. 7a shows the dispersion curves exemplary for the fundamental mode ff1and the corresponding
subharmonic mode fs1 = ff1/2 as the fundamental mode ff1 has the highest amplitude and growth rates in the
streamwise evolution downstream of the roughness. In order to satisfy the condition of phase synchronism for a tuned, resonant Craik triad18 the spanwise wave number of the subharmonic mode f
s1 would beβs1dr = 4.1. However, it
is known that resonant interactions can still be present for large frequency (up to 90%) and spanwise wave number detuned subharmonic modes (e.g.Borodulin et al.19). In the present case, the frequency detuning would beΔf31/fs1=
−50% for the oblique fΔ31mode with regard to the subharmonic mode fs1(withΔf31 = fΔ31− fs1). In the spanwise
wave number spectrum of mode fΔ31maximum amplitudes are observed forβdr =4−7 being in the same range as
the tuned spanwise wave numberβs1of the subharmonic mode fs1(compare Fig. 7a and b). For the maximum near
βm1dr=5.8 the spanwise wave number detuning would beΔβ=(βm1−βs1)/βs1=40%.
For the low-frequency, subharmonic-type mode fΔ31a nonlinear growth is observed fors/dr>4. The phase speed
of the fΔ31mode deviates considerably from the linear phase speed, but matches well with the phase speed of the 2D
fundamental mode ff1up to the end of the measurement domain. That is, the low-frequency difference mode
syn-chronizes with the 2D fundamental mode indicating that the nonlinear growth of the low-frequency difference modes is caused by a resonant mode interaction in contrast to the non-resonant mode interactions in-between the (oblique) fundamental modes in the near wake. The amplitude of the pure 2D fundamental mode is, however, still below the previously observed threshold ofA/uδ≈0.002 for subharmonic resonance to set in (e.g.Kachanov and Levchenko20).
This suggests that the onset of the resonant mode interactions is caused by (local) amplitude peaks, which result from the superposition of the 2D and quasi 2D (low spanwise wave number) fundamental modes (compare Fig. 3a and b). In the far wake (s/dr>7) the growth of the fΔ31mode levels offand shows a similar growth behavior as predicted by
linear theory (s/dr>9). In compliance, it is seen, that the 2D and quasi 2D fundamental modes recover linear
stabil-ity characteristics, so that their superimposed amplitude growths considerably less (compared with the near wake) or even decreases slightly as observed in the centerline region (Fig. 3a and alsoPlogmann et al.21). That is, the resonant
mode interactions become weaker in the far wake with the less distinct growth/decay of the driving 2D and quasi 2D fundamental modes.
Previous studies20have shown that if a single frequency detuned subharmonic mode is excited (e.g. fexc= fs+Δf)
an additional, symmetric (with respect to the exact subharmonic) mode appears at a frequency fsym= fs−Δfand tends
to reach a similar amplitude level as the excited mode. The initially excited subharmonic mode can be understood as an oscillation at the exact subharmonic frequency, but with its phase depending on time. When resonant interaction exists, the drifting phase leads to a temporal modulation of the excited mode resulting in the symmetrization of the frequency spectrum in the subharmonic range. In the present case, the initial subharmonic-type modes are the primary interaction modes, e.g. fΔ31= fs1+Δf31(see discussion above). The corresponding symmetric modes would, then, be
the secondary interaction modes, e.g. ff,Δ31= fs1−Δf31, which become obvious in the far wake (compare Sec. 3.3).
The similar spectral content of the spanwise wave number spectra of the fΔ31and theff1,Δ31mode (Fig. 5c) gives
a first indication that the secondary modes can be viewed as symmetric subharmonic-type modes. In Fig. 6a it is seen that the symmetric ff,Δ31mode starts to arise from the background noise level fors/dr >4. The comparison to
α 0 2 4 6 8 10 0 2 4 6 Δ31 Δ31 β 0 2 4 6 8 10 0 0.5 1 Δβ β β α α β δ 0 3 6 9 12 10-5 10-4
10-3 Fig. 7. Dispersion curves (a), spanwise
wave number spectrum for mode fΔ31 =
137 Hz and streamwise amplitude evolu-tion for fundamental and subharmonic-type modes based on maximum wall-normal am-plitude on roughness centerline (c), (a,b) at
s/dr=7.75.
linear theory reveals that the growth is considerably more pronounced in the entire downstream evolution. Moreover, the ff1,Δ31 mode phase speed deviates from linear theory, but instead is very similar to the phase speed of the 2D
fundamental mode ff1and the initial subharmonic-type mode fΔ31 (Fig. 6c). This gives further evidence, that the
nonlinear growth of the secondary interaction modeff1,Δ31in the far wake is caused by a symmetric (with regard to the
fs1mode) resonant mode interaction, which, in turn, can be linked to the phase-locked interaction of the fundamental
modeff1and the primary interaction modefΔ31. Based on Fig. 6a it is further obvious that the growth of the symmetric
mode ff1,Δ31is considerably more distinct in the far wake, whereas the growth of the initial subharmonic mode fΔ31
levels offwith the 2D fundamental mode ff1. This might be related to the lower amplitude of the symmetric mode
ff1,Δ31, which has not yet reached the level of the initial subharmonic-type mode fΔ31.
In Fig. 2a it is obvious that all symmetric modes with regard to the exact subharmonic frequencyfs1are present, that
is ff1,Δ31=412 Hz, ff1,Δ32 =469 Hz and ff1,Δ21 =492 Hz. In contrast, a significant growth at the higher secondary
interaction mode frequencies, which would be symmetric modes with regard to the subharmonic frequencies fs2and
fs3, cannot be observed (with fs2 = ff2/2 and fs3 = ff3/2). In compliance, it was seen that the fΔ31 mode does
not synchronize with the 2D fundamental mode ff2or ff3, but instead with the lower frequency fundamental mode
ff1, which exhibits the highest amplitude and growth (of the 2D fundamental modes) in the far wake (e.g. Fig. 6a).
These observations agree with previous findings, which revealed that in the presence of multiple 2D fundamental waves resonant interactions are driven by the lower frequency fundamental modes in the streamwise evolution as they normally exhibit a higher linear growth and, therewith, higher amplitudes22.
Finally, Fig. 7b shows the streamwise evolution of the subharmonic mode in comparison to the fundamental mode amplitude on the roughness centerline. Here, e.g. the subharmonic fs31 mode amplitude is the sum of the initial
fΔ31and the symmetric ff1,Δ31mode amplitude. For s/dr > 3 (that is when the amplitude of all subharmonic-type
modes is well above the electronic noise level), the three subharmonic modes develop very similar and only minor differences are obvious in the streamwise amplitude evolution. This implies that the frequency detuning, which is
Δf32/fs1 =±71% andΔf21/fs1 =±79% for the fs32and fs21mode, respectively, has no significant influence on the
amplification of the subharmonic-type modes in the investigated range of frequencies. Moreover, a similar evolution of the subharmonic modes further supports the argument that the subharmonic growth can mainly be associated with the same 2D fundamental mode ff1 at least in the far wake, whereas the fundamental modes ff2 and ff3 play an
underpart for the resonant amplification of the subharmonic-type modes, since their amplitudes decay considerably in the far wake.
4. Conclusion
The flow downstream of a medium height roughness element placed in a laminar airfoil boundary layer has been experimentally investigated with hot-wire anemometry. In the near wake centerline region a considerable mean flow distortion is present and two counter-rotating vortex pairs are observed at the edges of the roughness, but in the far wake the mean flow is stabilized and a spanwise uniform flow is recovered. Upstream of the roughness two-dimensional (2D), fundamental TS-wave modes of low amplitude have been excited in the upper branch unstable region according to linear theory. The interference of the 2D fundamental modes with the roughness results in a nonlinear initiation of a broad spectrum of oblique modes at the fundamental frequencies. The subsequent nonlinear interactions in-between the (oblique) fundamental modes in the destabilized near wake lead to the formation of low-frequency, subharmonic-type modes at the difference frequencies of the fundamental modes. In the far wake the 2D and oblique fundamental modes can recover linear stability characteristics with the stabilization of the mean flow. In contrast, the low-frequency difference (primary interaction) modes, which have a modal, TS-wave type character, experience a nonlinear growth. A synchronization of these low-frequency, subharmonic-type modes with
the 2D fundamental modes gives evidence that the nonlinear growth is caused by frequency and spanwise wave number detuned resonant mode interactions. In the streamwise evolution these resonant mode interactions result in a symmetrization of the frequency spectrum in the low-frequency range with regard to the exact subharmonic frequency. That is, symmetric (secondary), subharmonic-type modes arise and progressively fill-up the disturbance spectrum in the low-frequency range, although the fundamental modes recover linear stability characteristics in the far wake. Hence, the nonlinear excitation of the oblique fundamental modes at the roughness and their subsequent nonlinear interactions lead to the generation of subharmonic-type modes, which are then resonantly amplified by an interaction with the 2D fundamental modes and, thereby, dominate the first nonlinear stages of transition in the far wake of the medium height roughness element.
Acknowledgements
This work is supported by DFG (Deutsche Forschungsgemeinschaft) under Grant WU265/4-1.
References
1. Tani, I.. Effect of Two-Dimensional and Isolated Roughness on Laminar Flow. Boundary Layer and Flow Control-Pergamon Press1961;
2:637–656.
2. von Doenhoff, A.E., Braslow, A.L.. The Effect of Distributed Surface Roughness on Laminar Flow. Boundary Layer and Flow Control-Pergamon Press1961;2:657–681.
3. Saric, W.S., Hoos, J.A., Radezsky, R.H.. Boundary Layer Receptivity of Sound with Roughness. In: Reda, D.C., Reed, H.L., Kobayashi, R., editors.Boundary layer stability and transition to turbulence; Proceedings of the Symposium, ASME and JSME Joint Fluids Engineering Conference, 1st, Portland, OR, June 23-27, 1991. American Society of Mechanical Engineers; 1991, p. 17–22.
4. Tobak, M., Peake, D.. Topology of Three-Dimensional Separated Flows.Annual Review of Fluid Mechanics1982;14:61–85. 5. Ergin, F., White, E.. Unsteady and Transitional Flows Behind Roughness Elements.AIAA Journal2006;44(11):2504–2514. 6. Tani, I.. Boundary-layer transition.Annual Review of Fluid Mechanics1969;1:169–196.
7. Klebanoff, P., Cleveland, W., Tidstrom, K.. On the Evolution of a Turbulent Boundary-Layer Induced by a Three-Dimensional Roughness Element.Journal of Fluid Mechanics1992;237:101–187.
8. Crouch, J.. Excitation of Secondary Instabilities in Boundary Layers.Journal of Fluid Mechanics1997;336:245–266.
9. Piot, E., Casalis, G., Rist, U.. Stability of the Laminar Boundary Layer Flow Encountering a Row of Roughness Elements: Biglobal Stability Approach and DNS.European Journal of Mechanics B/Fluids2008;27:684–706.
10. de Paula, I., W¨urz, W., Medeiros, M.. Experimental Study of a Tollmien-Schlichting Wave Interacting with a Shallow 3D Roughness Element.Journal of Turbulence2008;9:1–23.
11. Wang, Y.. Instability and Transition of Boundary Layer Flows Disturbed by Steps and Bumps. PhD thesis, Queen Mary College, University of London, U.K.; 2004.
12. Wortmann, F.X., Althaus, D.. Der Laminarwindkanal des Instituts f¨ur Aero- und Gasdynamik an der Technischen Hochschule Stuttgart.
Zeitschrift f¨ur Flugwissenschaften1964;12(4):129–134.
13. Plogmann, B., W¨urz, W.. Aeroacoustic Measurements on a NACA 0012 applying the Coherent Particle Velocity Method.Experiments in Fluids2013;54(7).
14. Plogmann, B., W¨urz, W., Kr¨amer, E.. Interaction of a Laminar Boundary Layer with a Cylindrical Roughness Element near an Airfoil Leading Edge. 42nd AIAA Fluid Dynamic Conference, New Orleans; 2012. AIAA 2012-3077.
15. de Paula, I., W¨urz, W., Kr¨amer, E., Borodulin, V., Kachanov, Y.. Weakly non-linear stages of boundary-layer transition initiated by modulated Tollmien-Schlichting waves.Journal of Fluid Mechanics2013;732:571–615.
16. Plogmann, B., W¨urz, W., Kr¨amer, E.. On the disturbance evolution downstream of a cylindrical roughness element.accepted for publication in Journal of Fluid Mechanics2014;.
17. D´elery, J.M.. R. Legendre and H. Werle: Toward the Elucidation of Three-Dimensional Separation. Annual Review of Fluid Mechanics
2001;33:129–154.
18. Craik, A.. Nonlinear resonant instability in boundary layers.Journal of Fluid Mechanics1971;50:393–413.
19. Borodulin, V.I., Kachanov, Y.S., Koptsev, D., Reschektayev, A.P.. Experimental study of resonant interactions of instability waves in a self-similar boundary layer with an adverse pressure gradient: II. detuned resonance.Journal of Turbulence2002;3(63):1–32.
20. Kachanov, Y.S., Levchenko, V.Y.. The Resonant Interaction of Disturbances at Laminar-Turbulent Transition in a Boundary Layer.Journal of Fluid Mechanics1984;138:209–247.
21. Plogmann, B., W¨urz, W., Kr¨amer, E.. Stability of a boundary layer flow in the wake of a medium roughness element. 44th AIAA Fluid Dynamic Conference, Atlanta; 2014. AIAA 2014-2886.
22. Sartorius, D..Experimental Investigation of Weakly Nonlinear Interactions of Instability Waves in a Non Self-Similar Boundary Layer on an Airfoil. Ph.D. thesis; University of Stuttgart; 2007.