Citation: Du, Longhuan, Berson, Arganthaël and Dominy, Robert (2014) Aerofoil behaviour at
high angles of attack and at Reynolds numbers appropriate for small wind turbines.
Proceedings of the Institution of Mechanical Engineers, Part C: Journal of Mechanical
Engineering Science, 229 (11). pp. 2007-2022. ISSN 0954-4062
Published by: SAGE
URL:
http://dx.doi.org/10.1177/0954406214550016
<http://dx.doi.org/10.1177/0954406214550016>
This version was downloaded from Northumbria Research Link:
http://nrl.northumbria.ac.uk/25046/
Northumbria University has developed Northumbria Research Link (NRL) to enable users to
access the University’s research output. Copyright
©and moral rights for items on NRL are
retained by the individual author(s) and/or other copyright owners. Single copies of full items
can be reproduced, displayed or performed, and given to third parties in any format or
medium for personal research or study, educational, or not-for-profit purposes without prior
permission or charge, provided the authors, title and full bibliographic details are given, as
well as a hyperlink and/or URL to the original metadata page. The content must not be
changed in any way. Full items must not be sold commercially in any format or medium
without formal permission of the copyright holder. The full policy is available online:
http://nrl.northumbria.ac.uk/policies.html
This document may differ from the final, published version of the research and has been
made available online in accordance with publisher policies. To read and/or cite from the
published version of the research, please visit the publisher’s website (a subscription may be
required.)
*Corresponding author: School of Engineering and Computing Sciences, Durham University, Durham DH1 3LE Email: longhuan.du@durham.ac.uk
1
Aerofoil behaviour at high angles of attack and at Reynolds numbers
appropriate for small wind turbines
Longhuan Du*, Arganthaël Berson, Robert G. Dominy
School of Engineering and Computing Sciences, Durham University, Durham, UK
Abstract
The aerodynamic characteristics of a NACA0018 aerofoil have been investigated experimentally for incidence angles ranging from ° to ° in closed-jet and open-jet wind tunnels with different blockage coefficients at Reynolds numbers from 60,000 to 140,000. The results provide a comprehensive data set for studying the performance of typical, small-scale Darrieus wind turbine blades which mainly operate at relatively low Reynolds number and experience extreme angles of attack, particularly during start-up. Measurements in both very high and very low blockage, open-jet
wind tunnels capture a “second-stall” phenomenon at high angles of attack but this behaviour is not observed in the closed-jet wind tunnel confirming the sensitivity of aerofoil performance at extreme incidence to wind tunnel
configuration. Surface flow visualization suggests that the “second-stall” occurs when the flow separation point near the leading edge of the aerofoil moves from the suction side to the pressure side which leads to a sudden change of wake structure. In the closed-jet wind tunnel, the tunnel walls constrain the wake and prevent the flow from switching from one regime to another. The measured data are also used to demonstrate that established wind tunnel blockage corrections break down under these extreme, post-stall angles of attack.
Keywords
2
1.
INTRODUCTION
The present investigation of the behaviour of aerofoils over the whole range of angles of attack and at low Reynolds number is motivated by the need to better understand the start-up behaviour of lift-driven Vertical-Axis Wind Turbines (VAWTs). VAWTs such as the Darrieus turbine (shown in figure 1) have relatively high efficiency and low cost, which makes them well positioned for small-scale, domestic energy production and their insensitivity to wind direction allows them to harness wind energy in urban or other complex environments. Detailed reviews of the merits of VAWTs can be found in References [1, 2].
Fig. 1 Typical Darrieus wind turbine configuration (3-bladed, H-rotor)
A controversial aspect of Darrieus VAWT development concerns their ability to self-start [3]. Kentfield et al [4] claimed that the Darrieus turbine is inherently non-self-starting while some other studies (e.g. [1, 2, 5]) have stated that with careful aerofoil selection self-starting can be induced. More recently, experiments and numerical simulations [3] have demonstrated that a three-blade design is preferable to two-blades as it potentially allows self-starting irrespective of the turbine starting position but better modelling of the physics of start-up is still necessary to identify and optimise the most important aerodynamic characteristics for starting.
Modelling the start-up of VAWTs requires aerodynamic data for the rotor blades under the full range of realistic
operating conditions. VAWTs are mostly small and therefore they experience lower Reynolds numbers (~ − ~ )
than most other wind turbine and aerospace applications and it is well known that the aerodynamic performance of the blades differs significantly from that at high Reynolds number (e.g. [6-8]). One of the most extensive and reliable sources of low-speed aerofoil performance data is that provided by Selig et al [9]. They measured a large number of aerofoils at Reynolds numbers comparable to those experienced by typical Darrieus turbines. Nevertheless, all their measurements were limited to the range − °< α < °. Indeed, most applications in aeronautics require that operation at high angle
3
of attack, beyond the onset of stall, be avoided. As a result, there has been little interest in the exploration of severely post-stall aerofoil behaviour and the lack of reliable aerofoil data under these conditions poses a problem for the accurate modelling of VAWT start-up.
During start-up, the blades of a VAWT experience all possible angles of attack from -180° to °. Only when the tip speed ratio becomes larger than one is this range reduced [10]. The most complete data set available was published by Sheldahl and Klimas [11] who studied seven symmetrical aerofoils at angles of attack up to ° and whose data has provided the foundation for many VAWT performance studies (e.g. [5, 12, 13]). However, recent research has raised questions over the reliability of this dataset. For example, Hill et al. [12] identified very substantial differences between measurements in different wind tunnels under deep-stall conditions and Worasinchai et al. [14] demonstrated that under high incidence configurations the geometry of the wind tunnel test section had a significant influence on the measured post-stall lift and drag forces. In particular, he found that when using an open working section, in order to minimise wall blockage effects, a sudden decrease in lift and drag occurred as the angle of attack approached ° (and ° . Worasinchai et al.’s finding is consistent with the study of Swalwell et al. [15] which also shows a sudden aerodynamic force decrease although the authors do not comment on the characteristic which occurred at relatively low blockage (1% at zero incidence to 6% at 90 degrees) and turbulence intensity (0.6%). This “second-stall” was not observed in the experiments by Sheldahl and Klimas [11], which were performed in a closed-jet wind tunnel with a blockage range from 1% (zero incidence) to 7% (90 degrees incidence) and a turbulence intensity of 1.38%.
The vast majority of previous aerofoil studies have been conducted in closed wind tunnels (e.g. [9, 11, 16]) at low incidence and low blockage (e.g.[9, 16-18]) but even under those conditions extraneous forces due to boundary effects may occur as the flow about the model is constrained by the walls. The first investigations of these boundary interference effects date back to the 1920s [19] and since then numerous models have been developed to correct for the effect of blockage and other boundary effects on measured aerodynamic coefficients (e.g. [19, 20]). However, applications which require aerofoil data at large angles of attack stretch the capabilities of closed wind tunnel working sections and the validity of blockage corrections becomes questionable, particularly during the transition from predominantly attached, pre-stall flow to wake dominated bluff-body flow. Open-jet wind tunnels partially alleviate the problems that are associated with increased wall blockage at high incidence in closed working sections but such configurations themselves affect the flow as the streamline curvature at the boundary of an open-jet is greater than that for an infinite jet flow since there is no external flow to resist the deformation [21]. Corrections for open-jet measurements of the flow around aerofoils exist (e.g. [19, 20]), but there has been little attempt to validate them for extreme angles of attack.
4
The present paper examines the performance of a NACA0018 aerofoil (a widely adopted aerofoil for VAWTs) over the whole range of angles of attack and at low Reynolds numbers relevant to VAWT applications. Only the static data is considered here, although dynamic effects such as hysteresis and dynamic stall need to be taken into account in a definitive model of the start-up of a VAWT [10].
Tests were performed in three different wind tunnel test sections: a closed-jet with a relatively large chord-to-tunnel height ratio, (c⁄ h), which is the measure of the maximum blockage; an open-jet with identical dimensions; and a second open-jet section having a very small c⁄h ratio, which acted as a low blockage reference tunnel. The validity of widely used corrections for blockage and other boundary effects at high angles of attack is assessed by comparing the aerodynamic forces measured in the different wind tunnel sections. Further investigations of the flow in the wake and
near the surface of the aerofoil were performed in order to explain the “second-stall” phenomenon observed by Worasinchai et al. [14].
2.
EXPERIMENTAL CONFIGURATION
2.1 Wind tunnels and test aerofoil
The closed-jet tests were conducted in a working section having a square cross-section with solid walls measuring mm × mm over a range of velocities from m/s to m/s. The open-jet test section had the same dimensions but without the top and bottom walls. The flow in both closed and open tunnels was uniform with less than 1% deviation of yaw and velocity across the test zone. The free-stream turbulence intensity in the test plane in both working sections was approximately 1%. These wind tunnel test conditions closely matched those of the reference tunnel. For all tests the model was located in an established zone of negligible axial static pressure gradient in order to minimise horizontal buoyancy effects [22].
The aerofoil section was the NACA0018 symmetric aerofoil. The NACA00XX series was chosen as these aerofoils have been the most widely used in Darrieus wind turbine studies (e.g. [1-3, 23]). Despite this there are few, if any, reliable performance data available for these aerofoils over the full range of incidence, particularly at low Reynolds number. The test aerofoil was manufactured by rapid prototyping from Fullcure 720, thus giving a high surface profile precision (± . mm). The aerofoil spanned the full width of the test section in order to minimise, but not entirely eliminate, tip effects and hence to provide the best approximation of a two-dimensional flow along most of the span. The aerofoil was constructed around an 8mm diameter steel bar which passed along its entire span and extended from one end to provide a rigid mounting. When used in the larger working section of the reference tunnel, 380 mm radius circular
5
endplates were fitted to each wing tip to mimic the nominally 2D flow of the smaller test sections. A chord length of mm was chosen to provide the required Reynolds number range and to provide a large-enough cross-sectional area to accommodate internal pressure instrumentation. The chord-to-tunnel height ratio was, c h⁄ ≈ . , corresponding to a blockage range from % (zero incidence) to % (90 degrees). Measurements were performed at three different Reynolds numbers (60,000, 100,000 and 140,000) for angles of incidence ranging from ° to °.
In order to assess the impact of wind tunnel configuration and the reliability of blockage corrections, reference measurements were also performed in the Durham University m, ⁄ open-jet wind tunnel, which has a nozzle dimension of . m (height) × . m (width) [22]. This arrangement led to a chord-to-tunnel width ratio, c h⁄ ≈ . , and a low blockage range from . % to %. The measurements were conducted at the same Reynolds numbers as those in the smaller open- and closed-jet tunnels
2.2 Measurements of static aerodynamic forces
Surface pressure measurements were obtained from pressure tappings (each hole having a diameter of . mm) symmetrically distributed at mid-span on the upper and lower surfaces of the aerofoil. The static surface pressure measurements were obtained using a SensorTechnics 103LP10D transducer through a Scanivalve at a sampling rate of 800Hz and averaged over a period of 3 seconds. The specification of the pressure transducers is given in Table 1. Data were acquired using a National Instruments USB-6218 ADC with 16 channels and a 16 bits resolution. In all the wind tunnels, the free stream total and static pressures at the test plane were obtained from a nozzle calibration based upon pressure measurements in the plenum and at the test section entry. The lift and drag coefficient were then calculated by integrating the pressure along the surface of the aerofoil (see for example [24]) .
Operating pressure range ±10 mbar
Sensitivity 0.25 V/mbar
Repeatability 0.1% FSO
Response time 2 μsec
Linearity & Hysteresis 1% FSO
Temperature (0-500C) 0.5% FSO
Table 1 The specifications of the pressure transducer, SensorTechnics 103LP10D
2.3 Surface flow visualization
Surface flow visualization was performed in the smaller open- and closed-jet test sections at the Reynolds number of 140,000 using a fluorescent pigment suspended in kerosene. The surface of the blade was painted black to maximise the contrast of the flow patterns. Visualization was conducted on a limited region centred about mid-span. The region was
6
delimited by self-adhesive tape to improve the quality of the image. Small spanwise disturbances may be created locally by the tape but this does not significantly influences the uniform flow at the centre of the area interested. The aerofoil was removed from the wind tunnel to record flow patterns. The repeatability of the images in terms of the positional and angular alignment of the axes of the camera and the blade chord line was accurate to 1mm and 1 degree respectively. 2.4 Velocity field measurements
The pressures, velocities and flow trajectories downstream from the aerofoil were measured using a conical-head five-hole pressure probe with a diameter of 5mm. The size of the probe limits the spatial resolution of flow structures that are smaller than the probe head but previous studies have demonstrated that there is no significant impact on the flow itself [25, 26]. The probe was calibrated for pitch and yaw (see figure 2) within the range of ± ° and for a range of velocities exceeding the peak test flow velocity. Details about the five-hole probe technique and calibration methods can be found in reference [26]. The five pressure signals were sampled at a frequency of 800Hz, and averaged over a period of 10 seconds. Pressures, velocities and flow direction were obtained using in-house post-processing routines based on a calibration map that had been obtained using a dedicated probe calibration facility. Errors were estimated to be ±0.3m/s (± % ) for velocity magnitude and ± . °degrees for pitch angle. Measurements were performed both in the smaller open- and closed-jet tunnels at Reynolds numbers of 100,000 and 140,000. As depicted in Figure 2, the aerofoil was mounted about a horizontal axis and the probe was placed mm ( . c) downstream of the trailing edge of the aerofoil (when set at zero incidence). The probe was traversed in the vertical direction with a positional resolution of . mm over a distance of 250 mm ( . c) with its starting position set 30 mm ( . c) below the chord line of the aerofoil when set at zero incidence angle. The origin of the probe coordinate system was taken at the starting position of the probe throughout this study.
7
3.
RESULTS
3.1 Static wind tunnel measurements
Static aerodynamic forces were calculated from the surface static pressure coefficients in the three test sections at three different Reynolds numbers (60,000, 100,000 and 140,000). Since no significant differences in flow behaviour were observed the results presented and discussed here focus on just one test condition ( Re=140,000 ) although data obtained at all of the Reynolds numbers have been published for completeness [27].
Figure 3 shows the variation of lift coefficient with incidence measured in the closed-jet wind tunnel at the Reynolds number of 140,000over a limited range of incidence from ° to ° for which comparative data from other sources is readily available [18, 28] and used to validate the pressure derived loads obtained from this study. All of the data relate to uncorrected closed section tests at similar Reynolds number and the corresponding blockage ratios at zero incidence were 4% for the study of Gerakopilos et al. [18] and 3.6% for Timmer et al. [28]. Prior to stall, there are two distinct regions in the lift curve. At low angles of incidence, from ° to approximately °, the lift coefficient grows almost linearly following the ideal lift slope [16]. Above °, the lift coefficient increases more slowly as the angle of incidence tends towards the stall angle.
Fig. 3 Lift coefficient comparison with previous investigations
The peak lift coefficient value in the current study is 1.05 at ° while other researchers found a peak in the lift coefficient at approximately ° with a value closer to 1.0. The larger stall angle and the slightly lower lift coefficient around °is thought to be due to higher turbulence intensity in the wind tunnel used for the present study (1%) compared to Gerakopulos et al.’s [18] and Timmer et al.’s [28] studies, which were 0.3% and 0.02% respectively. This is consistent with Swalwell et al.’s experimental measurements [15] on a NACA0021 aerofoil, which showed that larger turbulence
8
intensity will result in a delayed stall with slightly lower lift force around °. Moreover the aerofoils investigated in those studies were made from polished aluminium, which results in lower surface roughness than in the present study where unpolished RP material was used. Fuglsang et al. [24] demonstrated that a rough surface also delays the stall angle of an aerofoil. At the low Reynolds numbers considered here, all three sets of data show a similar behaviour at stall, where the loss of lift force occurs very suddenly with increasing angle of incidence. It may be noted that the results of Gerakopulos et al. [18] seem to show a more gradual stall but it is believed that this is an artefact due to the lack of data point resolution near the stall angle. This behaviour differs significantly from what is observed at higher Reynolds number where the transition to stall is usually more gradual. For example, Sheldahl and Klimas [11] demonstrated a more gradual stall behaviour from about ° to ° at Re=360,000.
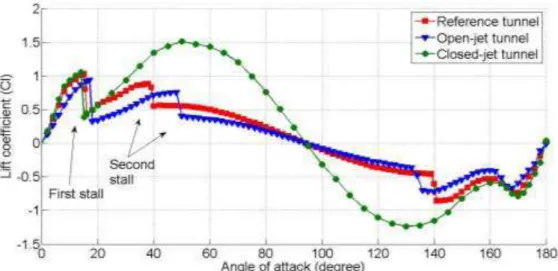
Lift coefficients over the full incidence range are presented in Figure 4, measured in all three test sections with an enlarged view of the small incidence characteristics given in Figure 5. Results from the reference tunnel lie between the smaller closed- and open-jet data. The stall angles in the closed tunnel, reference tunnel and open tunnel are approximately °, ° and ° respectively and the corresponding peak values of the lift coefficient are 1.05 (at °), 1.02 (at °) and 0.94 (at °) respectively. These results are consistent with the classic wind tunnel blockage correction theory, i.e. that a relatively larger/smaller lift will be measured in the closed/open tunnel when compared with the lift for the same model in the absence of any blockage or other boundary effects [19, 20]. In addition, due to the curvature of the flow resulting from the tunnel wall effect, the effective angle of attack in the closed and open tunnels is increased and reduced respectively compared with the reference results.
The most interesting phenomenon to observe from Figure 4 is a “second-stall” captured in both the open-jet and reference wind tunnels but not in the closed-jet test section. In the reference tunnel, the lift coefficient gradually increases from its post-stall minimum of 0.42 at ° to 0.83 at ° before suddenly dropping to 0.55 at °. The characteristic is mirrored about ° albeit with lower lift coefficient values when the apparent wind is from behind the aerofoil. Here the conventional but more gradual stall is observed at °, with a sudden second-stall at °.
Similar second-stall behaviour was observed in the open-jet tunnel but with a delayed second-stall angle (at °). In contrast, the closed-jet tunnel results show a gradual increase in lift coefficient from ° to ° followed by a gradual decrease to zero lift at ° (see Figure 3). No second-stall was observed.
Figure 6 presents the drag coefficient measured in the three different wind tunnel configurations. The drag coefficient shows a sudden decrease at the corresponding second-stall angle in open-jet and reference tunnels. The drag coefficient for the closed-jet section reaches an unusually high value of 3.42 as a consequence of its high blockage ratio at °incidence.
9
These results confirm the existence of the second-stall phenomenon that has previously been measured by Worasinchai et al.[14, 29] and Swalwell et al. [15].
Fig. 4 Lift coefficient comparison among different wind tunnel configurations
10
Fig. 6 Drag coefficient comparison among different wind tunnel configurations 3.2 Wind-tunnel corrections
In order to account for the effect of the wind tunnel on the measured aerodynamic forces, classic wind-tunnel corrections are applied.
In a closed-jet wind tunnel, the correction of the aerodynamic forces includes the effects of solid blockage, wake blockage and separation blockage. The solid blockage is the blockage induced by the volume of the model itself. The corresponding correction factor, εs, is given by [19, 20]
εs=π{ + . t c⁄ } A
β h , (1)
where t c⁄ is the thickness-to-chord ratio, A is the cross-section area of the aerofoil, h is wind tunnel height and = √ − M is the Prandtl-Glauert factor accounting for compressibility effects with M the Mach number. At the low flow velocities considered here, M is small and therefore ≈ .
The wake blockage relates to the velocity increment induced by the presence of the wake in the tunnel section. The correction factor for the wake blockage is [19]
εw= . c⁄h + .β C u , (2)
11
For aerofoils at large angles of attack, the flow will separate from the aerofoil suction side and, therefore, an additional correction for the separated flow should also be considered. Maskell [30] performed a series of studies about flat plates (i.e. bluff bodies) in a closed-jet wind tunnel, which yielded the following correction factor for separation blockage:
εs = . θ c h⁄ C u , (3)
where θ is the separation blockage factor. It is suggested that the separation factor be 0.96 for two-dimensional flow [20], based on experimental results obtained by Maskell.
In addition to the effect of blockage on the measured data, interference between the lift created by the aerofoil and the tunnel solid boundaries needs to be accounted for. Assuming that the model is located at the centre of the test section, the corresponding residual corrections to lift and drag forces, as well as incidence angle are given by [19, 20]
∆Cl= Clu{−π βh + π βh }, (4)
ΔC = −C u + . M εs , (5)
Δ = Clu πβh { − . t c⁄ } − Clu π β h { + . t⁄ }c , (6)
where Clu is the uncorrected lift coefficient
Finally, the corrected dynamic pressure q , lift coefficient Cl , drag coefficient C and incidence angle are given by [19, 20]
q = qu{ + εT . − M }, (7)
Cl = Clu+ ∆Cl uc , (8)
C = C u+ ∆C uc , (9)
12
where qu and u are the uncorrected dynamic pressure and incidence angle, respectively, and εT= εs+ εw+ εs .
In an open-jet wind tunnel, the flow is free to expand and therefore the solid and wake blockages (including separation blockages) are usually negligible. However, the effect of streamline curvature on the measurements, due to the diverging nature of the jet, needs to be corrected for. The correction applied in the present study is based on Garner et al.’s approach [19]. The effect of downwash is neglected, as suggested by Fuglsang et al. [24]. The final corrections for the open-jet are [19, 20]
Cl = Clu+ Cluπ βh , (11)
C = C u− π 0− Clu, (12)
= u− π 0− Clu , (13)
where L ⁄L is a function of the chord-to-tunnel height ratio (c⁄h) explained in Reference [19].
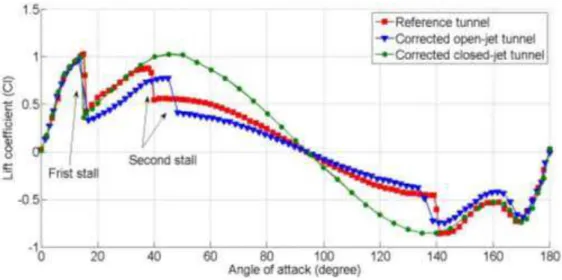
Figures 7 and 8 show the corrected lift coefficient for all three tunnels although for the low blockage reference measurements the correction is negligible. Before the first-stall angle (about °) the corrected results for both open- and closed-jet wind tunnels closely match the reference data, save for some slight discrepancies near the stall angle. With increasing incidence the corrected data from the closed-jet tunnel matches the reference measurements until the second-stall at about °. Since no second-stall was observed in the closed-jet, the lift continues to increase to a peak at approximately ° . Corrected data from the open-jet tests capture the second-stall but under-predict the lift force between the first- and second-stall angles. Although the blockage correction converges the first-stall data for all three test sections that is not true of the second-stall where the phenomenon continues to be seen almost ° later than the reference case, possibly as a consequence of there being no proper downwash correction. The effect of downwash is usually small at low angles of incidence for a nominal 2D test [24], but it might become comparable to the effect of streamline curvature when the flow is separated at large incidence, the flow is highly unsteady and the jet dimension exceed the
13
aerofoil section dimension. Unfortunately, existing downwash and streamline curvature corrections cannot be applied simultaneously as they rely on conflicting assumptions [24].
Corrected drag coefficients are presented in Figure 9. Like the lift coefficient curves, the corrected closed-jet results match the reference until the second-stall occurs whereas the corrected open-jet data results in lower drag coefficients after the first-stall angle.
Fig. 7 Reference tunnel lift coefficient comparing with corrected open- and closed-jet results
14
Fig. 9 Reference tunnel drag coefficient comparing with corrected open- and closed-jet results
3.3 Surface flow visualisation
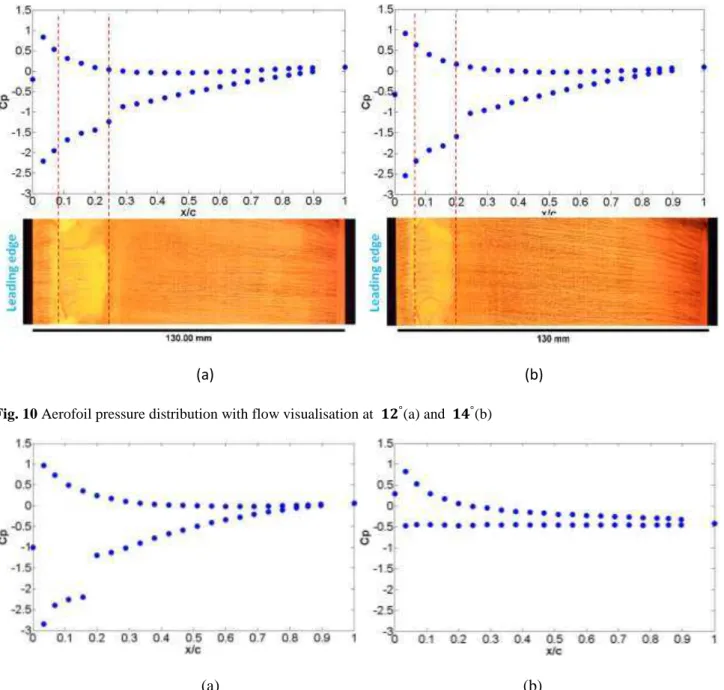
Surface flow visualisation was used to further investigate the characteristics of the flow near both the first- and second-stall angles, in the closed- and open-jet test sections. Figure 10 and 11 present the pressure distributions at angles of incidence before first-stall ( °, ° and °) and at the stall angle ( °) with two surface flow visualisation photos (Figure 10 (a) and figure 10 (b)). Results are only presented for the open-jet case but very similar flow features were observed from the closed-jet tunnel tests up to the first-stall. Before first-stall, a laminar separation bubble is clearly indicated by both the surface flow and pressure data (pressure coefficient C ) with the separation and re-attachment lines highlighted by dashed red lines in the figures. Increasing the angle of incidence causes the separation bubble to move upstream and to reduce in length, which is qualitatively consistent with the study performed by previous researchers such as Gerakopulos et al. in a closed wind tunnel[18]. The spanwise non-uniformities at both the top and bottom of the visualization pictures (figure 10 (a) and (b)), are experimental artefacts created by the presence of tape at the edges of the visualization region. Tape affects the flow direction only locally and the flow of interest along the centreline of the images remains undisturbed. When the aerofoil stalls at ° (Figure 11 (b)), the bubble bursts resulting in full leading-edge stall characterised by a sudden and significant reduction in the suction pressure peak (negative) and lift coefficient. Figure 12 (a) illustrates the pressure distribution measured at incidence angles before and after the second-stall in the open-jet tunnel while Figure 12 (b) shows the pressure distribution in the closed-jet tunnel for a similar incidence range. Since the flow is fully separated from the aerofoil leading edge after first-stall, suction surface flow visualisation provides no useful information and is therefore not shown. It can be seen from Figure 12 (a), by examination of the pressure coefficients at incidence angles before and after the second-stall ( ° and ° respectively) that after the second-stall the suction surface pressure is significantly increased (less negative). This sudden pressure change is also
15
captured in the reference tunnel tests around the corresponding second-stall angle and its magnitude suggests that a significant change of flow structure must have occurred in the wake of the fully stalled aerofoil. Further investigation drew focus to small changes in the leading edge separation point. Data from the closed-jet tunnel show no sudden change but a more progressive pressure increase with increasing incidence as can be seen in Figure 12 (b). It should also be noted that the suction surface pressures in closed-jet are much lower (more negative).
(a)
(b)
Fig. 10 Aerofoil pressure distribution with flow visualisation at °(a) and °(b)(a)
(b)
16
(a)
(b)
Fig. 12 Aerofoil pressure distribution in the open-jet tunnel before and after the “second-stall” (a) and in the closed-jet tunnel for the similar incidence range (b)
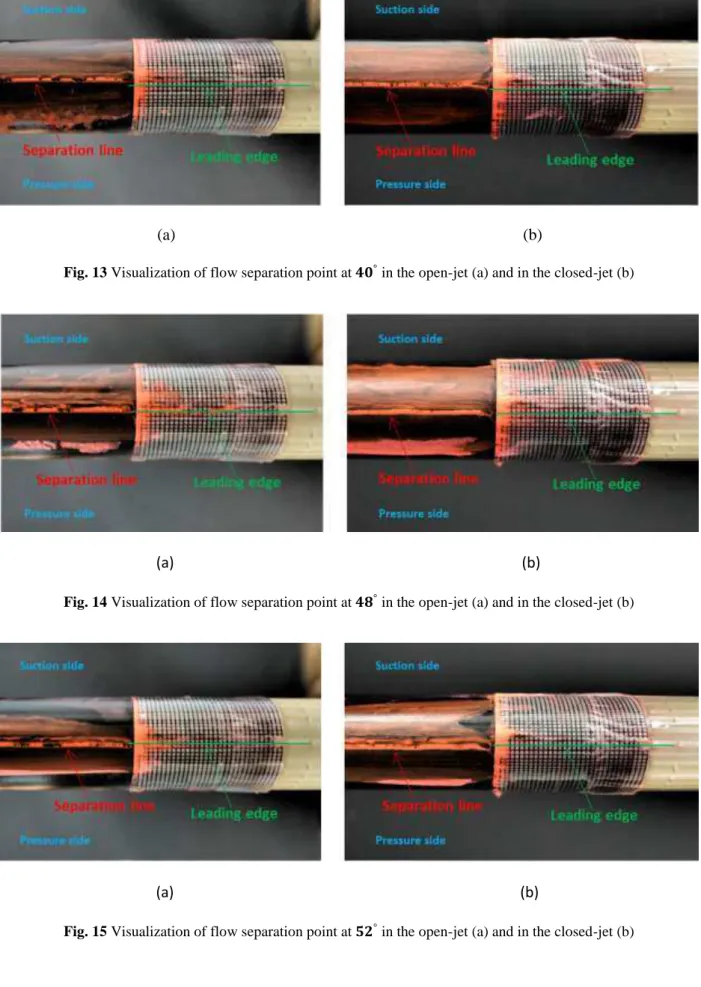
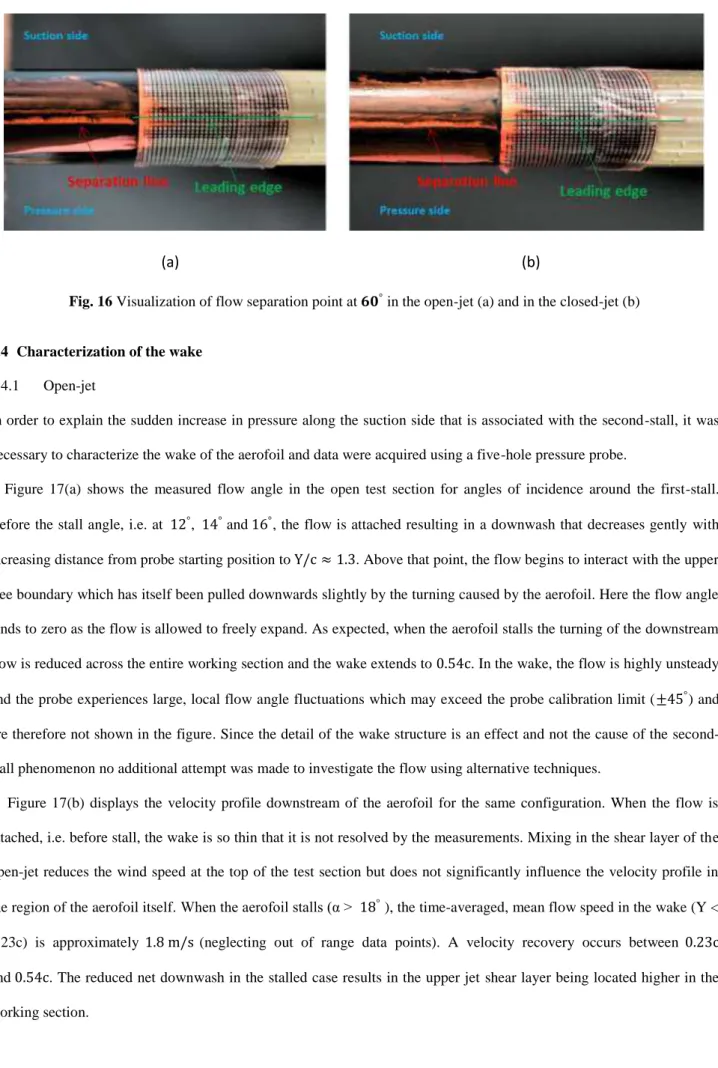
To further investigate the second-stall phenomenon, close attention was paid to the location of the leading edge separation line and its impact on the wake structure. The open-jet results are considered first. The images in Figures 13-16 were taken parallel to the chord line of the aerofoil and the leading-edge pressure tapping was used as a reference to ensure a consistent identification of the leading edge. Graph paper was wrapped around the leading edge to provide a measure of the location of the separation line relative to that datum. Figure 13(a) shows that at an incidence of ° the separation line lies approximately 1mm downstream from the leading edge on the suction side ( s s⁄ = . × − ) where s is the total distance measured along the suction surface and s0 is the surface length of flow separation). As the angle of incidence increases, the separation point moves towards the leading edge as the stagnation point moves further onto the pressure side of the aerofoil and at ° (Figure 14(a)), which corresponds to the second peak observed in the lift curve of the open-jet test (Figure 4), the separation line almost coincides with the leading edge. Further increase of the angle of incidence causes the flow to separate on the pressure side of the leading edge (Figures 15(a) and 16(a)). At ° incidence, the separation line has moved 1.4 mm from the geometric leading edge on the pressure side. The second-stall corresponds to the angle for which the flow starts to separate on the pressure side rather than on the suction side.
Investigation of the location of the separation line for the closed-jet tunnel yields almost identical results to those obtained for the open-jet (Figure 13-16 (b)). However, it is known that there is no second-stall in that test section so the likelihood of a second-stall occurring cannot be due to the location of the separation point alone.
17
(a)
(b)
Fig. 13 Visualization of flow separation point at ° in the open-jet (a) and in the closed-jet (b)
(a)
(b)
Fig. 14 Visualization of flow separation point at �° in the open-jet (a) and in the closed-jet (b)
(a)
(b)
18
(a)
(b)
Fig. 16 Visualization of flow separation point at ° in the open-jet (a) and in the closed-jet (b)
3.4 Characterization of the wake
3.4.1 Open-jet
In order to explain the sudden increase in pressure along the suction side that is associated with the second-stall, it was necessary to characterize the wake of the aerofoil and data were acquired using a five-hole pressure probe.
Figure 17(a) shows the measured flow angle in the open test section for angles of incidence around the first-stall. Before the stall angle, i.e. at °, ° and °, the flow is attached resulting in a downwash that decreases gently with increasing distance from probe starting position to Y/c ≈ . . Above that point, the flow begins to interact with the upper free boundary which has itself been pulled downwards slightly by the turning caused by the aerofoil. Here the flow angle tends to zero as the flow is allowed to freely expand. As expected, when the aerofoil stalls the turning of the downstream flow is reduced across the entire working section and the wake extends to . c. In the wake, the flow is highly unsteady and the probe experiences large, local flow angle fluctuations which may exceed the probe calibration limit (± °) and are therefore not shown in the figure. Since the detail of the wake structure is an effect and not the cause of the second-stall phenomenon no additional attempt was made to investigate the flow using alternative techniques.
Figure 17(b) displays the velocity profile downstream of the aerofoil for the same configuration. When the flow is attached, i.e. before stall, the wake is so thin that it is not resolved by the measurements. Mixing in the shear layer of the open-jet reduces the wind speed at the top of the test section but does not significantly influence the velocity profile in the region of the aerofoil itself. When the aerofoil stalls (α > ° ), the time-averaged, mean flow speed in the wake (Y < 0.23c) is approximately . m/s (neglecting out of range data points). A velocity recovery occurs between . c and . c. The reduced net downwash in the stalled case results in the upper jet shear layer being located higher in the working section.
19
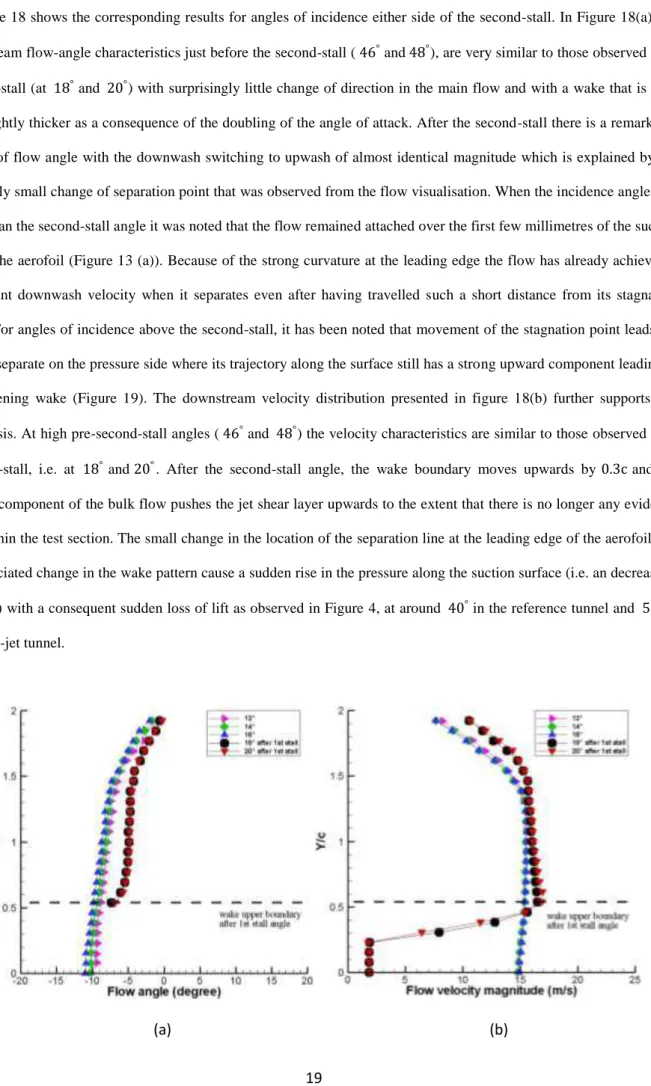
Figure 18 shows the corresponding results for angles of incidence either side of the second-stall. In Figure 18(a), the downstream flow-angle characteristics just before the second-stall ( ° and °), are very similar to those observed after the first-stall (at ° and °) with surprisingly little change of direction in the main flow and with a wake that is only very slightly thicker as a consequence of the doubling of the angle of attack. After the second-stall there is a remarkable change of flow angle with the downwash switching to upwash of almost identical magnitude which is explained by the seemingly small change of separation point that was observed from the flow visualisation. When the incidence angle was lower than the second-stall angle it was noted that the flow remained attached over the first few millimetres of the suction side of the aerofoil (Figure 13 (a)). Because of the strong curvature at the leading edge the flow has already achieved a significant downwash velocity when it separates even after having travelled such a short distance from its stagnation point. For angles of incidence above the second-stall, it has been noted that movement of the stagnation point leads the flow to separate on the pressure side where its trajectory along the surface still has a strong upward component leading to a broadening wake (Figure 19). The downstream velocity distribution presented in figure 18(b) further supports this hypothesis. At high pre-second-stall angles ( ° and °) the velocity characteristics are similar to those observed after the first-stall, i.e. at ° and °. After the second-stall angle, the wake boundary moves upwards by . c and the upward component of the bulk flow pushes the jet shear layer upwards to the extent that there is no longer any evidence of it within the test section. The small change in the location of the separation line at the leading edge of the aerofoil and the associated change in the wake pattern cause a sudden rise in the pressure along the suction surface (i.e. an decrease in velocity) with a consequent sudden loss of lift as observed in Figure 4, at around ° in the reference tunnel and ° in the open-jet tunnel.
20
Fig. 17 Open-jet downstream flow angle (a) and velocity (b) around first-stall, Re=140,000
(a)
(b)
Fig. 18 Open-jet downstream flow angle (a) and velocity (b) around second-stall, Re=140,000
Fig. 19 Schematic diagrams of flow structure for separation point movement from aerofoil suction side to pressure side in an open-jet wind tunnel
3.4.2 Closed-jet
Figures 20(a) and 20(b) show the downstream flow angle and velocity profiles for an incidence range ( °, °, ° and °) corresponding to the second-stall region that was observed in the open-jet study. The wake is similar regardless of the angle of incidence even though, from the flow visualisation, it has been noted that the separation line moves from the suction side to the pressure side over this range of incidence. Here the upper solid wall prevents any vertical flow component at that boundary which prevents the flow from switching to the second-stall flow regime (Figure 21). Note also that the measured downstream, bulk flow velocity is higher than that in the open-jet for the same incidence angle which is consistent with wind tunnel blockage correction concepts [19].
21
(a) (b)
Fig. 20 Closed-jet downstream flow angle (a) and velocity (b) at incidence angle of �°, °, ° and °, Re=140,000
Fig. 21 Schematic diagrams of flow structure for separation point movement from aerofoil suction side to pressure side in a closed-jet wind tunnel
4.
CONCLUSION
The static aerodynamic characteristics of a NACA 0018 aerofoil have been measured for the entire possible range of incidence, from ° to °, in both open-jet and closed-jet wind tunnels at three Reynolds numbers: 60,000, 100,000 and 140,000. Tests were also performed in an open-jet tunnel with a very low blockage ratio in order to provide a reference, eliminating significant blockage or other boundary effects. Results from both the reference and open-jet wind tunnel test sections demonstrated a “second-stall” phenomenon, at angles of incidence of ° and ° respectively, which is characterized by a sudden loss of both lift and drag forces. In contrast, the second-stall behaviour was not detected in the large blockage ratio closed-jet tunnel.
22
Classic wind tunnel corrections for the blockage and other boundary effects were applied to the open- and closed-jet data and compared with the reference case. Both corrected data sets closely match the results from the reference tunnel before the first-stall angle and the corrected closed-jet data remain is in very good agreement up to an incidence of °, above which the aerofoil in the reference tunnel undergoes its second-stall. The blockage-corrected open-jet data captures the second-stall, although delayed, but always under-predicts the aerodynamic forces between the first- and second-stalls. Thus the limits of existing wind tunnel corrections for open-jet wind tunnels seem to be exceeded under deep-stall conditions, probably as a consequence of inadequate consideration of the effect of downwash on streamline curvature under the bluff-body conditions of deep-stall. A downwash correction was proposed by Mangler [31] but it cannot be used jointly with the streamline curvature correction because of incompatible assumptions.
The second-stall was found to occur at the angle of attack where the separation point near the leading edge switches from the suction side to the pressure side of the aerofoil. Before the second-stall, the flow remains attached to the suction side of the aerofoil over a short but sufficient distance to induce downwash but when the separation line moves to the pressure side the separated flow has a significant upwash component. It is this small movement of the separation line about the leading edge which, because of the severe curvature at this location, results in the remarkable changes in wake size, flow direction and force generation.
In a large blockage closed-jet tunnel even at angles above the nominal onset of second-stall, the wake behind the aerofoil is restricted by the solid boundaries of the tunnel and despite similar movement of the separation point there is no sudden change in the wake structure and therefore no corresponding loss of lift and drag forces.
Finally, the following recommendations are proposed:
1. The aerodynamic behaviour of aerofoils at high angles of attack for Reynolds numbers ranging between ~ and ~ should be examined in wind tunnels with low blockage ratio (low chord to tunnel height ratio) or in open-jet tunnels as closed-jet tunnels with large blockage ratio do not capture the “second-stall”. Aerodynamic data measured in closed-jet tunnels with large blockage at this Reynolds range must be viewed with caution.
2. The limits of existing wind-tunnel corrections for open-jet tunnels are reached at high angles of incidence and better correction methods are necessary.
3. The impact of the “second-stall” on the start-up behaviour of VAWTs has yet to be determined. In addition, the next step in modelling VAWTs will be to assess how dynamic effects impact the aerodynamic performances of the aerofoil.
23
ACKNOWLEDGMENT
The authors would like to thank Colin Wintrip and the staff members of the workshops of the school of Engineering and Computing Sciences at Durham University for their help with setting up the experiments.
The award of a DONG studentship in support of this work is also gratefully acknowledged.
REFERENCES
1. Kirke, B.K., Evaluation of self-starting vertical axis wind turbines for stand-alone applications. PhD Thesis, School of Engineering, Griffith University, Australia, 1998.
2. Pawsey, N.C.K., Development and Evaluation of Passive Variable-Pitch Vertical Axis Wind Turbines. PhD Thesis, School of Mechanical and Manufacturing Engineering, The University of New South Wales, Australia, 2002.
3. Dominy, R.G., Lunt, P., Bickerdyke, A., and Dominy, J., Self-starting capability of a Darrieus turbine. Proceedings of the Institution of Mechanical Engineers, Part A: J. Power and Energy, 221(1): 111–120., 2007.
4. Kentfield, J.A.C., The Fundamentals of Wind-driven Water Pumpers. 1st ed. Taylor and Francis, ISBN 2884492399, 1996.
5. Rossetti, A., and Pavesi, G., Comparison of different numerical approaches to the study of the H-Darrieus turbines start-up. J. Renewable Energy, 50(0): 7-19, 2013.
6. Carmichael, B.H., Low Reynolds number airfoil survey. NASA CR 165803, Vol. I, 1981.
7. Mueller, T.J., and DeLaurier, J. D., Aerodynamics of small vehicles. Annual Review of Fluid Mechanics, 35: 89–111, 2003.
8. Yarusevych, S., Sullivan, P. E., and Kawall, J. G., On vortex shedding from an airfoil in low-Reynolds-number flows. Journal of Fluid Mech, 632: 245-271, 2009.
9. Selig, M.S., Guglielmo, J.J., Broeren, A.P., and Giguere, P., Summary of Low-Speed Airfoil Data, Vol. 1. SoarTech Publications, Virginia Beach, VA, 1995.
10. Worasinchai, S., Ingram,G.L., and Dominy, R.G., The physics of H-Darrieus turbine self-starting capability: flapping-wing perspective Proceedings of ASME Turbo Expo, Copenhagen, Denmark, June 11-15, 2012, Paper No. GT2012-69075, pp. 869-878.
11. Sheldahl, R.E., and Klimas, P.C., Aerodynamic Characteristics of Seven Symmetrical Airfoil Sections through 180-degree Angle of Attack for Use in Aerodynamic Analysis of Vertical Axis Wind Turbines. National Renewable Energy Laboratory, SAND80-2114, 1981.
24
12. Hill, N., Dominy, R.G., Ingram, G., and Dominy, J., Darrieus Turbines: the Physics of Self-starting. Proceedings of the Institution of Mechanical Engineers, Part A: J. Power and Energy, 223: 21–29, 2008.
13. McGowan, R., Raghav,V.S., and Komerath,N.M., Optimization of a Vertical Axis Micro Wind Turbine for Low Tip Speed Ratio Operation. Proceedings of the AIAA IECEC Conference, Atlanta, GA, 2012.
14. Worasinchai, S., Ingram,G.L., and Dominy, R.G., A low-Reynolds-number, high-angle-of-attack investigation of wind turbine aerofoils. Proceedings of the Institution of Mechanical Engineers, Part A: J. Power and Energy, 226(6): 748-763, 2011.
15. Swalwell, K.E., Sheridan, J., and Melbourne, W.H., The Effect of Turbulence Intensity on Stall of the NACA 0021 Aerofoil. 14th Australasian Fluid Mechanics Conference Adelaide University, Adelaide, Australia, 2001.
16. Abbott, I.H., and Von Doenhoff, A.E., Theory of Wing Sections: Including a Summary of Airfoil Data. Dover Publications, New York, 1959.
17. Selig, M.S., and McGranahan, B.D., Wind tunnel aerodynamic tests of six airfoils for use on small wind turbines. National Renewable Energy Laboratory, Colorado, 2004.
18. Gerakopulos, R., Boutilier, M.S.H., and Yarusevych, S., Aerodynamic characterization of a NACA 0018 airfoil at low Reynolds numbers. Proceedings of the 40th AIAA fluid dynamics conference and exhibit, Chicago, Illinois, 28 June–1 July 2010, AIAA Paper No. 2010-4629.
19. Garner, H.C., Rogers, E. W. E., Acum, W. E. A., and Maskell, E. C., Subsonic wind tunnel wall corrections. AGARDograph 109, 1966.
20. Ewald, B.F.R.E., Wind tunnel wall correction. AGARDograph 336, 1988.
21. Maeder, P.F., and Wood, A.D., Transonic wind tunnel test sections. J. Zeitschrift für angewandte Mathematik und Physik ZAMP, 7(3): 177-212, 1956.
22. Sims-Williams, D.B., and Dominy, R.G., The Design of an Open-Jet Wind Tunnel for Model Testing. SAE Technical Paper 2002-01-3340, 2002.
23. Castelli, M.R., Englaro,A., and Benini,E., The Darrieus wind turbine: Proposal for a new performance prediction model based on CFD. J. Energy, 36(8): 4919-4934, 2011.
24. Fuglsang, P., Antoniou, I., Sørensen, N.N., and Madsen, H., Validation of a Wind Tunnel Testing Facility for Blade Surface Pressure Measurements. Risø-R-981(EN), Risø National Laboratory, Denmark, 1998.
25. Dominy, R.G., and Hodson, H.P., An investigation of factors influencing the calibration of 5-hole probes for 3-D flow measurements. ASME Journal of Turbomachinery, 115: 513-519, 1995.
25
26. Ingram, G., and Gregory-Smith, D., An automated instrumentation system for flow and loss measurements in a cascade. Flow Measurement and Instrumentation, 17(1): 23-28, 2006.
27. Du, L., Berson, A. and Dominy, R.G., NACA0018 behaviour at high angles of attack and at Reynolds numbers appropriate for small turbines: Durham University ECS Technical Report ECR-TR 2014/01.
28. Timmer, W.A., Two-dimensional low-Reynolds number wind tunnel results for airfoil NACA 0018. Wind Engineering, 32: 525-537, 2008.
29. Worasinchai, S., Small Wind Turbine Starting Behaviour. PhD Thesis, School of Engineering and computing science, University of Durham, 2012.
30. Maskell, E.C., A theory of the blockage effects on bluff bodies and stalled wings in a closed wind tunnel. ARC RM 3400, 1963.
31. Mangler, W., The Lift Distribution of Wings with End Plates. NACA Technical Memorandum No. 856, Washington, 1938.
APPENDIX I
Notation
A Cross-section area of the aerofoil
c Aerofoil chord
C Corrected drag coefficient
C u Uncorrected drag coefficient
ΔC Residual correction to drag
Cl Corrected lift coefficient
Clu Uncorrected lift coefficient
∆Cl Residual correction to lift
C Pressure coefficient
h Wind tunnel height
L L
⁄ Function of the chord-to-tunnel height ratio (c⁄h)
26
q Corrected dynamic pressure
qu Uncorrected dynamic pressure
s Total aerofoil suction side surface length
s Surface length of flow separation
t Aerofoil thickness
Angle of attack
Corrected angle of attack
u Uncorrected angle of attack
Δ Residual correction to angle of attack
Prandtl-Glauert factor
θ Separation blockage factor
εs Solid blockage correction factor
εs Flow separation correction factor
εw Wake blockage correction factor