I
I
n
n
c
c
r
r
e
e
a
a
s
s
i
i
n
n
g
g
t
t
h
h
e
e
M
M
a
a
r
r
k
k
e
e
t
t
A
A
c
c
c
c
e
e
s
s
s
s
f
f
o
o
r
r
A
A
g
g
r
r
i
i
c
c
u
u
l
l
t
t
u
u
r
r
a
a
l
l
P
P
r
r
o
o
d
d
u
u
c
c
t
t
s
s
f
f
r
r
o
o
m
m
B
B
a
a
n
n
g
g
l
l
a
a
d
d
e
e
s
s
h
h
t
t
o
o
t
t
h
h
e
e
E
E
U
U
Paper 58Jorge Nufiez Ferrer
House No 40/C, Road No 11 (new), Dhanmondi R/A, Dhaka-1209 Bangladesh
Tel: (880 2) 8124770, 9141703. 9141734 Fax: (880 2) 8130951
E-mail: cpd@bdonline.com
Website: www.cpd-bangladesh.org
First Published April, 2006
Copyright © Centre for Policy Dialogue (CPD)
Price Tk. 100.00
implementing process. The dialogues are designed to address important policy issues and to seek constructive solutions to these problems. The Centre has already organised a series of such dialogues at local, regional and national levels. The CPD has also organised a number of South Asian bilateral and regional dialogues as well as some international dialogues. These dialogues have brought together ministers, opposition frontbenchers, MPs, business leaders, NGOs, donors, professionals and other functional group in civil society within a non-confrontational environment to promote focused discussions. The CPD seeks to create a national policy consciousness where members of civil society will be made aware of critical policy issues affecting their lives and will come together in support of particular policy agendas which they feel are conducive to the well being of the country.
In support of the dialogue process the Centre is engaged in research programmes which are both serviced by and are intended to serve as inputs for particular dialogues organised by the Centre throughout the year. Some of the major research programmes of the CPD include The Independent Review of Bangladesh's Development (IRBD), Trade Related Research and Policy Development (TRRPD), Governance and Policy Reforms, Regional Cooperation and Integration, Investment Promotion and Enterprise Development, Agriculture and Rural Development, Ecosystems, Environmental Studies and Social Sectors and Youth Development Programme. The CPD also conducts periodic public perception surveys on policy issues and issues of developmental concerns.
Dissemination of information and knowledge on critical developmental issues continues to remain an important component of CPD’s activities. Pursuant to this CPD maintains an active publication programme, both in Bangla and in English. As part of its dissemination programme, CPD has decided to bring out CPD Occasional Paper Series on a regular basis. Dialogue background papers, investigative reports and results of perception surveys which relate to issues of high public interest will be published under its cover. The Occasional Paper Series will also include draft research papers and reports, which may be subsequently published by the CPD.
The present paper titled Increasing the Market Access for Agricultural Products from Bangladesh to the EU has been prepared under the CPD programme on Trade Related Research and Policy Development (TRRPD). The paper was prepared by Jorge Nufiez Ferrer, Associate Research Fellow, Centre for European Policy Studies, University of Leuven, Belgium.
Assistant Editor: Anisatul Fatema Yousuf, Head (Dialogue & Communication), CPD. Series Editor: Debapriya Bhattacharya, Executive Director, CPD.
Abstract………... ii
List of Tables………... iii
List of Figures……… iii
1. Introduction………. 1
2. EU Trade Agreements Affecting Bangladesh……….. 2
3. The EBA and Trends in Trade with the EU for Bangladesh……….. 4
3.1 EBA and Trends for HS 07 – Edible Vegetables and Certain Roots and Tubers………. 6
3.1.1 Developments in the Garlic Market……… 9
3.1.2 Fresh and Chilled Vegetables………. 11
3.1.3 Other Vegetables……… 12
3.2 EBA and Trends HS19 Preparations of Cereals, Flour, Starch or Milk; Pastrycook Products………. 13
3.3 EBA and Trends for Rice………. 16
3.4 EBA and Sugar………. 19
3.5 Other Trade Opportunities of Non-EBA Affected Sectors……….. 21
3.5.1 The Jute Export Market to the EU………. 21
3.5.2 Prospects for the Poultry Sector………. 23
3.5.3 Organic Produce………. 24
3.6 Conclusions on Post-EBA Trade Performance……… 24
4. Reforms of The Common Agricultural Policy and Future Trade Implication 25
4.1 Implications of Decoupling……….. 27
4.2 Impacts of CAP Reform for Trade……….. 28
4.2.1 Rice………. 28
4.2.2 The Future Reforms of the Sugar Sector……… 29
5. Future Implications of a Further WTO Trade Liberalisation 31 5.1 Impacts of Likely WTO Agreements on Exports of Bangladesh to the EU… 32 5.1.1 Possible Tariff Reductions – Tariff Erosion Implications………….. 33
5.2 Elimination of Export Subsidies………. 33
6. Impacts of Import Requirements of The EU ………. 35
6.1 Rules of Origin………. 35
6.1.1 Rules of Origin and Cumulation for Bangladesh……… 37
6.2 SPS Requirements……… 37
7. Developing Market Opportunities and Increasing Value Added 43
7.1 Technical Assistance by the EU………... 43
7.2 Handling Non-Tariff Barriers……….. 44
7.3 The Role of FDI……….. 45
ACP African, Caribbean and Pacific Countries CAP Common Agricultural Policy
Cif Cost Insurance and Freight
CN Combined Nomenclature
CPD Centre for Policy Dialogue
EBA Everything but Arms
EC European Communities
ECU European Currency Unit
EPZ Export Processing Zones
EU European Union
FAO Food and Agriculture Organisation of the United Nations FDI Foreign Direct Investment
GATT General Agreement on Tariffs and Trade GSP Generalised System of Preference HACCP Hazard Analysis Critical Control Point
HS Harmonised System
Kg Kilogram LDCs Least Developed Countries
MTR Mid Term Review
RoO Rules of Origin
SAARC South Asian Association for Regional Cooperation SPS Sanitary and Phyto-Sanitary
TBT Technical Barriers to Trade TRA Trade Related Assistance
TRIPs Agreement on Trade-Related Aspects of Intellectual Property Rights
UNCTAD United Nations Conference on Trade and Development
US United States
USDA United States Department of Agriculture
WCO World Customs Organisation
WTO World Trade Organisation
This paper analyses the present developments and future prospects for increased agricultural trade for Bangladesh with the EU. The trade relationship with the European Union (EU) is seeing important changes in recent years. The EU has unilaterally eliminated in 2001 tariff barriers for products originating in Less Developed Countries through the Everything But Arms (EBA) agreement, which includes the highly protected agricultural products. This creates important export opportunities for Bangladesh. The paper analyses in detail the export trends for major agricultural products from Bangladesh and other countries in the region to look for any evidence of an impact from the EBA. Despite the short period analysed, there are indications of some positive impacts. However, these are often rather weak and at times there are none where expected. Analysing the trends of regional competitors, the paper implies that even with EBA Bangladesh lacks price competitiveness in some products, and most importantly a lack of marketing strategy directed towards EU consumers. For the future, the impact of the EBA will also depend on a number of other factors, such as any progress in the farm liberalisation negotiations at WTO, amendments in the Sanitary and Phytosanitary rules and the reform of the EU’s Common Agricultural Policy. All of these factors have the potential to erode the benefits of the EBA considerably. The paper also addresses some important strategic aspects to improve import opportunities, from marketing to taking advantage of the trade related assistance offered by the EU to the less developed countries.
Table 1: Bangladesh % Change Exports, index 2001=100 7 Table 2: Cif Prices in €/ 100 kg Garlic (HS 070320) 10 Table 3: Fresh or Chilled Vegetables (HS 070990), Cif prices
in€ per 100 kg 12
Table 4: New Trade or Trade Resurgence? Exports to the EU, 100 Kg
12 Table 5: Cif Price Comparison HS 19 products, 2003 16 Table 6: Jute Exports to the EU from Bangladesh 22 Table 7: Poultry meat projection; (in million metric ton) 23 Table 8: Total Rice Balance Sheet in the EU-15, 2001–2010
(million metric ton)
29
List of Figures
Figure 1: Exports of Vegetables to the EU (volume and value in € and US$)
8 Figure 2: Garlic Exports to the EU 10 Figure 3: Exports of Fresh or Chilled Vegetables to the EU 100
kg
11 Figure 4: Exports of Pastry Products of Bangladesh, HS19 13 Figure 5: Export Performance of Regional Competitors, HS 19 14 Figure 6: Export Growth of Pastry Products, HS19 15 Figure 7: Rice Exports from Bangladesh to the EU in 2000-2003 17 Figure 8: Percentage Change in Rice Exports to the EU in
2002-2003
18 Figure 9: Disaggregated by Rice Variety - Exports from
Bangladesh to the EU, 100 kg
19
Increasing the Market Access for Agricultural Products
from Bangladesh to the EU
1. INTRODUCTION
Market access to the European Union (EU) is of crucial importance to agricultural exporters worldwide. The single market of 25 member countries (soon to expand to 27 or more) represents, for trading partners, a wealthy single market with nearly 460 million consumers. Having a total GDP of US$ 11017 billion in 2003, the EU is a crucial trade partner as well as the largest importer of agricultural products in the world, worth US$91 billion in 2002.
For Bangladesh, the EU represents the most important export market. Presently, among LDCs (Least Developed Countries), Bangladesh is the most prominent exporter to the EU, representing 20 per cent of the total exports from all LDCs to the European market. The principal exports to the EU are textile products (90% of the EU imports from Bangladesh). In the last decade Bangladesh has enjoyed a growing overall trade balance surplus with the EU, which stood at around US$3 billion in 2002-2004. Agricultural exports, however, are only a small fraction of overall trade and exports to the EU, representing €189 million (US$213 million) in 2004 (Eurostat data).
Bangladesh has a positive trade balance on agricultural products with the EU and has seen a rise in the total value of exports in recent years. The performance is mixed, however, as for the food component of these exports (animal products, crops and vegetables) has not developed favourably, the value of exports in dollar term in 2003 equals the value in 1996 (approximately US$75 million). The highest export revenue for these products was in 1998 (US$138 million) but has seen a strong decline since.
This paper has the objective to analyse four important aspects that will dominate the trade relationship between Bangladesh and the EU for agricultural products in the future:
(a). the EU-EBA (Everything But Arms) agreement, which abolishes all EU tariff barriers for all imports from the LDCs from 2001 onwards (with the exception of a delayed application for three sensitive products) and expresses a commitment to enhance trade related assistance (TRA);
(b). the implications for trade of the latest reform of the Common Agricultural Policy (CAP);
(c). the implications of the agreement on the modalities for the WTO Doha round of negotiations (the “July Package”, agreed on 1 August 2004);
(d). the implications of the non-tariff barriers created by the SPS (sanitary and phytosanitary agreement of the WTO) measures and rules of origin requirements.
These four aspects have important implications for Bangladesh, as the EU is the principal trading partner, and new opportunities seem to be developing. The EU-EBA agreement has certainly the potential to increase the exports of agricultural products to the EU. However, the CAP reform and the likely agreement of generalised tariff reductions in the WTO can both benefit and harm the interests of Bangladesh. A reduction in tariff barriers for non-LDCs will certainly not benefit Bangladesh in its exports to the EU, as the price competitiveness with non-LDCs would be partially eroded. The rules of engagement in trade with the EU have to be analysed carefully and many aspects will depend on the decisions at WTO level, and the impact on domestic production of the latest reform of the EU’s Common Agricultural Policy.
The developments in the interpretation of the Agreement on the Application of Sanitary and Phytosanitary Measures (the "SPS Agreement") by the EU is a matter of concern as are any changes in the rules of origin or alterations in other non-tariff barriers. These can have considerable trade impacts, as latest developments are increasing the possibilities for WTO members to go beyond the basic WTO rules if “justifiable”.
2. EU TRADE AGREEMENTS AFFECTING BANGLADESH
The EU-EBA agreement has been introduced into the EU Generalised System of Preferences (GSP) in 2001. The GSP agreement came into force in 1971, because trade discrimination practices were not allowed under the GATT (General Agreement on Tariffs and Trade), a waver was introduced for developing countries (the so-called "enabling clause") creating the legal framework for the Generalised System of Tariff Preferences. Under this framework, developed countries are authorised to establish individual "Generalised Schemes of Tariff Preferences".
The countries covered by the EU-GSP include all developing countries and the EU member states. The present format of the policy originated in 1998. The main objective of this agreement is to grant special trade preferences to developing countries in order to foster development and help them to compete on international markets (EU Commission, 2001). The agreement has been renewed every three years. The EU Council Regulation (EC) No 2501/2001 (annexed to this document) contains the legal provisions for the GSP
scheme, which is applicable for the period from 1 January 2002 to 31 December 2005. However, the EBA regulation foresees that the special arrangements for LDCs should be maintained for an unlimited period of time and will not be subject to the periodic renewal of the EU scheme of generalised preferences. Therefore, the date of expiry of European Council Regulation (EC) No 2501/2001 does not apply to its EBA provisions. This section will only concentrate on those issues which are relevant to the EBA agreement.1 Presently there are 49 countries recorded as LDCs2 and covered by the EBA agreement. The aim of this agreement is to provide more favourable treatment to the group of LDCs than to other developing countries benefiting from the GSP, by extending duty-free access to all products from LDCs without any quantitative restrictions, except to arms and munitions. Thus, the EBA provides the most favourable regime available. The particular importance of the EU-EBA agreement is that the EU excluded most agricultural products from the GSP. Access to the EU for agricultural products is very important for any LDC, given the importance of the agricultural sector for their economies.
The EU has thus added 919 tariffs lines (see Annex A) to the list of duty-free access, including such sensitive products as: beef and other meat; dairy products; fruit and vegetables, including processed fruit and vegetables; maize and other cereals; starch; oils; processed sugar products; cocoa products; pasta; and alcoholic beverages. However, the duty-free access is not immediate for the tariff lines of banana, sugar and rice, and specific phasing-in periods apply. The precise implications are described in Kurzweil, Ledebur and Salamon (2003)3.
Banana The EBA initiative provides for the full liberalisation of the banana market between 1 January 2002 and 1 January 2006 by reducing the full EU tariff by 20 percent every year.
Rice Full liberalisation of the rice scheme will be phased-in between 1 September 2006 and 1 September 2009 by gradually reducing the full EU tariff to zero in the meantime in order to provide effective market access, LDCs rice can enter duty-free within the limits of a tariff quota. The initial quantities of this quota shall be based on the highest export
1
A more detailed description of the EU trade agreements can be found in Kurzweil, Ledebur and Salamon, (2003) or in the European Commission’s website:
http://europa.eu.int/comm/trade/issues/global/gsp/gspguide.htm.
2
The criteria for LDC categorisation and the list of countries can be found in the UNCTAD website
http://r0.unctad.org/ldcs/
3
levels to the EU in the recent past, plus 15 per cent. The quota will grow by 15 per cent every year, from 2,517 metric ton (husked-rice equivalent) in 2001/02 to 6,696 metric ton in 2008/09 (September to August marketing year).
Sugar Full liberalisation of EBA imports of sugar will be phased-in between 1 July 2006 and 1 July 2009 by gradually reducing the full EU tariff to zero. In the meantime, as for rice, LDCs raw sugar can enter duty free within the limits of a tariff quota, which will grow from 74,185 MT (white-sugar equivalent) in 2001/02 to 197,355 MT in 2008/09
(July to June marketing year). This excludes the LDCs of the ACP countries, as these are part of the ACP-EU Sugar Protocol.
Since the EBA initiative represents one of the special incentive arrangements within the EC’s GSP scheme, the corresponding rules of origin also apply here. Similar to the rules of origin, the SPS measures laid down in the agreement follow the guidelines of the GSP scheme, and thereby the WTO’s SPS agreement. With respect to the WTO’s TRIPs Agreement, the same applies to the protection of property rights. With respect to safeguard and withdrawal measures, the rules laid down in the GSP agreement apply.
3. THE EBA AND TRENDS IN TRADE WITH THE EU FOR BANGLADESH
The EBA aims to facilitate trade with LDCs in order to favour their development. The performance of this trade opening has been disappointing in the first years. Brenton (2003) and the USDA (2003) indicate that there is no evidence of increased exports to the EU. Of course, these reports only cover a period of two years since the EBA was introduced. One of the reasons for this lack of uptake is that, under the tariff lines newly liberalised, many LDCs did not export significantly anyway.
Bangladesh is, however, one of the countries which can potentially benefit most from EBA. As a matter of fact, another of the causes for the scant uptake of the EBA initiative is that many LDCs were part of the ACP group of countries already benefiting from preferential tariffs, thus rendering the benefits of EBA insignificant. Bangladesh, however, sees a significant improvement under the new conditions. This section will analyse the implications for the agricultural sector.
The implications and potential impacts for Bangladesh have been well documented in the study by Bhattacharya et al. (2004) Executive Director of the Centre for Policy Dialogue (CPD). The present study aims to complement rather than at reproduce Bhattacharya’s study results, which already presented an excellent picture of the EBA implications. However, the study was based on the potential of the EBA alone. The present paper will
draw from its results, but aims to move beyond EBA. The latest reform of the EU’s Common Agricultural Policy and the ongoing WTO negotiations will have important implications on world trade and the position of Bangladesh as an exporter to the EU and to the rest of the world.
Aware that it can rarely compete in the exports of bulk agricultural products, Europe is reorienting its agricultural sector. Support linked to the quantity of production is thus abandoned in favour of less intensive quality production. As a consequence, the EU will weaken its position as a major exporter in a number of basic products. The EU, however, will increase its competitiveness in some sectors, due to the price effect on inputs and the changes in the relative prices of products that the reforms will cause. A reform of the sugar regime will have strong implications for exporters to the EU with zero tariff preferential access, not as an export opportunity, but rather as a large revenue loss, as an increase in market access is linked to drastic cuts in the internal price of sugar and thus lowering benefits of trading with the EU. Without incorporating the CAP implications and the possible alternative WTO agreements, any study would under- or overestimate impacts for the countries with preferential access.
In order to reach any conclusion on future implications, however, one has to understand the present developments. This section will first analyse whether, on the basis of trade data, there are any indications that the EBA agreement has affected exports from Bangladesh to the EU in relevant tariff lines. This is based on agricultural trade figures for the years 1998, 2000, 2001, 2002, 2003 and, where available, 2004 data at the 6 digit level of the Harmonised System of Codes4; for some specific products 8 digit CN (Combined Nomenclature) codes are used. The selection of products is based on the main products exported by Bangladesh to the EU.
This analysis should indicate if there has been an uptake of the EU-EBA. The 1998 and 2000 figures will provide a picture of the pre-EBA trade situation for comparison. The changes will be compared to developments of trade partners in the region, with, with the exception of one, are not part of the EBA agreement: China (non-EBA), India (non-EBA, but part of the sugar protocol), Vietnam (EBA) and Thailand (non-EBA).5 Quantities
4
is an international multipurpose nomenclature which was elaborated under the auspices of the World Customs Organisation (WCO).
5
Countries like Myanmar and Indonesia have not been included because these suffer from trade disturbances due to political instability.
will be compared, and the value per unit of imports will be derived (cif price6) to compare the competitive position of Bangladesh.
The comparison should allow detecting any evidence that the EBA has affected export levels of Bangladesh to the EU, but also identifying changes caused by other factors, such as dollar price fluctuations. If non-EBA countries show similar export developments, an increase in export might well be based on other factors than the EBA. These comparisons are all to be interpreted with caution, as quantities and values exported also depend on a large number of factors, such as fluctuations in levels of production at any given year and differentials in quality. Nevertheless, agricultural products are often relatively homogenous, different value and quantity developments can give an important signal. A weakness of the analysis is that it is not possible to distinguish from the data between the imports under EBA, i.e. fulfilling the rules of origin requirements and exempt of duty, and those that are imported under duty. For agricultural raw materials this is generally not an issue, but for processed products this could often be important.
The products analysed are listed in Annex B. These are product categories under cereals (rice), vegetables, pastry preparations, vegetable textile fabrics (jute), sugar and poultry. Because of the tariff reduction scheme on sugar and rice until 2005, these two products have to be studied separately, and the analysis has to take into account the implications of the remaining price and quota rules. Therefore, these will be analysed after the overview of the results on other products.
3.1 EBA and Trends for HS 07 – Edible Vegetables and Certain Roots and Tubers Under the HS 07 Heading, Bangladesh has seen a substantial increase in exports of vegetables between 2002 and 2003 (see Figure 1). Vietnam shows an increase too but so does India. From this graphical result alone, it is difficult to infer whether the increase is due to Bangladesh starting to take advantage of the EBA facilities or not. However, the magnitude of the increase has not been matched in any of the other countries researched. In 2003 Bangladesh has increased its exports by 40 per cent in volume compared to the previous year. Table 1 shows the index.
6
Table 1: Bangladesh % Change Exports, index 2001=100
HS Heading 07 1998 2000 2001 2002 2003
Exports MT 78.26 85.59 100.00 90.40 140.13
Value € 000 79.24 93.43 100.00 90.14 113.20
Value US$ 000 99.19 96.35 100.00 95.18 142.98
Source: Own calculations based on Eurostat data.
In dollar terms, this represents an increase of 42 per cent in 2003 compared to 2001, and 55 per cent higher than in 2002. In Euro terms this is less, but it is due to a strong appreciation of the Euro against the US dollar. The time period is too short to attribute with certainty the change to the EBA regime, but there is a likely relationship if the performance is compared with trading neighbours.
The considerably more modest growth in export, or stagnation, of non-EBA traders indicates that the surge is unlikely to originate from the depreciation of the US dollar. China and India’s export growth, while positive, are not of a comparable magnitude. Between 2002 and 2003, India, China and Thailand have increased their exports to the EU by 11 per cent 4 per cent and 6 per cent respectively. Vietnam, which also falls under the EBA, has exported 16 per cent more to the EU in 2003 than in 2002, which also provides some evidence of EBA benefits, even if the performance is not comparable to that of Bangladesh.
Figure 1: Exports of Vegetables to the EU (volume and value in € and US$) Bangladesh 0 2000 4000 6000 8000 10000 12000 1998 2000 2001 2002 2003
exports ton Value € 000 Value US$ 000
China 0 50000 100000 150000 200000 250000 300000 1998 2000 2001 2002 2003
exports ton Value € 000 Value US$ 000
India 0 10000 20000 30000 40000 50000 60000 1998 2000 2001 2002 2003
exports ton Value € 000 Value US$ 000
Vietnam 0 1000 2000 3000 4000 5000 6000 7000 8000 1998 2000 2001 2002 2003
exports ton Value € 000 Value US$ 000
Thailand 0 50000 100000 150000 200000 250000 300000 350000 400000 1998 2000 2001 2002 2003
exports (10 ton) Value € 000 Value US$ 000
Source: Own calculations based on Eurostat database
Average exports for the periods 1998-2000 and 2001-2003 also show interesting developments. For the group of products under HS 07, Bangladesh has seen an increase between the two periods of 37 per cent and a US$ value increase of 26 per cent.
Apparently, there has been a shift in production in favour of garlic (HS 070320), fresh or chilled vegetables (HS 070990), leguminous vegetables (HS 071029) and a few other new exports, while other exports have declined. These three products make nearly 100 per cent of the exports in volume and 98 per cent of the export in value, distributed as follows: garlic (22%; 7%), Fresh and chilled vegetables (75%, 88%), leguminous vegetables (1% and 3%). The net effect over the period January to September 2004 is that while the volume of exports has slightly declined, the value has increased by nearly 14 per cent.
For garlic, the non-EBA countries listed above pay a quota bound tariff rate of 9.6 per cent, plus an additional €120 per 100 kg for any amount over the preferential quota (EU first come first serve tariff quota rate). For fresh or chilled vegetables, the rates vary on specific products ranging from 5 per cent in quota to over 13 per cent in out of quota. Leguminous vegetables have charges ranging from 10.9 per cent in quota to 14.4 per cent in out of quota.
3.1.1 Developments in the Garlic Market
It is interesting to note that Bangladesh only started exporting garlic to the EU in 2002, probably as a response to the EBA (see Figure 2). In terms of cif price, Bangladesh is competitive with China and Thailand (that interestingly stopped exporting to the EU in 2001). India, however, is still competitive even after tariffs (in quota). After a bad year in 2002, India has partially recovered its import share in 2003, which corresponds with a big fall in the cif price.
Figure 2: Garlic Exports to the EU
HS 070320 Garlic Exports to EU, 100 kg (China in MT)
0 5000 10000 15000 20000 25000 30000 1998 2000 2001 2002 2003 Bangladesh
China (in tons)
India
Thailand
Source:Eurostat database.
Table 2: Cif Prices in €/ 100 kg Garlic (HS 070320)
1998 2000 2001 2002 2003
Bangladesh n/a n/a n/a 52 50
China 67 66 76 78 61
India 82 63 67 54 34
Thailand 78 74 n/a n/a n/a
Tariff impact approx. (in quota)
Bangladesh 0 52 50
China 83 86 67
India 74 59 37
Thailand n/a n/a n/a
Source: Own calculations based on Eurostat database.
Nevertheless, Bangladesh has succeeded in increasing garlic exports from 0 to 1500 MT in two years. However, Eurostat data for 2004 indicate no imports from Bangladesh in 2004, while Indian imports have increased in 2003 undercutting prices of Bangladesh, although in the end of 2004 there has been a hike in the Indian price. What the results show is that though Bangladesh has apparently profited from EBA in the garlic market,
its position is not guaranteed. Other low-cost producers like India have the ability to undercut the producers of Bangladesh even under tariffs (the in-quota tariff).
3.1.2 Fresh and Chilled Vegetables
Fresh and chilled vegetables (HS 070990) are the main bulk of exports in volume and value. A large number of vegetables benefit in the EU from a considerable tariff protection. This is a set of products where the EBA can provide a clear advantage, but Bangladesh faces potential competition with some African LDCs and countries, such as Morocco, that enjoy preferential quota entry into the EU.
Of the Asian countries compared, Bangladesh is a leading exporter, and it has increased its exports considerably during the period 1998-2003. However, preliminary data for 2004 (until September) show a 2 per cent decline in imports, as compared with the same period of the previous year. Thailand is another large exporter, but its product composition and market characteristics are clearly different. The value per unit of import to the EU is twice the level of the other traders. Even at 8-digit CN disaggregation Thailand still shows cif prices double to those of Bangladesh. China’s and India’s exports are apparently closer substitutes with those of Bangladesh, and compete for similar markets at similar prices. Vietnam has higher prices despite exports in the same 8 digit CN categories as India and China, but the export performance is clearly weak for these products (Figure 3).
Figure 3: Exports of Fresh or Chilled Vegetables to the EU 100 kg
Fresh or Chilled Vegetables HS 070990
0 10000 20000 30000 40000 50000 60000 70000 1998 2000 2001 2002 2003 Bangladesh China India Thailand Vietnam
It is difficult to draw any conclusions on the link between the EBA and export performance. Bangladesh seems to be relatively price competitive in the fresh or chilled vegetables exports compared to its competitors, though China is a growing competitive threat7.
Table 3: Fresh or Chilled Vegetables (HS 070990), Cif prices in € per 100 kg 1998 2000 2001 2002 2003 Bangladesh 181 195 179 182 169 China 223 182 196 160 119 India 186 187 163 182 183 Thailand 364 408 407 402 362 Vietnam 318 340 356 310 291
Source: Own calculations based on Eurostat database.
3.1.3 Other Vegetables
Bangladesh has seen a resurgence of exports in leguminous vegetables, and other frozen vegetables such as beans and spinach, where there was no trade, or the trade had stopped for a few years. However, the cif calculations performed show no particular competitive advantage even with tariff differences for these specific products compared to the studied group.
Bhattacharya et al. (2004) discussed the possibility of export of dried fruits and vegetables to the EU. This is a very good market for the EU and able to offer a high value for these products based on their quality and marketing. Exporters in Bangladesh should study this avenue.
Table 4: New Trade or Trade Resurgence? Exports to the EU, 100 kg
HS codes and summary description 2000 2001 2002 2003
071022 – Shelled or unshelled beans 2 12
071029 – Leguminous vegetables 36 964
071030 – Spinach 72
071080 – Vegetables, uncooked or cooked in
water, frozen 91 300
071090 – Mixtures of vegetables, uncooked or
cooked in water, frozen 30
Source: Eurostat full description of HS is in Annex B.
7
Results for China have to be interpreted with care, as the Chinese alleged undervalued currency against the dollar improves their competitive position.
3.2 EBA and Trends HS19 Preparations of cereals, flour, starch or milk; pastrycook products
The paper by Bhattacharya et al. (2004) presents a potential for biscuits, as this product (HS19059045) has been traded by Bangladesh in the period covered by the study. However, Bangladesh has started exporting in 2003 in other areas of HS 19 where there were no exports before. There is a possibility that EBA, which has abolished the tariffs on the individual agricultural components of the products, is responsible for this effect (under the condition that rules of origin are complied with).
Figure 4: Exports of Pastry Products of Bangladesh, HS19
Bangladesh - exports HS 19 0 50 100 150 200 250 1999 2000 2001 2002 2003 Exports MT Value 1000$
Source: Eurostat database.
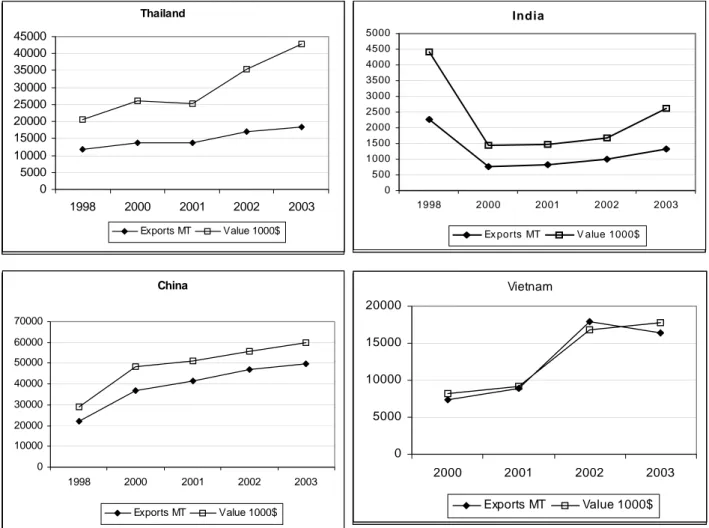
However, a comparison with other EU trading partners indicates that imports of these products to the EU are increasing for India and Thailand, and it is not obvious to attribute the change in imports to the EBA agreement. On the other hand, India is recovering slowly from a dramatic fall in exports before the year 2000, thus its exports are far behind the 1998 levels; while China has seen exports growth reducing and falling in a full in the of exports of in 2003, although their value has increased slightly. As Figure 5 shows, Vietnam like Bangladesh seems to have benefited from a fast increase in exports. The parallel rapid performance gives an indication that both countries are encountering better access opportunities.
Figure 5: Export Performance of Regional Competitors, HS 19 Vietnam 0 5000 10000 15000 20000 2000 2001 2002 2003 Exports MT Value 1000$ Thailand 0 5000 10000 15000 20000 25000 30000 35000 40000 45000 1998 2000 2001 2002 2003 Exports MT Value 1000$ China 0 10000 20000 30000 40000 50000 60000 70000 1998 2000 2001 2002 2003 Exports MT Value 1000$ India 0 500 1000 1500 2000 2500 3000 3500 4000 4500 5000 1998 2000 2001 2002 2003 Ex ports MT V alue 1000$ Vietnam 0 5000 10000 15000 20000 2000 2001 2002 2003 Exports MT Value 1000$ Thailand 0 5000 10000 15000 20000 25000 30000 35000 40000 45000 1998 2000 2001 2002 2003 Exports MT Value 1000$ China 0 10000 20000 30000 40000 50000 60000 70000 1998 2000 2001 2002 2003 Exports MT Value 1000$ India 0 500 1000 1500 2000 2500 3000 3500 4000 4500 5000 1998 2000 2001 2002 2003 Ex ports MT V alue 1000$
Source: Eurostat database.
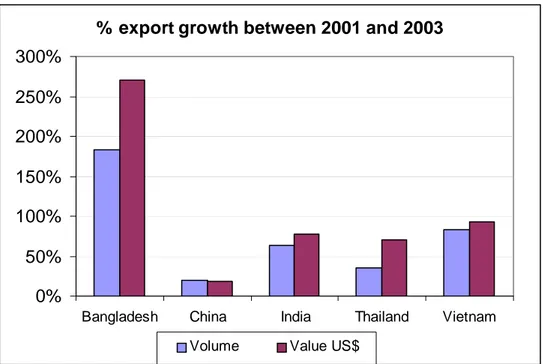
Between 2001 and 2003, the rates of growth of posts products exports to the EU are proportionally higher in the two EBA countries and remarkably so for Bangladesh (Figure 6), with a growth of 170 per cent in volume and 250 per cent in value.
Figure 6: Export Growth of Pastry Products, HS19 % export growth between 2001 and 2003
0% 50% 100% 150% 200% 250% 300%
Bangladesh China India Thailand Vietnam
Volume Value US$
Source: Own calculations based on Eurostat database.
It is interesting to analyse the volume-value relationship. From a proportional point of view, Thailand has the greatest increase in value, which indicates the importance of product differentiation, marketing and quality differentials. This will be discussed later in the paper.
A competitiveness analysis for such products is difficult to undertake, as product characteristics are important in the determinant of the demand and price of processed products (see the Thailand’s case). However, a quick look at the cif price differential clearly shows that amongst these trading partners Bangladesh is in a good competitive position, with the exception of pasta products and tapioca (HS190230 and HS190300).
Table 5: Cif Price Comparison HS 19 products, 2003
HS code Bangladesh China India Thailand Vietnam
190120 Mixes and dougs of flour 151 200 193 320 117 190211 Uncooked Pasta containing eggs 49 98 228 103 40 190219 Uncooked Pasta, not containing eggs 130 75 260 119 64 190230 Pasta cooked 277 93 136 174 91 190300 Tapioca and similar 132 88 87 61 131 190410 Cereal food preparations 112 118 184 242 65 190420 Cereal unroasted food preparations 223 78 198 242 61 190490 Cereals in grain or flake form 47 203 49 270 127 190510 Crispbread 97 - 254 583 - 190531 Sweet biscuits, waffres, etc. 65 267 141 305 210 190540 Sweet biscuits 188 175 347 160 190590 Toasted bread, rusks 130 127 182 324 98
Source: Own calculations based on Eurostat database. For precise code definitions refer to Annex B
3.3 EBA and Trends for Rice
Rice imports under the EBA are still restricted until 2009, but in the meantime duty-free access is granted to LDCs under a tariff quota, which is based on the highest exports in the recent past increasing by 15 per cent a year. Thus, LDCs would be expected to have increased exports to the EU during the period 2001-2004. The increases in imports to the EU would thus be 32 per cent higher in 2003 and 54 per cent in 2004 if fully utilised (in husked rice equivalent). It is difficult to estimate what export share of the tariff quota should be used by Bangladesh, because it did not export to the EU before the EBA, with the exception of a limited amount of milled rice.
Figure 7: Rice Exports from Bangladesh to the EU in 2000-2003 Rice exports 0 1000 2000 3000 4000 5000 6000 2000 2001 2002 2003 100 kg 0 50000 100000 150000 200000 250000 Rice 100kg Value $
Source: Eurostat database.
Figure 7 shows a remarkable increase in rice exports from Bangladesh to the EU and thus a clear trade diversion towards the EU between 2002 and 2003. Other non-LDC neighbouring exporters, however, also experience an increase (see Figure 8). In absolute value, the Indian and Thai exports outstrip Bangladesh by far, but for India it is actually a recovery from a drastic fall in exports at the end of the 1990s.
Like in the previous case, in non-EBA countries value increases more in proportion than volume. In both LDCs the increase in value is less than proportional to export volume growth, which indicates that the exports are of lower export value, either because the rice varieties are of lower quality or because marketing is weak. Processing and packaging are key ingredients to the value of products in the EU. The performance of higher prices regional competitors indicates that low prices alone are a misleading indicator for higher competitiveness. It is also important to interpret with caution the differences in magnitude of exports in terms of per centages. These have to be weighted by the actual volume and value of the changes in exports of Thailand and India. Large changes in exports of Bangladesh and Vietnam in per centages represent only a fraction of the changes in flows of the Thai and Indian export market.
Figure 8: Percentage Change in Rice Exports to the EU in 2002-2003 -20% 0% 20% 40% 60% 80% 100% 120% 140% 160% 180% B angl ades h Ch in a In d ia Th a ila n d Vi e tn a m Volume Value US$
Source: Own calculations based on Eurostat database.
One conclusion that can be indirectly implied from the data is that there is a weakness in the processing and packaging sector in Bangladesh. This finding is confirmed by Bhattacharya et al. (2004). There is a need not only to invest in seed quality to improve production, but also a strong need to upgrade the quality of marketing and processing. Not only packaging quality, for presentation, but also such quality aspects as vacuum packaging to preserve the product’s quality are absent, denting the value of the exported products. This is one reason value of exports is higher in more developed markets and should be addressed seriously in a strategy of export promotion.
Figure 9 presents the composition of exports from Bangladesh to the EU by rice variety. There is a clear new market being developed for rice. However, the composition of the exports by variety is not stable, which may be based on prices. The comparative prices between the countries analysed in this study suggest a possible relationship between the export volumes by variety and their price in the given year. In such a short timeframe, however, it is not possible to make any strong assertion in this respect, since, as mentioned earlier, other factors play an important role.
Figure 9: Disaggregated by Rice Variety - Exports from Bangladesh to the EU, 100 kg 0 500 1000 1500 2000 2500 3000 3500 4000 4500 100 kg 1998 2000 2001 2002 2003 100610 100620 100630
Source: Eurostat database.
HS100610 rice in the husk, ‘paddy’ of rough; HS100620 – Husked or brown rice; HS100630 Semi-milled or wholly milled rice, whether or not polished or glazed (no broken rice exports to the EU).
3.4 EBA and Sugar
The EU sugar policy provides EU producers with very high price support combined with a regime of production quotas to limit excess production and the need for export subsidies. The intervention price of sugar in the EU stood at € 632 per ton in 2004, which is more than three times the average world price. The restrictive quota controls ensure that sugar factories sell to the market at a price slightly higher than intervention, € 655 per ton in 2004. The quota system is based on three quotas: A, to cover domestic consumption; B, determining the amount of sugar that could benefit of export subsidies; and C, which represents the excess over A and B that can be sold on the world market without export subsidies.
Trading partners have not universally challenged the policy, because the EU grants duty-free import quotas to major sugar producers of the African, Caribbean and Pacific (ACP) countries, India and other countries through bilateral agreements (see Huan-Niemi and Niemi (2003) for a description of the agreements). In recent years, EU internal production exceeded consumption by 1 million metric ton, thus it needed to export 2.6 million metric ton (adding an equivalent amount from the preferential sugar imports) through the B and C quotas.
The EU has not yet liberalised the sugar market for LDCs, as described in section 2. In order to compensate for the delay in the full liberalisation of sugar, raw sugar can be
exported duty-free by LDCs to the EU market within the limits of a tariff quota, which will be increased each year by 15 per cent from 74,185 metric ton (white-sugar equivalent) in 2001/2002 to 197,355 metric ton in 2008/2009. The increase in LDCs’ sugar imports will, however, not increase the EU import of sugar, as a tariff quota will simultaneously decrease the imports of sugar from the remaining sugar protocol signatories. Only 13 membersout of the 49 LDCs were eligible to export raw sugar under this protocol.
To allow the EU to adapt to a more open market in 2009 and prepare for probable cuts in the WTO of tariff barriers, the EU is preparing to reform the policy between 2006 and 2009. As a consequence, despite the delayed implementation of the liberalisation process of the sugar regime, the benefits from the present arrangement are likely to be considerably superior for the LDCs and Bangladesh then after 2009. More details of the consequences of a reform of the policy are discussed in section 4.
Since EBA was introduced, Bangladesh has the possibility of exporting sugar to the EU under a quota restriction (cane sugar for refining CN17011110) and benefit from the high EU internal price. However, Bangladesh has difficulties in taking full advantage from this possibility. According to the Association of Professional Sugar Traders of the EU8 (ASSUC, 2001), Bangladesh faced a problem, as it only produced enough refined sugar for domestic consumption. Thus, exporting requires either increasing production or using imports to substitute the sugar exported, paying attention not to violate the rules of origin (see section 6.1).
However, this is not the only problem. Sugar trading, of course, requires buyers in the EU. It is only in 2004 that Bangladesh managed to access the EU by exporting sugar to France - more than 9,000 metric ton were imported during the year. The process also requires agreements on the attribution of the sugar quota amongst LDCs. Furthermore, other trading barriers, such as the rules of origin, also play a role in delaying the process. Certainly, the EBA also brings another benefit: Bangladesh no longer pays a duty for processed products that contain sugar, as long as this sugar (like for other ingredients) follows the rules of origin. In fact, the pastry products can enter free of the tariffs formerly calculated based on their composition.
8
ASSUC : Association des Organisations Professionnelles du Commerce des Sucres pour les
3.5 Other Trade Opportunities of Non-EBA Affected Sectors
Bhattacharya et al. (2004) indicate that other important sectors for further trading with the EU, in which Bangladesh is competitive, are the jute and poultry meat markets. This section discusses these markets based on the latest developments and projections of the EU internal market. Some opportunities for organic products are also presented.
3.5.1 The Jute Export Market to the EU
The value of jute based products reached US$ 43 million in 20039. Jute was already benefiting from 0 tariff rates under the GSP, thus, the EBA did not affect it directly, but this sector is considered as having export potential and deserves some attention.
However, the EU has halved its total imports of jute from the world market since the year 1998 (Table 6 – volume and value). Demand has fallen radically. Exports from Bangladesh to the EU have consequently also fallen in the last years, from around 78000 metric ton and per year between 1998-2000 to just under 62000 metric ton in 2003. The value of exports fell from US$ 59.7 million in 1998 to just 43.2 million US$ in 2003; thus, a higher fall in the value of exports, indicating either a fall in the entry price or a shift in the composition of exports to lower value products. One of the major competitors in the market is India. This country has also seen exports fall by a large amount from 80,000 metric ton to just 55,000 metric tons. There is, however, an important difference between the two countries. Figure 10 shows that despite the larger fall in exports to the EU, the per cent loss in value is lower for India.
9
Table 6: Jute Exports to the EU from Bangladesh Exports to the EU - Quantity 100 kg
1998 2000 2001 2002 2003
530310 – raw or retted 50998 46224 96971 90446 99389 530390 – processed but not spun 1661 2897 69 1081 2737 530710 – single yarn of jute 179222 183189 136286 118322 80000 530720 – multiple folded or cabled yarn 346692 354348 379732 388819 347112 531010 – woven fabrics unbleached 202787 148091 159426 93326 87790 531090 – woven fabrics bleached 3150 6005 4111 2300 1569 Total 784510 740754 776595 694294 618597
cumulative % change 1998 to 2003 -21 %
Exports to the EU – Value (US$ 1000)
1998 2000 2001 2002 2003
530310 – raw or retted 1771 1856 2814 3965 3964 530390 – processed but not spun 72 95 9 67 162 530710 – single yarn of jute 15223 14762 10526 8999 6410 530720 – multiple folded or cabled yarn 25966 24973 26598 27940 24090 531010 – woven fabrics unbleached 16448 11696 13438 8059 8449 531090 – woven fabrics bleached 231 505 192 254 164
Total 59712 53886 53577 49283 43239
cumulative % change 1998 to 2003 -28% Source: Eurostat database. Please see Annex B for exact description of HS code.
Figure 10: Volume and Value % decline between 1998 and 2003
-35% -30% -25% -20% -15% -10% -5% 0% BGD INDIA Volume Value
Source: Eurostat database.
A closer look at the composition of the exports of jute-based products shows that Bangladesh relies more heavily on basic raw material exports, while India produces more valuable woven jute products. In 2003 the share of higher value woven jute and
vegetable-based fabrics (HS 531010) in the exports to the EU reached over 33 per cent of the volume and 42 per cent of the value, while in Bangladesh the shares were 14 per cent and 19 per cent respectively. India’s exports of raw yarn products make less than 1 per cent of exports, while for Bangladesh the share is 16.5 per cent, affecting the overall value of the exports. In fact, Bangladesh has not only reduced exports, but increased exports of cheap raw jute HS 530310, while production of woven fabrics of jute HS 531010, which is worth twice the value and for which demand has not fallen in the EU, has declined sharply. Given the trends in India and Bangladesh, the future of jute as an export product to the EU is uncertain. The possibility of improving the quality and the value of jute products to reduce the decline in the value of exports should be considered. 3.5.2 Prospects for the Poultry Sector
Apart from jute, Bhattacharya et al. (2004) consider that, due to its competitive prices, the poultry sector of Bangladesh could develop to enter the EU market. In fact, poultry consumption in the EU is expected to increase in the future. The European Commission expects that internal production will also increase, but some increases in imports of frozen poultry are also expected. There is, thus, a possibility for Bangladesh to develop poultry exports to the EU. However, the rate of demand increase for poultry meat into the EU is slowing down.
Table 7: Poultry meat projection; (in million metric ton)
2001 2002 2003 2004 2005 2006 2007 2008 2009 2010 Production (gross) 8984 8938 8870 8951 9066 9231 9336 9429 9501 9572 Import of live animals 1 1 1 1 1 1 1 1 1 1 Export of live animals 5 6 5 5 5 5 5 5 5 5 Production (net) 8980 8933 8865 8947 9062 9227 9332 9425 9497 9568 Imports 741 694 694 700 720 732 740 745 748 748 Exports 964 1089 1002 1000 1000 1000 1000 1000 1000 1000 Stock changes 45 0 0 0 0 0 0 0 0 0 Consumption 8712 8538 8558 8647 8782 8959 9072 9170 9245 9316 Source: European Commission (2003).
Preparing the sector to export to the EU can also be extremely costly and difficult to achieve, as the rules governing food imports are increasing in complexity, especially the phytosanitary regulations. There is, however, another positive prospect for exports: It is likely that under the future WTO round export subsidies may be abolished. In this case, EU exports may lose their competitive edge in other poultry markets, which may become possible outlets for Bangladesh.
3.5.3 Organic Produce
The market for organic products has developed considerably in the EU and there is potential for importers to expand in this sector. The value of the market in the EU has doubled from 1997 to 2000 and the structure of the market is also changing. From a market predominately held by small producers with local direct marketing systems, organic agriculture is becoming a mass production business controlled by large corporations. The growth of the organic market is attracting the attention of large corporate food producers and retailers, which until recently had little interest in these products. In Europe and the US this is starting to have a strong impact (Ikerd, 1999). In Britain, large companies have entered the production and retail business of organic foods and have recently started a price competition (UK House of Commons report, 2001). Retail distribution in the UK is dominated by a relatively small number of large multiples including Tesco, Sainsbury, Waitrose and Safeway, all of which are active in the organic sector. Sainsbury claims to account for 25 per cent of total organic retail turnover.
Large companies, such as Asda and Iceland are aiming to put together an affordable range of organic products, which retail at a minimal extra cost compared to the non-organic alternative (USDA, 2000). A similar development is being observed in the Benelux countries (USDA, 2001). The share of organic produce imported to the EU has increased, as demand has been outstripping domestic supply. Thus, there is scope for Bangladesh to develop organic produce as providers for the large food chains in Europe. However, it has to be said that controls and labelling for organic produce are stricter and more costly than for conventional products. The only avenue for producers in Bangladesh to manage to penetrate this market is to have clear links to the large retailers and build up a capacity to supply the products following their strict standards.
3.6 Conclusions on Post-EBA Trade Performance
Bangladesh has successfully started diverting trade towards the EU for garlic, vegetables, pastries, rice and sugar, as expected by Bhattacharya et al. (2004). Bangladesh is clearly a rather small regional exporter facing large competitive neighbours: China and India, which are able to compete regardless of not being LDCs and not benefiting from the EBA. Undoubtedly Bangladesh has very competitive prices compared with average international prices for food products, but this is no reason for complacency.
Results indicate that most exports in agriculture consist of basic bulk production, susceptible to any competitive pressure by other traders. The benefits of improving product quality and distinctive trademarks can be seen in Thailand’s strong export value under apparently ‘uncompetitive’ prices, which indicates successful product
differentiation. A strategy on these lines requires extensive planning and investment. Thailand has performed a successful promotion campaign, creating distinctive Thai product features. It has managed to present Thai food products to European consumers as clearly distinct to other regional foods and introduced an image of sophistication and quality. This provides for price premia and market demand stability based on consumer loyalty.
Imports to the EU are not only a matter of open markets and no tariffs. In fact, after the EBA was agreed, not only imports from LDCs have not increased, but have even declined in aggregate. The lack of reaction in agriculture is an indication of the difficulties accessing the EU markets as well as complying with rules of origin and SPS, which are becoming increasingly stringent. Producers also need to establish contacts in the EU and active promotion is also of particular importance.
4. REFORMS OF THE COMMON AGRICULTURAL POLICY AND FUTURE TRADE IMPLICATIONS
The European Union’s Common Agricultural Policy (CAP) has changed fundamentally in the last fifteen years. Originally, the CAP supported its agricultural sector through a system of high price support and high border tariffs. The consequences have been chronic excess and increasing costs for storage, destruction or export restitutions. The EU spent a large budget financing these actions. Export subsides had also well documented negative impacts on the world market, driving world market prices down, in particular for cereals, beef and milk products. Only an intricate system of quotas maintained the stability of the milk and sugar production.
This support system came under an increasing attack not as by trading partners, but also by a number of EU pressure groups. It was clear to the EU policymakers that the CAP price support policy was not only inefficient in targeting farm incomes, due to the effects in input prices and land values, but was also very ineffective in protecting the actual and rapidly developing interests of EU citizens and politicians. Without any further need for policy intervention to foster productivity, the EU has shifted its concerns to environmental, cultural and food safety issues. To address this new set of objectives a long process of reforms started, debuting with the MacSharry reform in 1992. The reforms gradually shifted price support to direct payments for farmers and specific support for environmental and food safety services under the heading of rural development.
After several rounds of reforms, the EU has managed to reduce many of the problems of the original system. The excessive stocks of production were successfully reduced. The price gap between the EU internal support price and the world market prices for most products has fallen considerably, and as a consequence so have export subsidies. In 2003, theseaccounted for €3.4 billion (US$3.8 billion10) compared to approximately ECU11 10 billion (approx. US$ 8.5 billion) in the early 1990s.12 Production decisions, however, were still affected by the coupled nature of the support payments to farmers, as the share of land devoted to production and the kind of product were largely determined by the policy. This is the reason for the categorisation of EU direct payments in the blue box13 of the WTO.
In June 2003 the EU agreed on the so-called Mid-term Review (MTR), which consists of a further fundamental reform of the CAP. This reform has multiple aims: a) to adapt the sector: to future challenges arising out of the combined requirements to enlarge the EU to ten new member states; b) to keep expenditure under the self-imposed ceiling to agricultural expenditures agreed between member states; c) to increase the rural development support; d) to comply with the WTO GATT agreements; and e) to prepare for an elimination of the export subsidies.
The reforms are based on the following set of actions: 1. Decouple link between support and production.
2. Modulate the level of direct payments (direct payments should be shifted gradually to payments linked to specific services for rural development, food safety and the environment).
3. Increase the support for rural development measures aimed at improving product quality and safety and at protecting social and environmental aspects of the EU’s agriculture and rural areas.
10
Using the average exchange rate of 2003, 1.13 US$/€
11
The Euro did not exist in 1992, the precursor of the €, the ECU (European Currency Unit) based on the relative weights of the European Union 12 member states is used. The US$/ECU exchange rate oscillated around 0.85 US$/ECU.
12
The export subsidy value of the EU for the year 2005 will, however, be affected by the fall of the US$, as EU products loose their comparative value in the word market.
13
The WTO regime categorises agricultural support policies according to their distortionary influence on production and trade: green box (none or very limited), blue box (indirect influence), amber box (highly distortionary)
While these reforms are mainly driven in response to internal needs of the EU, these have considerable implications on the future position of the EU as trading partner and will have an implication on the WTO negotiations in progress.
The MTR, however, is not the final reform of the EU policy. More are to come in particular, because the MTR does not cover all subsidised agricultural products. In April 2004 the EU agreed on a further reform for tobacco, hops, olive oil and cotton sectors. In the immediate future a reform of the sugar policy will be necessary, in particular, to allow the EU to fulfil its pledge under the EU-EBA to allow tariff free entry of sugar to the EU for the LDCs in 2009.
However, the impact of the CAP reform itself is relative, as it does not yet eliminate export subsidies or reduce tariff barriers to other importers. Thus, the competitiveness of Bangladesh vis-à-vis EU products in the world market will largely not be affected. The possible banning of export subsidies in the next WTO round will have impacts as it will limit the ability of the EU to undercut competitors’ prices in other markets.
4.1 Implications of Decoupling
The most important aspect of these reforms is the EU’s commitment to decoupling support from production, which requires reduction of distortive price support levels and the payment of direct subsidies independently from production decisions. The decoupling of support is a prime prerequisite to be able to eliminate export subsidies in the future. With the reduction in customs duties, the EU has no other solution than to ensure that internal prices become competitive in the world market. With the latest reforms, the EU hopes to be able to eliminate the last barrier towards the abolition of the export subsidy mechanism.
Decoupling is important for trading partners. First, because this will considerably reduce trade distortions, as production surpluses will no longer be driven by subsidies, and because it will allow the EU to open the market to foreign competition while maintaining the support for farmers. Second, decoupling will affect EU production decisions in altering internal production and import demand. EU production levels of certain agricultural products will be affected, as price support fades out. The production may fall as prices become less attractive for some products; others, however, will increase, as relative prices change.
The CAP reform agreement of June 2003 aims at full decoupling but allows member states to retain a partial decoupling if requested. However, full decoupling should cover at least 75 per cent of payments in the arable sector, and at least 50 per cent in the beef and
sheep sectors. This decoupled payment or “single farm payment” will be based on the average former direct payments claimed over the three-year reference period of 2000-2002. It will be paid by eligible hectare of land, and the maximum eligible land is fixed. These entitlements can be sold or transferred between farms as long as the recipient has enough entitled land. All payments will be conditional on compliance to environmental acreage set-aside rules.
4.2 Impacts of CAP Reform for Trade
As mentioned earlier, the reforms will have only an indirect effect on trade; this is mainly due to internal changes in production as relative prices change. Import competition as such is not relevant, as the tariff barriers are not affected by the policy itself, and export subsidies still give a market guarantee to producers. Nevertheless, production impacts will affect import demand, and the European Commission (2003) has estimated the impacts on EU production and imports from the new reforms for some key agricultural products. This section analyses the implications of the reforms in areas in which Bangladesh has major trade interests. It also discusses the implications of expected future reforms of the sugar policy.
4.2.1 Rice
Of particular importance for Bangladesh are the reforms in the rice sector. The price of rice is being cut by 50 per cent and replaced by decoupled payments. The immediate effect is that EU rice becomes more price competitive in the EU relative to imported rice, but production is also expected to fall, cancelling out the trade effect (see Table 8). Table 8: Total Rice Balance Sheet in the EU-15, 2001–2010 (million metric ton)
2001 2002 2003 2004 2005 2006 2007 2008 2009 2010 Usable production 1.50 1.58 1.50 1.41 1.44 1.45 1.47 1.49 1.50 1.53 Consumption 1.80 1.87 1.91 2.18 2.21 2.23 2.27 2.31 2.34 2.36 Imports 0.56 0.57 0.60 0.53 0.79 0.81 0.84 0.86 0.86 0.86 Exports 0.26 0.26 0.24 0.03 0.02 0.02 0.03 0.03 0.02 0.02 Beginning stocks 0.59 0.57 0.59 0.55 0.27 0.28 0.28 0.28 0.29 0.29 Ending stocks 0.57 0.59 0.55 0.27 0.28 0.28 0.28 0.29 0.29 0.30 of which intervention 0.35 0.42 0.38 0.00 0.00 0.00 0.00 0.00 0.00 0.00 Source: European Commission (2003).
The EBA agreement excludes rice from total liberalisation until 2009, while the rice sector undertakes the reform process and adapts. Bangladesh and other LDCs will,
however, be able to supply the EU under a duty-free preferential quota tariff (see section 2).
The European Commission estimates that consumption would see an important increase, while internal production would initially contract and then recover slowly. The reform would induce a 14 per cent increase in consumption, followed by an annual increase of 1-2 per cent. Thus consumption in 1-2009 would have risen by 31 per cent. Import demand increases would exceed this, as production is expected to fall and not recover the 2001 levels until 2009. The Commission quantifies the increase in imports from 560,000 metric ton in 2001 to over 800,000 metric ton in 2009.
Important to note is that EU exports practically disappear, which indicates that the EU will retreat from foreign markets opening other opportunities for other exporters. For rice there is therefore, the double opportunity to increase exports to the EU and to access the markets formerly covered by EU exports. The biggest importers of EU rice are in the Middle East and North Africa (Lebanon, Turkey, Saudi Arabia, Syria, Israel, Algeria and Jordan), with 97 million metric ton of EU rice imported in 2003. Switzerland is also a large importer, with 17 million metric ton of EU rice imported in the same year. These markets represent potential rice exports destinations now and in the near future.
4.2.2 The Future Reforms of the Sugar Sector
The sugar policy is based on high price support combined with a regime of production quotas (see section 4.2 for the description) and has remained practically unchanged for 40 years. Now, the European Commission has already published a proposal for the reform of the sector in July 2004, which is under negotiations in the Council of Ministers of the EU. The EU is presently a major participant in the world sugar market, being one of the top producers, importers and exporters in the world. The reform of the EU sugar regime will affect not only the EU member states but also countries that are associated with the EU through preferential, regional and multilateral trade agreements. In the EU sugar regime, the unique features of the trade concessions are that sugar under preferential import quotas can enter the EU market duty free, and the price paid for sugar equals to the high EU price for sugar.
The proposed reform of the sugar policy is not a full liberalisation of the sugar market in Europe, even if it proposes to eliminate import quotas by 2009. It reduces the price over the years from 2005 to 2008 to per metric ton €421 per metric ton, which is still double the world price. The price level for imports of raw sugar would decline to €329 per metric ton by 2009, nearly halving the value per ton of imports for the countries benefiting from
the sugar protocol and EBA. This is accompanied by the internal production quota reduction, calculated based on estimated consumption and expected imports, while remaining import tariffs for non ACP and LDCs would have to remain high even after a WTO agreement. Thus, EU production would fall from today’s excess of 1 million metric ton to a deficit of 1.4 million metric ton by 2009, which would match the ACP-LDC import quota and balance the market, as import quotas increase during the reform period and are then abolished.
However, after 2009, the price level, which would still be above world prices, can only hold if the countries importing into the EU without tariffs, LDCs, certain ACPs and India, do not have the potential to flood the market. In this case, however, the EU will always have the ability to impose the EBA clause of excessive imports compared to historical levels to those LDCs which have increased imports strongly. Similar safety clauses are expected for other importers. However, the situation gets really problematic if any further reduction of tariff barriers through WTO opens the door to imports from other countries. A combination of a weak dollar exchange rate and lower tariffs could make the EU a destination of sugar imports from other countries. The future stability of the sugar policy is a balancing act, which depends on the accurateness of the expected imports of the EU by 2009; the calculations are based on the European Commission (2001b) estimates. For the importers under free quota, the present arrangements create large financial benefits. It is no surprise that ACP countries now are requesting the EU not to open up the sugar market at this speed. Now, Bangladesh also participates in the request to continue benefiting from similar conditions like the ACP countries, and higher prices for a longer period of time. The EU is simultaneously facing a very damaging challenge by the WTO. The EU benefited from an agreement which allowed it to export under subsidies the equivalent amount of sugar imported by developing countries that benefit from preferential access under the sugar protocol, which now is extended to all LDCs. These export subsidies needed not be declared and were not subjected to the export subsidy limits agreed at the Uruguay round. This arrangement is now being challenged by the WTO, and if successful, the EU would encounter a very difficult situation, as it is already breaking the export subsidy limits in the absence of these additional exports. Furthermore, the WTO is challenging the value of an estimated indirect cross-subsidisation of sugar exported under the C quota in the export subsidy commitments for the EU.
The pressures on the sugar policy to reform are described in detail by Huan-Niemi and Niemi (2003). The EU has difficulties already keeping to its present WTO commitments on export subsidies. Maintaining the benefits for the LDCs and sugar protocol signatories,