Competitive in the lab, successful in the field?
Lars Ivar Oppedal Berge, Kjetil Bjorvatn, Armando Jose Garcia Pires,
Bertil Tungodden
Abstract
A number of lab experiments in recent years have analyzed people’s willingness to compete. But to what extent is competitive behavior in the lab associated with field choices and outcomes? We address this question in a setting of entrepreneurship, where we combine lab evidence on competitiveness with field evidence on investment, employment decisions, profits, and sales as measures of competitive choices and successful outcomes. We find strong evidence that competitiveness in the lab is positively associated with competitive choices in the field, and weaker but suggestive evidence of a positive link to successful field outcomes. Other relevant cognitive skills and non-cognitive skills measured in the lab, including risk- and time preferences and confidence, are less consistently associated with the field variables. Our findings thus suggest that the willingness to compete in the lab identifies an important entrepreneurial trait that shapes the entrepreneur’s field choices and to some extent also field outcomes.
Key words: Lab, Field, Competitiveness, Entrepreneurship. JEL Classification: O12, O16, O17, O55.
Berge: Norwegian School of Economics (NHH), Bergen, e-mail: lars.ivar.berge@nhh.no. Bjorvatn: Norwegian School of Economics, Bergen, e-mail: kjetil.bjorvatn@nhh.no. Garcia Pires: Centre for Applied Research at NHH (SNF), e-mail: armando.pires@snf.no. Tungodden: Norwegian School of Economics, and Chr. Michelsen Institute, Bergen, e-mail: bertil.tungodden@nhh.no. The study was organized by The Choice Lab and financed by grant 204691 from The Research Council of Norway. A special thanks to Juda Lymai, Maria Frengstad and Sheena Keller who organized the lab sessions. We would also like to thank two anonymous referees for extremely useful comments and suggestions.
1. Introduction
There is a growing literature studying competitive behavior in the lab, but little is still known about how competitive behavior in the lab is associated with field choices, and even less is known about how it is associated with field outcomes.1Buser et al.
(2014) and Zhang (2012) study secondary school students and demonstrate that competitive choices in the lab are associated with entry into competitive study profiles and exams. These studies do not consider field outcomes, even though it is clearly important to understand whether the students made the right educational choices. Clearly, choosing to compete is not necessarily a winning strategy, and therefore, ultimately, we would also like to know whether competitive behavior in the lab maps into successful outcomes in the field.
Our study contributes to fill these gaps in the literature by studying the association between competitiveness in the lab and field variables in a setting of entrepreneurship, using a group of small-scale business owners in Tanzania as subject pool.2 This sample is attractive for studying the association between the lab
and the field for two reasons. First, business profit is arguably a relevant measure of a successful field outcome. Second, small-scale entrepreneurs are typically decision makers in their businesses, implying that entrepreneurial traits such as willingness to compete are likely to have direct implications for business choices and outcomes. We use investment and employment decisions as indicators of competitive field choices, as these may be used to give a firm a competitive advantage relative to other firms (by increasing capacity and lowering marginal costs), and business profits and sales as the key measures of entrepreneurial success. These field variables were collected from the entrepreneurs over a period of two years.
The entrepreneurs in our study also took part in a lab experiment where we measured both cognitive skills and non-cognitive skills, including the willingness to compete, risk- and time preferences and confidence. Our main focus in the present analysis is the extent to which the willingness to compete in the lab is associated with field choices and field outcomes, even when we control for cognitive skills, other non-cognitive skills, and background variables. The study also allows us to shed light on the association between these other lab variables and field choices and
1 Key contributions to the experimental literature on competitiveness include Niederle and Vesterlund
(2007), Booth and Nolen (2012), Flory et al. (2010), Gneezy et al. (2003, 2009), Gneezy and Rustichini (2004), and Healy and Pate (2011). See also Fortin (2008), who shows that individuals who self-report being more competitive have higher wages and earn more and Örs et al (2008), who find that women perform worse than men in a competitive setting, but outperform men in a less competitive setting. See Levitt and List, (2007a,b) and Falk and Fehr (2003) for discussions of the external validity of lab experiments.
2 On the determinants of entrepreneurship more generally, see Becker (1975), Lazear (2004, 2005),
Heckman et al. (2006), Hall and Woodward (2010), Vereshchagina and Hopenhayn (2009), Read and van Leeuwen (1998), Doepke and Zilibotti (2013), and Acs et al. (2005).
outcomes, and may thus inform us about the relative importance of competitiveness preferences in understanding the behavior and success of small-scale entrepreneurs in a development context.
Our study shows that (i) there is a strong and robust association between competitive behavior in the lab and investment and employment choices in the field, (ii) that entrepreneurs who compete in the lab tend to have higher profits than those who do not compete, and (iii) that willingness to compete is the entrepreneurial characteristic that is most consistently associated with competitive choices and successful outcomes; other cognitive and non-cognitive skills have less consistent explanatory power.
A number of other important studies have shown that risk- and time preferences measured in the lab are strongly associated with field behavior. Sutter et al. (2013) show this for health, savings, and conduct at school, using a of a sample of children and adolescents, and Dohmen et al. (2011) and Fisher (2010) show that risk preferences in particular are strongly associated with career choice.3 Our study
differs from the previous studies in two important ways. First, by focusing on small-scale entrepreneurs in a development context, we consider a very different sample than all previous studies. Second, these previous studies did not focus on competitiveness preferences, and thus we do not know whether the earlier results would have been sensitive to the inclusion of a measure of the willingness to compete. These differences may partly explain why we find less of a role for risk- and time preferences in explaining field behavior than the earlier studies.
The rest of the paper is organized as follows. In the next section, we introduce the data from the lab and from the field. In section 3, we present the results from our study. In section 4, we draw our main conclusions.
2. Sample and data
Our sample consists of 207 small-scale entrepreneurs in Dar es Salaam, Tanzania, all members of one of the leading microfinance institutions in the country, PRIDE Tanzania. Most of them are involved in small-scale commerce (running a small kiosk, having a stall at the market) or different sorts of service activities (hairdressing, small restaurants), with a few also involved in light manufacturing (tailoring, carpentry, brick making) or agriculture. They are organized in loan groups of five entrepreneurs, who are jointly responsible for each other’s loans in the microfinance institution. There are 143 loan groups represented in our sample. The entrepreneurs formed part
3 A number of other interesting studies relating lab experiments on social preferences and trust and
field behavior include Ashraf et al., 2006; Benz and Meier, 2008; Dohmen and Falk, 2011; Karlan, 2005; Meier and Sprenger, 2010, Jakiela et al., 2010).
of a larger randomized control trial on entrepreneurship promotion, involving more than 600 subjects, documented in Berge et al. (2014). Half of the entrepreneurs in our sample had randomly been offered business training as part of the larger research project (the training program was completed in January 2009), and all of them subsequently received a 100 000 Tanzanian Shillings (TZS) business grant (around 80 USD).
The lab data are from March 2009. The entrepreneurs in our sample were randomly selected to take part in the lab experiment among all the entrepreneurs involved in the larger randomized control trial. The field data are from two survey rounds that we conducted in June-July 2009 and June-September 2011, where we visited all the entrepreneurs at their business premises. We managed to interview 207 out of the 211 entrepreneurs in at least one of the survey rounds, 194 in 2007 and 197 in 2011, and thus we have very low attrition.4 In addition, we use background data (age and
education) from the baseline survey that we conducted in June-July 2008.
The upper part of Table 1 provides more details about the background of the entrepreneurs. We observe that the majority of the entrepreneurs in our sample are females, in line with the gender distribution in PRIDE. The average entrepreneur is 39 years old, married, and has completed primary schooling (which is seven years in Tanzania), but we observe that there is substantial heterogeneity both in age (ranging from 22 to 63 years) and in education (ranging from 0 to 18 years).
The lower part of Table 1 provides an overview of the field choices and field outcomes that we focus on in the analysis. These variables are self-reported by the entrepreneurs. Investments are measured as total investments in the two survey rounds, excluding purchases of stocks. Typical investments are sewing machines for tailors, cooking equipment, fridges, chairs and tables for small restaurants or kiosk owners, or general refurbishment of business premises. Average total investments are 762 000 TZS (approximately 610 USD), where 16% of the entrepreneurs had no investments in the survey period.
We study two types of employment choices; the number of employees in the business and how active the entrepreneur decides to be in the employer-employee relationship. The number of employees is measured as the average number of workers in the business in the two survey rounds, and can be interpreted as an indicator of growth in the business. We observe that the average entrepreneur has slightly less than one worker and that almost 35% of the entrepreneurs do not have
4 For the entrepreneurs that we reached in only one of the survey rounds, we use this observation and
adjust accordingly. For variables where we use the average value in the period, we use the single observation as the average value. For variables where we use the total value in the period, we assume that the one observation also is representative for the other survey round.
any worker in the business, while no entrepreneur has more than six workers. To study the employer-employee relationship, we consider the total number of times the entrepreneur has fired a worker or given a worker a bonus in the survey period. Both firing of workers and the offering of bonuses to workers may increase the competitiveness of the business, by reducing the number of low-productive workers and increasing worker productivity. We observe that the average entrepreneur has fired 0.75 workers and given a bonus to 1.2 workers in the period. Almost 70% of the entrepreneurs have not fired any workers and 46% of the entrepreneurs have not given any bonuses in the survey period.
Regarding field outcomes, we focus on self-reported profits and sales, where sales are seen as an alternative proxy for profits. Obtaining high quality data on profits and sales from small-scale entrepreneurs in a development context is notoriously difficult, since few entrepreneurs have reliable records. We therefore rely on self-reported data also for the field outcomes, in line with de Mel et al. (2007, 2008, 2009) and Karlan and Valdivia (2011). Specifically, we consider average monthly sales and average monthly operating profits in the survey period. The average entrepreneur has monthly sales of 2 330 000 TZS (approximately 1865 USD), and a profit margin of 26%. Two entrepreneurs report not having any sales or profits in the period.
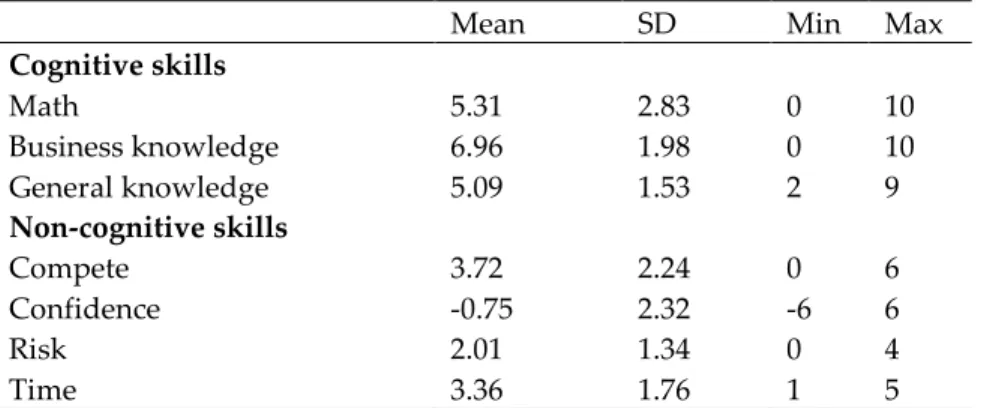
In the lab we collected data on a broad set of cognitive and non-cognitive skills, and Table 2 provides an overview of the different measures.5 We have three measures of
cognitive skills; math skills, business knowledge, and general knowledge, all based on the performance of the entrepreneur on different incentivized multiple-choice questions (250 TZS per correct answer) and all ranging from 0 (no question answered correctly) to 10 (all questions answered correctly).6The math questions consisted of
adding numbers; the business questions were on best practice in business, covering topics such as customer care, employee management, time management, and definitions of sales, profits, variable costs, and working capital; the general topics covered current events in sports and politics as well as questions on health and Tanzanian geography.
From the upper part of Table 2, we observe that the business questions seem to have been easiest for the entrepreneurs; the average entrepreneur answered on seven out of ten questions correctly. On math and general knowledge, the average score was about five correct answers. We also observe that there is considerable heterogeneity in the sample. About 15% of the entrepreneurs had nine or ten correct answers on the math questions, while 30% of the entrepreneurs had no more than three correct
5 More details about the lab can be found in Bjorvatn and Tungodden (2010). The lab instructions are
provided in Appendix B.
answers. We observe similar differences for the business knowledge and general knowledge questions.
The non-cognitive skills we focus on in the analysis are willingness to compete, risk- and time preferences, and confidence. To measure the entrepreneurs’ willingness to compete, we announced a second round of new multiple-choice questions on the same six topics that we used to measure the cognitive skills, but this time the participants had to decide whether to compete or not. If entrepreneurs decided to compete on a topic and performed better than “a typical microcredit client”, they were paid 750 TZS per correct answer, otherwise nothing.7 If the entrepreneurs
decided not to compete, they were paid a flat rate of 250 TZS per correct answer. The entrepreneurs had to make the competitiveness choice for each of the six topics, which means that the measure of willingness to compete ranges from zero to six.
Our measure of confidence is non-incentivized. After the completion of each of the six sets of multiple-choice questions in the first round (when everyone was paid the flat piece rate of 250 TZS). The participants were asked: “Do you believe that you are better than, equal to, or worse than a typical microcredit client in answering questions on topic X?” The confidence variable ranges from minus six (the entrepreneur believes he or she is worse on all the topics) to six (the entrepreneur believes he or she is better on all the topics). The confidence measure is zero if the entrepreneur believes that he or she is equally good as a typical microcredit client on all topics.
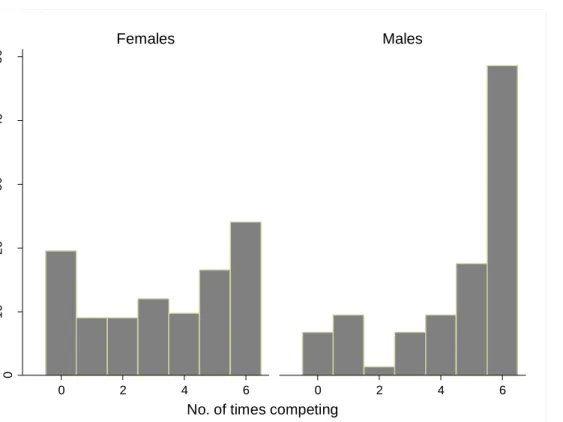
From Table 2, we observe that the entrepreneurs on average chose to compete on more than half of the topics (3.72 out of 6), even though on average they were not confident about their own abilities. Figure 1 shows the distribution of the willingness to compete measured by gender. We observe that more than 30% of the entrepreneurs chose to compete in all six rounds, while around 15% never competed. In line with the existing literature (see for instance Niederle and Vesterlund, 2007), we also find a significant gender difference in the willingness to compete; males are on average much more willing to compete than females to compete (4.5 times versus 3.3 times).
To measure risk preferences, the entrepreneurs were presented with four situations where they could choose between a risky alternative with two equally likely outcomes, 6000 TZS or nothing, and a safe alternative. The value of the safe alternative varied across the four situations, taking the values 1000 TZS, 1500 TZS,
7 We used the phrase “a typical microcredit client” to simplify the language in the experimental
instructions. The benchmark that the entrepreneurs had to beat in the competitive setting was the average score on these multiple-choice questions in a pilot we conducted with other clients of PRIDE Tanzania. None of the participants in the lab asked us for the precise definition of the benchmark.
2000 TZS, and 2500 TZS respectively.We use the number of times the entrepreneur chose the risky alternative as our measure of the willingness to take risk, which therefore ranges from zero to four. 8 From Table 2, we observe that the average
entrepreneur chose the risky alternative twice. 21% of the entrepreneurs chose to compete in all four situations, while 15% of the entrepreneurs never competed.
Time preferences were measured by offering the entrepreneurs different alternatives for when to receive the participation fee for the lab experiment, where they would receive a larger participation fee by delaying the payment date. The participants could choose between being paid one week after the lab and receive 15 000 Tsh, three weeks after the lab and receive 20 000 TZS, and five weeks after the lab and receive 25 000 TZS.9 Hence, by delaying payment by four weeks, their participation fee
would increase by 67 percent. We use the number of weeks they chose to wait for the participation fee as our measure of time preferences, which means that this variable takes the value of 1, 3 or 5. From Table 2, we observe that the average entrepreneur waited slightly more than three weeks. Almost 50% of the entrepreneurs waited five weeks, while 31% of the entrepreneurs only waited one week.
3.
Empirical strategyOur main aim is to study how the entrepreneurs’ field choices (investments, number of workers, number of workers fired, and number of workers given a bonus) and field outcomes (profits and sales) are associated with cognitive skills (math skills, business knowledge, and general knowledge) and non-cognitive skills (willingness to compete, confidence, and risk- and time preferences) measured in the lab.
For this purpose, we run standard OLS regressions where the dependent variable is a field variable and the explanatory variables are the non-cognitive lab variables (compete, risk, time, and confidence), the cognitive lab variables (math, business knowledge and general knowledge), and a set of background variables (training, female, age, education, and marital status). Standard errors are clustered at the loan group level, since loan group members are jointly liable for their loans and the error term therefore may be correlated within these groups.
We consider both untransformed outcomes and log-transformed outcomes when analyzing investments, profits and sales, while we only consider the untransformed outcomes for the employment variables. The untransformed outcomes are always mean-standardized. When considering log-transformed outcomes, we face the problem that 34 entrepreneurs have not invested anything in the survey period and
8 Note that our measure or risk aversion only captures different levels of risk aversion, and can
therefore not identify whether the entrepreneurs are risk neutral or risk loving.
9 To minimize the issue of trust when comparing the different payment alternatives, all alternatives
two entrepreneurs have zero profit. In these cases, we replace the actual value with the lowest observed value in the sample.
The focus of our analysis is the estimated coefficients for the lab variables. Even though these estimates cannot be given a causal interpretation, they will shed light on whether there is an association between lab behavior and field choices and outcomes for the entrepreneurs.10 A worry with our empirical strategy might,
however, be that the different lab variables are strongly correlated. In Table A1 in Appendix A we therefore report the correlation matrix for all the lab measures. We observe that the correlations between the different non-cognitive skills are very weak, while, not surprisingly, there are stronger correlations among the three cognitive skills measures. In the following, we will supplement the main analysis with robustness tests that show that our results are not driven by multicollinearity in the data.
4. Results
We here report the main regression showing how the lab variables are associated with the field choices and outcomes.
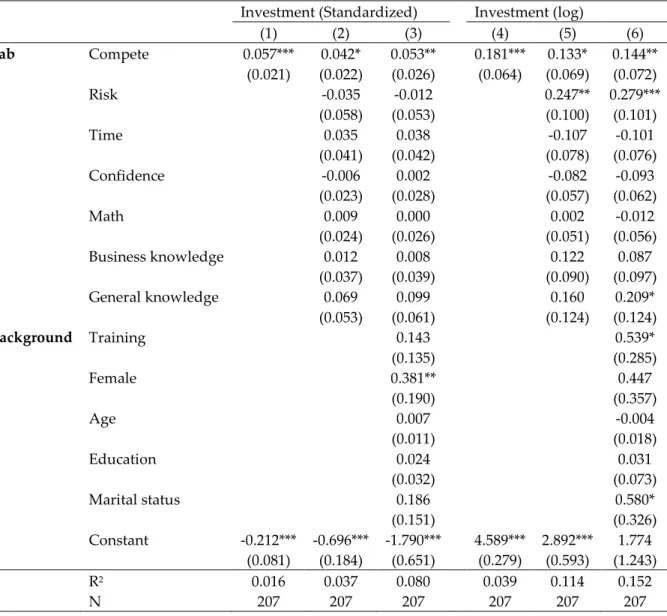
Table 3 reports the regressions with investment as the dependent variable. We observe that for all specifications, the willingness to compete in the lab is strongly and consistently associated with investments in the field. Columns (1)-(3) report regressions where the investment variable is untransformed, and the estimated coefficients show that competing one more time in the lab is associated with an increase in total investments in the field of 0.04 – 0.06 standard deviations. If we consider the specifications where the investment variable is log-transformed, columns (4)-(6), we find that the estimated coefficients on the willingness to compete are associated with an increase in total investments of 13-20%. Importantly, we also observe that the association between competing in the lab and total investments is robust to the inclusion of both other lab variables and background variables.
We also observe that the willingness to compete is the only lab variable that is consistently associated with total investments in the field. Risk preferences are strongly associated with total investments when the dependent variable is log-transformed, where more risky behavior in the lab is associated with more total investments in the field. But the point estimates for risk are negative, although not significant, in the regressions where the investment variable is untransformed. Time preferences and confidence in the lab are not consistently associated with total investments in the field for any of the specifications. The three measures of cognitive skills are in almost all cases positively associated with total investments, but this
10 Note that the background variable “Training” has a causal interpretation, given the randomized
association is only statistically significant for the general knowledge variable when we use the log-transformed dependent variable and include demographic controls.11
Turning to Table 4, we observe that the willingness to compete is also consistently and significantly associated with all the employment decisions, even when we include other lab variables and other background variables. Columns (1)-(3) show that one more competitive choice in the lab is associated with an increase in the number of workers in the business by 0.05-0.06 standard deviations; columns (4)-(9) suggest an association of the same magnitude between competitive behavior in the lab and the number of fired workers and bonuses offered in the period. For employment decisions, we also observe that there is some association between the risk- and time preferences in the lab and employment decisions in the field. The time preferences are statistically significant for all three employment variables, where we observe that patience in the lab is associated with employing fewer workers, firing fewer workers, and giving fewer bonuses. For risk preferences, we observe that risky behavior in the lab is associated with firing more workers, but not significantly associated with the other two employment decisions. Further, we observe that there is a positive association between confidence in the lab and the number of workers that the entrepreneur has given a bonus. It is an open question how to interpret the associations observed for risk- and time preferences and confidence, but for our analysis the important point is that the inclusion of these variables does not affect the strong association we find between competitive behavior in the lab and competitive employment decisions in the field. Finally, we observe that there are no significant associations between the lab measures of cognitive skills and employment decisions in the field.
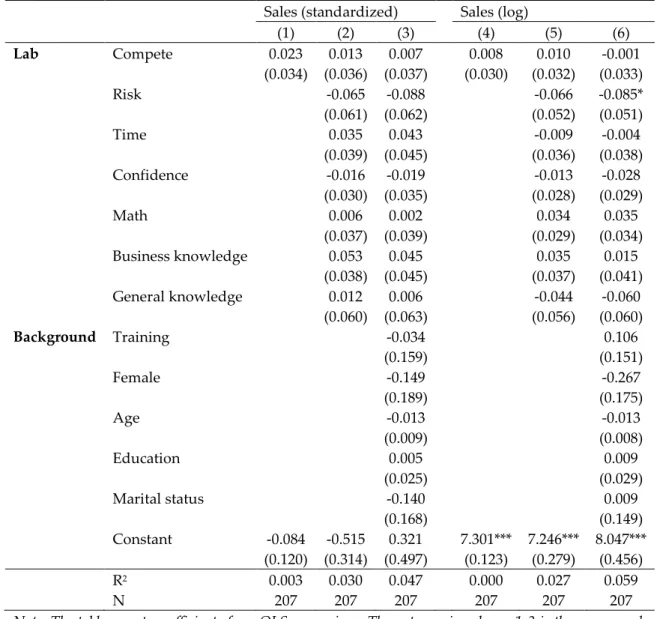
Table 5 and Table 6 report regressions of the field outcomes (profits and sales) on lab variables and background variables. We observe that the willingness to compete in the lab is positively associated with the profits of the business, although the association is not as strong as for investment or employment choices and only statistically significant when we consider the specification where the dependent variable is untransformed. From columns (1)-(3), we observe that choosing to compete one more time in the lab is associated with an increase in profits by 0.05-0.06 standard deviations. We also observe from Table 5 that willingness to compete is the only variable that is significantly associated with profits. Table 6 shows the regressions for sales on lab variables and background variables, where we observe that none of the explanatory variables are statistically significant, with the exception of risk preferences in the log-transformed specification that includes both lab variables and background variables.
11 Here and in the following, we do not focus on the estimated coefficients for the background
variables. For a further analysis of the larger data set including all the entrepreneurs involved in the randomized control trial, see Berge et al. (2014).
Robustness checks largely confirm our main results. First, to see whether the results are partly driven by multicollinearity, we have regressed the field choices and field outcomes separately on each of the lab variables. The main picture from our multiple variable regressions holds; the willingness to compete clearly stands out as the lab-measure that is most systematically associated with the field variables (see Table A2 in Appendix A).
Second, inspired by Grosse and Reiner (2010) and Günther et al. (2009), who show that the type of task may matter for competitive behavior, we also study whether the association between the willingness to compete and field variables is specific for certain topics. We therefore regress the field variables separately on each of the six compete decisions in the lab (see Table A3 in appendix A). Although we find some differences among the domains, no clear pattern stands out, indicating that our results are largely not domain sensitive.
Third, we considered whether the entrepreneurs who make successful competition choices in the lab mainly drive the results. For this optimality analysis, we rely on the framework introduced in Niederle and Vesterlund (2007), where they distinguish between the ex ante and ex post approach. The ex ante approach considers whether the participant made a successful choice given the performance in the first round, while the ex post approach considers whether the participant made a successful choice given how he or she actually performed in the competition. As shown in Table A8 in Appendix A, the ex ante approach provides a stronger association with field outcomes than the ex post approach, but none of them outperform the competition variable used in the main analysis.12
Finally, given that our field variables are self-reported by the entrepreneur, one might question whether our results are driven by a correlation between the willingness to compete and a willingness to over report, for example, profits and sales. In the 2011 survey, we introduced a test of “bragging”, where we asked the entrepreneurs about their knowledge of different business terms. Half of these business terms were meaningless, and thus we take as a measure of bragging the number of meaningless business terms that the entrepreneur claimed to know. All our results are robust to the inclusion of this variable in the analysis.13
In sum, our analysis shows that the willingness to compete in the lab is strongly and consistently associated with field choices (investments and employment decisions), while the evidence on a positive association with field outcomes is more suggestive
12In Table A9 in the Appendix A, we also show that the willingness to compete is strongly positively
associated with the amount of money an entrepreneur were paid overall in the lab.
13We have not included the variable in the regressions, because it reduces the sample size (we have this
for profits and absent for sales. This weaker relationship with field outcomes is not surprising. First, field outcomes such as profits and sales are harder to measure than the variables capturing the field choices. Second, the entrepreneurs clearly have less control over field outcomes than field choices. Entrepreneurs can directly implement investments and employment decisions, while profits or sales are to an important extent determined by market factors beyond the entrepreneurs’ control.
The literature on competitiveness has been particularly concerned with gender issues, and thus in Appendix A we also extend our main analysis to include gender interaction effects for the willingness to compete. As shown in Tables A4-A7, no systematic pattern emerges. The association between competition in the lab and field variables seems to be stronger for female entrepreneurs when we consider investments, but stronger for male entrepreneurs when we consider the number of workers in the business. In all the other cases, the gender interaction effect is insignificant.
5. Concluding remarks
To what extent can competitive behavior in the lab say something about real world choices and outcomes? Given the large number of lab experiments on competitiveness, surprisingly few studies have so far emerged addressing this question.
Our study shows that the willingness to compete in the lab is strongly associated with field choices made by small-scale entrepreneurs in a development context, and to some extent also positively associated with the profits of their businesses. Other non-cognitive skills, such as risk- and time preferences and confidence, as well as cognitive skills, are also associated with some field variables, but arguably less consistently than competitiveness. Our results therefore suggest that the willingness to compete is a key entrepreneurial trait, and possibly more important than other non-cognitive skills often measured in the lab. An important avenue for further research is certainly to see whether our results are robust for small-scale entrepreneurs in other contexts, and more broadly whether there is an association between the willingness to compete in the lab and important field outcomes for other groups in society.
Our results may be of importance for policy interventions aiming at empowering small-scale entrepreneurs, particularly females who typically are less willing to compete than males. They suggest an increased focus on the importance of being willing to compete in order to succeed in business, even though the optimal level of competitive behavior is still an open question both in the lab and in the field.
References
Acs, Z., Arenius, P., Hay, M., Minniti, M., 2005. Global Entrepreneurship Monitor– 2004 Summary Report, Babson College and London Business School.
Ashraf, N., Karlan, D., Yin, W., 2006. Tying Odysseus to the Mast: Evidence From a Commitment Savings Product in the Philippines, The Quarterly Journal of Economics. 121, 635-672.
Becker, G., 1975. Human Capital, Chicago: University of Chicago Press.
Benz, M., Meier, S., 2008. Do People Behave in Experiments as in the Field?— Evidence from Donations, Experimental Economics. 11, pp. 268-281.
Berge, L. I. O., Bjorvatn, K., Tungodden, B., 2014. Human and Financial Capital for Microenterprise Development: Evidence from a Field and Lab Experiment, forthcoming Management Science.
Bjorvatn, K., Tungodden, B., 2010. Teaching Entrepreneurship in Tanzania: Evaluating Participation and Performance, Journal of the European Economic Association. 8, 561–570.
Booth, A., Nolen, P., 2012. Choosing to Compete: How Different are Girls and Boys?, Journal of Economic Behavior and Organization. 81, 542-555.
Bulte, E., Kontoleon, A., List, J., Turley, T. Voors, M., 2012. Exploring Whether Behavior in Context-Free Experiments is Predictive of Behavior in the Field: Evidence from Lab and Field Experiments in Rural Sierra Leone, Framed Field Experiments 00132, The Field Experiments Website.
Buser, T., Niederle, M., Oosterbeek, H., 2014. Gender, Competitiveness and Career Choices, The Quarterly Journal of Economics, forthcoming.
Cramer, J., Hartog, J., Jonker, N., van Praag, C., 2002. Low Risk Aversion Encourages the Choice for Entrepreneurship: An Empirical Test of a Truism. Journal of Economic Behavior and Organization. 48, 29–36.
de Mel, S., McKenzie, D., Woodruff, C., 2007. Who does Microfinance Fail to Reach? Experimental Evidence on Gender and Microenterprise Returns, BREAD Working Paper 157.
de Mel, S., McKenzie, D., Woodruff, C., 2008. Returns to Capital in Microenterprises: Evidence from a Field Experiment. Quarterly Journal of Economics. 123, 1329-1371.
de Mel, S., McKenzie, D., Woodruff, C., 2009. Measuring Microenterprise Profits: Must we ask how the Sausage is Made?. Journal of Development Economics. 88, 19-31.
Doepke, M., Zilibotti, F. 2014. Culture, Entrepreneurship, and Growth, Handbook of Economic Growth, volume 2, Elsevier.
Dohmen, T, Falk, A., Huffman, D., Sunde, U., Schupp, J., Wagner, G., 2011. Individual Risk Attitudes: Measurement, Determinants and Behavioral Consequences, Journal of the European Economic Association. 9, 522-550.
Dohmen, T., Falk, A., 2011. Performance Pay and Multidimensional Sorting: Productivity, Preferences, and Gender. American Economic Review. 101, 556-590.
Evans, D., Jovanovic, B., 1989. An Estimated Model of Entrepreneurial Choice under Liquidity Constraints. Journal of Political Economy. 97, 808-827.
Evans, D., Leighton, L., 1989. Some Empirical Aspects of Entrepreneurship. American Economic Review. 79, 519-35.
Falk, A., Fehr, E., 2003. Why Labour Market Experiments?. Labour Economics. 10, 399-406.
Fisher, P., 2010. Gender Differences in Personal Saving Behaviors. Journal of Financial Counseling and Planning. 21, 14-24
Flory, J., Leibbrandt, A., List, J., 2010. Do Competitive Work Places Deter Female Workers? A Large-Scale Natural Field Experiment on Gender Differences in Job-Entry Decisions. NBER w16546.
Fortin, N., 2008. The Gender Wage Gap among Young Adults in the United States The Importance of Money versus People. Journal of Human Resources. 43, 884-918.
Franzen, A., Pointner, S., 2013. The External Validity of Giving in the Dictator Game, Experimental Economics. 16, 155-169.
Gneezy, U., Rustichini, A., 2004. Gender and Competition at a Young Age. American Economic Review. 94, 377-381.
Gneezy, U., Leonard, K., List, J., 2009. Gender Differences in Competition: Evidence from a Matrilineal and a Patriarchal Society. Econometrica. 77, 1637-1664.
Gneezy, U., Niederle, M., Rustichini, A., 2003. Performance in Competitive Environments: Gender Differences. Quarterly Journal of Economics. 118, 1049-1074.
Grosse, N., Riener, G., 2010. Explaining Gender Differences in Competitiveness: Gender-Task Stereotypes. Jena Economic Research Papers No 2010-017, Friedrich-Schiller-University Jena, Max-Planck-Institute of Economics.
Günther, C., Ekinci, N., Schwieren, C., Strobel, M., 2010. Women Can't Jump? An Experiment on Competitive Attitudes and Stereotype Threat. Journal of Economic Behavior and Organization. 75, 395-401.
Hall, R., Woodward, S., 2010. The Burden of the Nondiversifiable Risk of Entrepreneurship. American Economic Review. 100, 1163-1194.
Healy, A., Pate, J., 2011. Can Teams Help to Close the Gender Competition Gap?. The Economic Journal. 121, 1192-1204.
Jakiela, P., Miguel, E., te Velde, V. L., 2010. You’ve Earned it: Combining Field and Lab Experiments to Estimate the Impact of Human Capital on Social Preferences. NBER Working Paper 16449.
Karlan, D., 2005. Using Experimental Economics to Measure Social Capital and Predict Financial Decisions. American Economic Review. 95, 1688-1699.
Karlan, D. and Valdivia, M., 2011. Teaching Entrepreneurship: Impact of Business Training on Microfinance Clients and Institutions. Review of Economics and Statistics. vol. 93 (2), 510-527.
Kihlstrom, R., Laffont, J.-J., 1979. A General Equilibrium Entrepreneurial Theory of Firm Formation Based on Risk Aversion. Journal of Political Economy. 87, 719– 748.
Lazear, E., 2004. Balanced Skills and Entrepreneurship. American Economic Review. 94, 208-211.
Lazear, E., 2005. Entrepreneurship. Journal of Labor Economics. 23, 649-680.
Levitt, S., List, J., 2007a. What Do Laboratory Experiments Measuring Social Preferences Reveal about the Real World?. The Journal of Economic Perspectives. 21, 153-174.
Levitt, S., List, J., 2007b. Viewpoint: on the Generalizability of Lab Behavior to the Field. Canadian Journal of Economics. 40, 347-370.
Meier, S., Sprenger, C., 2010. Present-Biased Preferences and Credit Card Borrowing. American Economic Journal: Applied Economics. 2, 193-210.
Mischel, W., Shoda, Y., Rodriguez, M., 1989. Delay of Gratification in Children. Science. 244, 933-938.
Niederle, M., Vesterlund, L., 2007. Do Women Shy Away from Competition? Do Men Compete Too Much?. The Quarterly Journal of Economics. 122, 1067-1101. Ors, E., Palomino, F., Peyrache, E., 2013. Performance Gender Gap: Does Competition
Matter?. Journal of Labor Economics. 31, 443-499.
Qin, T., Erwin, B., 2010. Trust, Market Participation and Economic Outcomes: Evidence from Rural China. World Development. 38, 1179-1190.
Read, D., Van Leeuwen, B., 1998. Predicting Hunger: The Effects of Appetite and Delay on Choice. Organizational Behavior and Human Decision Processes. 76, 189-205.
Reyes-Garcia, V., Godoy, R., Huanca, T., Leonard, W., McDade, T., Tanner, S., Vadez, V., 2007. The Origin of Monetary Income Inequality: Patience, Human Capital, and the Division of Labor. Evolution and Human Behavior. 28, 37–47.
Sutter, M., Kocher, M., Glätzle-Rüetzler, D., Trautmann, S., 2013. Impatience and Uncertainty: Experimental Decisions Predict Adolescents' Field Behavior. American Economic Review. 103, 510-531.
Vereshchagina, G., Hopenhayn, H., 2009. Risk Taking by Entrepreneurs. American Economic Review. 99, 1808-1830.
Zhang, Y., 2012. Can Experimental Economics Explain Competitive Behavior Outside the Lab?. Mimeo Hong Kong University of Science and Technology.
6. Figures and tables
Figure 1. Competitiveness and Gender. The figure shows the distribution of the number of times the entrepreneurs decided to compete, by gender.
0 10 20 30 40 50 0 2 4 6 0 2 4 6 Females Males Pe rc e n t
Table 1: The Field
Mean SD Min Max
Background Female 0.64 0.48 0 1 Age 38.88 8.08 22 63 Education 7.87 2.39 0 18 Marital status 0.71 0.45 0 1 Training 0.51 0.50 0 1 Choices Investment (in 1000 TZS) 762 1390 0 10552 No. of workers 0.89 1.02 0 6
No. of fired workers 0.75 1.62 0 13
No. of workers given bonus 1.19 1.82 0 16
Outcomes
Profit (in 1000 TZS) 613 745 0 7136
Sales (in 1000 TZS) 2330 3096 0 18970
Note: The table shows descriptive statistics of the field variables for the 207 entrepreneurs that we reached in the survey rounds. Background: Female is a dummy indicating if the entrepreneur is a female. Age is the age of the entrepreneur, in years. Education is the years of schooling. Marital status is a dummy indicating if the client is married. Training is a dummy indicating if the entrepreneur was offered business training. Choice: Investment is total investments summarized over the two survey rounds (in 1000 TZS). No. of workers is the average number of workers across the two survey rounds. No. of fired workers is the number of fired workers summarized over the two surveys. No. of workers given bonus is the number of workers given a bonus summarized over the two surveys. Outcomes: Profit is the average profit across the two survey rounds (1000 TZS). Sales is the average profit across the two survey rounds (1000 TZS)
Table 2: The Lab
Mean SD Min Max
Cognitive skills Math Business knowledge General knowledge Non-cognitive skills Compete 5.31 6.96 5.09 3.72 2.83 1.98 1.53 2.24 0 0 2 0 10 10 9 6 Confidence Risk -0.75 2.01 2.32 1.34 -6 0 6 4 Time 3.36 1.76 1 5
Note: The table shows descriptive statistics of the lab variables for the 207 entrepreneurs that we reached in the survey rounds. Cognitive skills: Math is the number of correct answers (0-10) on a multiple-choice test on additions. Business knowledge is the number of correct answers (0-10) on a multiple-choice test on business facts and practices. General knowledge is the average number of correct answers (0-10) on four general topics (sports and leisure, politics, health and nutrition, and places in Dar es Salaam and Tanzania). Non-cognitive skills: Compete is measured as the number of times the entrepreneur decided to compete (0-6). Confidence is measured on a scale from minus six (worse than the others) to six (better than
the others). Risk is measured as the number of times the entrepreneur chose the risky alternative (0-4). Time is the number of weeks the client chose to wait before collecting the participation fee (1, 3 or 5 weeks)
Table 3: Investment
Investment (Standardized) Investment (log)
(1) (2) (3) (4) (5) (6) Lab Compete 0.057*** 0.042* 0.053** 0.181*** 0.133* 0.144** (0.021) (0.022) (0.026) (0.064) (0.069) (0.072) Risk -0.035 -0.012 0.247** 0.279*** (0.058) (0.053) (0.100) (0.101) Time 0.035 0.038 -0.107 -0.101 (0.041) (0.042) (0.078) (0.076) Confidence -0.006 0.002 -0.082 -0.093 (0.023) (0.028) (0.057) (0.062) Math 0.009 0.000 0.002 -0.012 (0.024) (0.026) (0.051) (0.056) Business knowledge 0.012 0.008 0.122 0.087 (0.037) (0.039) (0.090) (0.097) General knowledge 0.069 0.099 0.160 0.209* (0.053) (0.061) (0.124) (0.124) Background Training 0.143 0.539* (0.135) (0.285) Female 0.381** 0.447 (0.190) (0.357) Age 0.007 -0.004 (0.011) (0.018) Education 0.024 0.031 (0.032) (0.073) Marital status 0.186 0.580* (0.151) (0.326) Constant -0.212*** -0.696*** -1.790*** 4.589*** 2.892*** 1.774 (0.081) (0.184) (0.651) (0.279) (0.593) (1.243) R2 0.016 0.037 0.080 0.039 0.114 0.152 N 207 207 207 207 207 207
Note: The table reports coefficients from OLS regressions. The outcome in column 1-3 is the investments summarized over the two survey rounds, mean standardized. In column 4-6, the outcome is the log of investments. Compete is measured as the number of times the entrepreneur decided to compete (0-6). Risk is measured as the number of times the entrepreneur chose the risky alternative (0-4). Time is the number of weeks the client chose to wait before collecting the show up fee (1, 3 or 5 weeks). Confidence is measured on a scale from minus six (worse than the others) to six (better than the others). Math is the number of correct answers (0-10) on a multiple-choice test on additions. Business knowledge is the number of correct answers (0-10) on a multiple-choice test on business facts and practices. General knowledge is the average number of correct answers (0-10) on four general topics (sports and leisure, politics, health and nutrition, and places in Dar es Salaam and Tanzania). Training is a dummy indicating if the entrepreneur was offered business training. Female is a dummy indicating the entrepreneur is a female. Age is the age of the entrepreneur, in years. Education is the years of schooling. Marital status is an indicator variable taking the value of one if the client is married. Cluster-robust standard errors in parentheses; *p<0.10, ** p<0.05, *** p<0.01.
Table 4: Employment
Number of workers Number of fired workers Number of workers given a bonus
(1) (2) (3) (4) (5) (6) (7) (8) (9) Lab Compete 0.056* 0.056* 0.058* 0.062** 0.060* 0.068* 0.051 0.060* 0.064* (0.030) (0.030) (0.030) (0.030) (0.034) (0.036) (0.031) (0.034) (0.037) Risk 0.039 0.052 0.082** 0.093** -0.028 -0.028 (0.058) (0.059) (0.041) (0.046) (0.044) (0.044) Time -0.116*** -0.120*** -0.104** -0.103** -0.073* -0.069* (0.044) (0.045) (0.046) (0.046) (0.037) (0.037) Confidence 0.019 0.019 0.011 0.017 0.048* 0.059* (0.030) (0.033) (0.019) (0.020) (0.027) (0.033) Math 0.030 0.030 0.011 0.006 0.028 0.021 (0.032) (0.034) (0.022) (0.026) (0.028) (0.027) Business knowledge 0.054 0.045 -0.004 0.003 0.039 0.040 (0.052) (0.059) (0.049) (0.044) (0.047) (0.054) General knowledge -0.081 -0.072 -0.004 0.018 -0.122 -0.108 (0.066) (0.069) (0.051) (0.064) (0.080) (0.078) Background Training 0.201 -0.023 -0.002 (0.147) (0.132) (0.156) Female 0.119 0.222 0.166 (0.146) (0.193) (0.149) Age 0.006 0.000 0.000 (0.008) (0.008) (0.007) Education 0.014 -0.013 0.013 (0.030) (0.025) (0.028) Married 0.019 0.104 -0.149 (0.196) (0.147) (0.200) Constant -0.209 -0.003 -0.551 -0.230** -0.036 -0.339 -0.190* 0.316 0.146 (0.131) (0.269) (0.491) (0.098) (0.320) (0.403) (0.113) (0.313) (0.526) R2 0.016 0.067 0.082 0.019 0.061 0.069 0.013 0.058 0.071 N 207 207 207 207 207 207 207 207 207
Note: The table reports coefficients from OLS regressions. The outcome in column 1-3 is the average number of workers across the two survey rounds, mean standardized. In column 4-6, the outcome is the number of fired workers summarized over the two surveys, mean standardized. In column 7-9, the outcome is the number of workers given a bonus summarized over the two surveys, mean standardized. Compete is measured as the number of times the entrepreneur decided to compete (0-6). Risk is measured as the number of times the entrepreneur chose the risky alternative (0-4). Time is the number of weeks the client chose to wait before collecting the show up fee (1, 3 or 5 weeks). Confidence is measured on a scale from minus six (worse than the others) to six (better than the others). Math is the number of correct answers (0-10) on a multiple-choice test on additions. Business knowledge is the number of correct answers (0-10) on a multiple-choice test on business facts and practices. General knowledge is the average number of correct answers (0-10) on four general topics (sports and leisure, politics, health and nutrition, and places in Dar es Salaam and Tanzania). Training is a dummy indicating if the entrepreneur was offered business training. Female is a dummy indicating the entrepreneur is a female. Age is the age of the entrepreneur, in years. Education is the years of schooling. Marital status is an indicator variable taking the value of one if the client is married. Cluster-robust standard errors in parentheses; *p<0.10, ** p<0.05, *** p<0.01.
Table 5: Profit
Profit (standardized) Profit (log)
(1) (2) (3) (4) (5) (6) Lab Compete 0.060** 0.049* 0.049* 0.025 0.026 0.019 (0.027) (0.028) (0.029) (0.023) (0.024) (0.025) Risk -0.062 -0.082 -0.049 -0.062 (0.051) (0.056) (0.041) (0.042) Time 0.047 0.060 -0.010 -0.005 (0.041) (0.045) (0.030) (0.031) Confidence -0.006 0.003 -0.015 -0.024 (0.031) (0.041) (0.023) (0.025) Math 0.031 0.019 0.027 0.026 (0.033) (0.031) (0.024) (0.026) Business knowledge 0.031 0.029 0.033 0.021 (0.037) (0.043) (0.032) (0.034) General knowledge 0.019 0.023 -0.033 -0.047 (0.080) (0.086) (0.049) (0.053) Background Training -0.138 0.035 (0.155) (0.118) Female 0.051 -0.171 (0.182) (0.137) Age -0.009 -0.007 (0.010) (0.007) Education 0.025 0.016 (0.029) (0.028) Marital status -0.212 0.013 (0.190) (0.129) Constant -0.222*** -0.700* -0.313 6.086*** 5.999*** 6.405*** (0.069) (0.400) (0.780) (0.085) (0.231) (0.432) R2 0.018 0.050 0.072 0.006 0.034 0.051 N 207 207 207 207 207 207
Note: The table reports coefficients from OLS regressions. The outcome in column 1-3 is the average profit across the two survey rounds, mean standardized. In column 4-6, the outcome is the log of profits. Compete is measured as the number of times the entrepreneur decided to compete (0-6). Risk is measured as the number of times the entrepreneur chose the risky alternative (0-4). Time is the number of weeks the client chose to wait before collecting the show up fee (1, 3 or 5 weeks). Confidence is measured on a scale from minus six (worse than the others) to six (better than the others). Math is the number of correct answers (0-10) on a multiple-choice test on additions. Business knowledge is the number of correct answers (0-10) on a multiple-choice test on business facts and practices. General knowledge is the average number of correct answers (0-10) on four general topics (sports and leisure, politics, health and nutrition, and places in Dar es Salaam and Tanzania). Training is a dummy indicating if the entrepreneur was offered business training. Female is a dummy indicating the entrepreneur is a female. Age is the age of the entrepreneur, in years. Education is the years of schooling. Marital status is an indicator variable taking the value of one if the client is married. Cluster-robust standard errors in parentheses; *p<0.10, ** p<0.05, *** p<0.01.
Table 6: Sales
Sales (standardized) Sales (log)
(1) (2) (3) (4) (5) (6) Lab Compete 0.023 0.013 0.007 0.008 0.010 -0.001 (0.034) (0.036) (0.037) (0.030) (0.032) (0.033) Risk -0.065 -0.088 -0.066 -0.085* (0.061) (0.062) (0.052) (0.051) Time 0.035 0.043 -0.009 -0.004 (0.039) (0.045) (0.036) (0.038) Confidence -0.016 -0.019 -0.013 -0.028 (0.030) (0.035) (0.028) (0.029) Math 0.006 0.002 0.034 0.035 (0.037) (0.039) (0.029) (0.034) Business knowledge 0.053 0.045 0.035 0.015 (0.038) (0.045) (0.037) (0.041) General knowledge 0.012 0.006 -0.044 -0.060 (0.060) (0.063) (0.056) (0.060) Background Training -0.034 0.106 (0.159) (0.151) Female -0.149 -0.267 (0.189) (0.175) Age -0.013 -0.013 (0.009) (0.008) Education 0.005 0.009 (0.025) (0.029) Marital status -0.140 0.009 (0.168) (0.149) Constant -0.084 -0.515 0.321 7.301*** 7.246*** 8.047*** (0.120) (0.314) (0.497) (0.123) (0.279) (0.456) R2 0.003 0.030 0.047 0.000 0.027 0.059 N 207 207 207 207 207 207
Note: The table reports coefficients from OLS regressions. The outcome in column 1-3 is the average sales across the two survey rounds, mean standardized. In column 4-6, the outcome is the log of sales. Compete is measured as the number of times the entrepreneur decided to compete (0-6). Risk is measured as the number of times the entrepreneur chose the risky alternative (0-4). Time is the number of weeks the client chose to wait before collecting the show up fee (1, 3 or 5 weeks). Confidence is measured on a scale from minus six (worse than the others) to six (better than the others). Math is the number of correct answers (0-10) on a multiple-choice test on additions. Business knowledge is the number of correct answers (0-10) on a multiple-choice test on business facts and practices. General knowledge is the average number of correct answers (0-10) on four general topics (sports and leisure, politics, health and nutrition, and places in Dar es Salaam and Tanzania). Training is a dummy indicating if the entrepreneur was offered business training. Female is a dummy indicating the entrepreneur is a female. Age is the age of the entrepreneur, in years. Education is the years of schooling. Marital status is an indicator variable taking the value of one if the client is married. Cluster-robust standard errors in parentheses; *p<0.10, ** p<0.05, *** p<0.01.