Portland State University
PDXScholar
Dissertations and Theses Dissertations and Theses
Spring 7-12-2018
The Gender Gap in Postsecondary Enrollment Intentions: the
Mediating Role of Student Attitudes and Behaviors
Paul J. Deppen III Portland State University
Let us know how access to this document benefits you.
Follow this and additional works at:https://pdxscholar.library.pdx.edu/open_access_etds Part of theHigher Education Commons, and theSociology Commons
This Thesis is brought to you for free and open access. It has been accepted for inclusion in Dissertations and Theses by an authorized administrator of PDXScholar. For more information, please contactpdxscholar@pdx.edu.
Recommended Citation
Deppen III, Paul J., "The Gender Gap in Postsecondary Enrollment Intentions: the Mediating Role of Student Attitudes and Behaviors" (2018).Dissertations and Theses.Paper 4454.
The Gender Gap in Postsecondary Enrollment Intentions: The Mediating Role of Student Attitudes and Behaviors
by
Paul J. Deppen III
A thesis submitted in partial fulfillment of the requirements for the degree of
Master of Science in
Sociology
Thesis Committee: Dara Shifrer, Chair Lindsey Wilkinson
Julius McGee
Portland State University 2018
i
Abstract
Current literature on the gender gap in higher education lacks in-depth exploration of how the gap between males and females in postsecondary enrollment and degree attainment differs among racial/ethnic groups and among students of differing
socioeconomic status (SES). This thesis explores the potential mediating role of student attitudes and behaviors and whether or not inclusion in certain racial/ethnic or SES groups moderates the relationship between gender and intentions to continue one’s
education immediately after high school graduation. This study uses data from the High School Longitudinal Study of 2009 (HSLS09). Results suggest that student attitudes mediate more of the relationship between student gender and postsecondary education intentions and that this mediation was strongest for Hispanic students. Additionally, results also suggest that the gender gap in postsecondary education intentions is smallest among Hispanics, indicating that Hispanic identity moderates the relationship between student gender and postsecondary education intentions. Results pertaining to the moderating role of SES were inconclusive.
ii
Table of Contents
Abstract ………. i
List of Tables ……….. iii
List of Figures ………. iv
1. Introduction ……….. 1
2. Literature Review ………. 3
3. Conceptual Models and Research Questions ………. 11
4. Data and Methods ……….. 13
5. Results ……….... 21
6. Conclusion ………. 26
7. Discussion ……….. 29
8. Limitations ………. 31
9. Tables and Figures ………... 33
iii
List of Tables
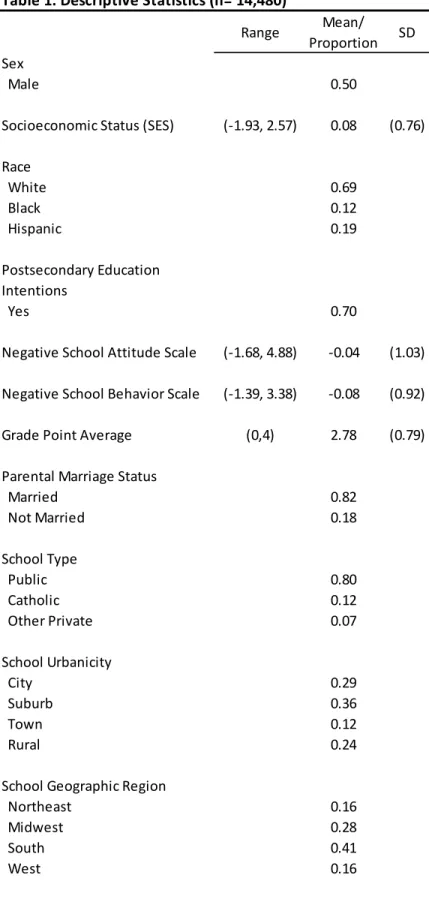
Table1. Descriptive Statistics ………... 33
Table 2. Race and Socioeconomic Status (SES) Variation in Gender Differences in Mediators ………. 36 Table 3a. Log Odds from Mixed-Effects Logistic Regression Predicting Postsecondary Education Intentions, Models 1-2 ……… 37 Table 3b. Log Odds from Mixed-Effects Logistic Regression Predicting Postsecondary Education Intentions, Models 3-4 ……… 38 Table 4. The Extent to Which Negative Attitudes and Behaviors Mediate the Effect of being Male on Postsecondary Education Intentions by Race ……….. 39
iv
List of Figures
Figure 1. Predicted Probability of Postsecondary Education Intentions by Race and Sex of Student ………. 40
1
1. Introduction
During the late 1980s to the early 1990s, the proportion of traditional college-aged young adults (18 to 24) enrolling in college began to diverge along gender lines, resulting in what has been characterized as a “reversal from a male advantage to a female advantage in educational attainment” (DiPrete and Buchmann 2013:1). National statistics
suggest this gender gap in college enrollment, and subsequent degree attainment, has continued into the present (NCES 2016). Notably, these changing patterns in higher education coincided with the rise of globalization and industrial automation—factors that led to a decline in low- and un-skilled jobs that at one time offered the hope of a middle-class lifestyle for those, particularly males, who chose to not pursue a college degree.
As a potential result of the shifting gender patterns in higher education, more young women are now earning incomes above the national median compared to 40 years ago, while an increasing proportion of men have either fallen into the lowest income category or are neither working nor in school (Vespa 2017). Additionally, the current labor market’s emphasis on a college education means that males, and potentially lower-class and racial minority males especially, will find themselves at a greater disadvantage in the employment market unless they are able to improve their rates of college
participation and degree achievement. At a time when deep economic divisions among Americans are also creating serious political divisions (see Hochschild 2016; Kimmel 2013), it is important for sociologists to sharpen their understanding of who is most disadvantaged in the American educational system, in terms of opportunities for social mobility, and what contributes to this disadvantage. In this thesis, I will use data on around 14,500 adolescents from the large, nationally representative High School
2
Longitudinal Study of 2009 to answer the following research questions: Like the male disadvantage evident in college participation and degree attainment, are gender differences present at the end of high school in students’ postsecondary education intentions? Does socioeconomic status or race moderate any gender differences in postsecondary education intentions? Is any estimated effect of gender on postsecondary education intentions mediated by negative school attitudes and behaviors?
3
2. Literature Review
Masculinity and Education
Gender construction is a salient feature in American high schools. Adolescents, in the midst of transitioning from childhood to adulthood, refine meanings of masculinity and femininity they have been exposed to and incorporate them into their personal goals and identities (Erikson 1993). These gendered identities are expressed and negotiated through everyday interactions and behaviors according to commonly accepted notions of male and female gender roles in a process termed “doing gender” (West & Zimmerman 1987). Gendered divisions in the socialization of adolescents are also driven by dominant notions in the larger culture about what constitutes either a masculine or feminine
persona. For males, the dominant themes regarding masculinity include stoicism,
independence, toughness, emotionlessness, and repudiation of femininity (Brannon 1976; Kimmel 2008; Pollack 1998). These themes are enacted in males’ everyday behaviors, during daily interactions, through what Schrock and Schwalbe (2009:281) have termed “manhood acts” which are, ultimately,“aimed at claiming privilege, eliciting deference, and resisting exploitation.”
Thus, male students use their understanding of the male gender role as a way of asserting a certain ‘hegemonic masculinity’ (Connell 1987). This strategy provides males with specific strategies aimed at benefitting from (and reproducing) the patriarchal system of power that exists in larger society, although this process interacts with other social identities which can inhibit its success among certain disadvantaged males (e.g., racial minorities, low-SES males). At the same time, males also attempt to distance
4
themselves from perceived inferior social groups (i.e., females) by eschewing academic effort and achievement (Fine, Weis, Addelston, & Marusza 1997; Reay 2002). In an educational context, the idea of ‘doing gender’ can help explain gendered attitudinal, behavioral, and achievement patterns among students (Morris 2011). Females, for example, are generally thought to act in a more compliant manner and orient themselves towards academic success while males display behavior that is resistant to authority (i.e., teachers) and develop views of academic work as feminine and thus incompatible with their social role as males (Mickelson 1989).
The pursuit of privilege and respect, through the repudiation of femininity, is especially salient for explaining boys’ lagging academic performance and academic disengagement. Research has shown that it is not just male adolescents who internalize concepts of masculinity. Teachers, and some female students, may (inadvertently) reinforce gender stereotypes, emphasizing males’ supposed ‘natural’ intellect, thereby legitimizing their lowered academic efforts (Jackson & Dempster 2009; Morris 2012). Furthermore, male high school students can also develop negative attitudes towards seeking help, which presumably violates the masculinity code of independence, and compounds the barriers they face in achieving academic success (Kessels & Seinmayr 2013). As males who buy into these notions of masculinity experience further academic setbacks due to their low effort and engagement in high school, they could potentially suffer from lowered confidence in their ability to succeed in college. However,
adolescent males may still continue to adhere to the notion of a ‘superior, effortless male intellect’ since it not only shores up claims to a privileged social position, but also simultaneously serves as an explanation for males’ failure to perform up to expectations,
5
helping them to potentially avoid both humiliation (Coston & Kimmel 2012; Morris 2012) and academic effort at once.
By aligning their attitudes and behaviors with dominant constructions of masculinity, adolescent males may almost align themselves in opposition to education, echoing oppositional culture theory. Fordham and Ogbu (1986) originally proposed oppositional culture theory by asserting some African-American students develop negative associations with schools and academic effort in an attempt to distance themselves from dominant social groups and institutions in the face of structural discrimination. While this theory was originally developed to explain educational patterns among a specific group of disadvantaged students, subsequent research has found that oppositional culture theory may also explain the development of negative academic attitudes among other groups who experience structural discrimination, including poor white youth (Farkas, Lleras, & Maczuga 2002; Tyson, Darity, & Castellino 2005).
Oppositional culture theory also did not take into account students’ gender. Norms of masculinity, and males’ increasingly precarious position in educational settings, may lead to all males, regardless of race or class, exhibiting negative attitudes and behaviors consistent with oppositional theory, relative to females, as has been found in at least one test of Fordham and Ogbu’s theory (Lundy 2003). Consequently,
adolescent males who try to assert their social dominance and male privilege in this manner are ultimately hurting their future chances of occupying respectable and desirable roles in an economy that is increasingly reliant on a college-educated workforce.
6
By taking an intersectional approach (Collins 2002; Crenshaw 1991), we can examine whether certain groups of males are more at risk for developing ‘oppositional’ attitudes towards school. It may be particular groups of oppressed males, specifically those from low SES or racial minority families, who are most at risk as they try to reduce negative feelings related to being alienated from dominant social institutions. It has been shown, for instance, that the socioeconomic composition of a school affects student attitudes towards education such that in high-poverty schools, oppositional attitudes towards school prevail (Farkas et al. 2002) and academic achievement is perceived as “acting high and mighty”, creating pressure on some students to curb their academic
effort (Tyson et al. 2005). Low SES and racial minority youth are much more likely to attend high-poverty schools (Orfield 2014). Other studies have shown that among higher-SES students, academic effort and achievement may be less stigmatized, particularly for males (Legewie & DiPrete 2012). These patterns of academic (dis)engagement are supported by other work that has examined student motivation—although motivation in school generally declines for all students as they advance through grade levels (Finn 1989), this decline in motivation can be particularly severe for low-SES and minority students, and for males specifically (Meece & Kurtz-Costes 2001; Taylor, Flickinger, Roberts, & Fulmore 1994; Wigfield, Eccles, Schiefele, Roeser, & Davis-Kean 2006).
Furthermore, males from low-income families may be more at risk for developing oppositional attitudes and behaviors than others as it has been shown that these
dispositions are most prevalent among economically disadvantaged groups of students (MacLeod 1987; Morris 2012; Willis 1977). Relatedly, adherence to traditional norms of masculinity (which promote anti-school attitudes and behaviors) is associated with ethnic
7
belonging and identity (Abreu, Goodyear, Campos, & Newcomb 2000; Levant, Majors, & Kelley 1998; Saez, Casado, & Wade 2010). The potential result is that the gender gap in higher education may be most evident among lower-class and racial minority students, because of these groups’ heightened likelihood of embracing traditional notions of
masculinity that marginalize academic effort and achievement.
The Gender Gap in Higher Education
In their seminal book, The Rise of Women: The Growing Gender Gap in Education and What it Means for American Schools, Thomas DiPrete and Claudia Buchmann (2013) chronicle the increasing participation of women in American higher education over the second half of the twentieth century, ultimately leading to females surpassing males in rates of college enrollment and completion. The authors argue that the male disadvantage in higher education that emerged, and that continues to persist (NCES 2016), is driven by males’ longstanding inferior academic performance, lower levels of academic effort, poorer social and behavioral skills, and lower levels of participation in extracurricular activities which further contributes to their educational detachment (DiPrete and Buchmann 2013). This is not to say that males are not advantaged in many, if not most, other areas of society, but that they are generally disadvantaged in regard to, specifically, educational attainment.
Other scholars, in their examination of the gender gap in college enrollment and completion, point to similar explanatory factors. Females’ higher average levels of academic achievement may help them to perceive a college degree as being more
8
their senior year of high school and are less likely to delay their college enrollment (Carbonaro, Ellison, & Covay 2011). Additionally, the better academic performance of females reduces the amount of effort required of them to prepare for college by aligning skills developed in high school to the more difficult academic demands of college courses (Goldin, Katz, Kuziemko 2006). Finally, females’ superior performance in school may have contributed to the changing gender trends in postsecondary participation,
particularly among low-income students, by encouraging them to take advantage of alternative pathways to a college degree (e.g.- 2-year to 4-year institution) as those opportunities expanded over time and became more accessible routes to a college degree (Flashman 2013; Kleinfeld 2009).
Related to this pattern of male underperformance, research finds boys exert less effort in school and to display more problematic behavior that interferes with their educational attainment (Carbonaro et al. 2011; Downey & Vogt Yuan 2005; Goldin et al. 2006; Jacob 2002; Lundy & Firebaugh 2005; Morris 2012). Their lack of effort also carries over to how males plan (or do not plan) for their education after high school. Male students have been found to be less likely to be enrolled in college prep courses
(Reynolds & Burge 2008), to apply to college during their senior year of high school (Carbonaro et al. 2011; Turley, Santos, & Ceja 2007), or to enroll in a postsecondary institute within a year of completing high school (Hirschman 2016). What’s more, the lower rates of college completion for low-SES and black students (Goldrick-Rab 2006; McDaniel, DiPrete, Buchmann, & Shwed 2011), could be the result of their increased likelihood to delay college enrollment for a year or more after high school graduation (Hearn 1992; Rowan-Kenyon 2007). Past research has demonstrated that a one-year
9
delay in college enrollment is associated with a 64% decrease in odds of completing a college degree (Bozick & DeLuca 2005), underlining the importance of understanding whether, and for whom, postsecondary plans differ at the end of high school regarding college enrollment.
Gender differences in students’ orientation towards education have also been examined as explanatory reasons for the gender gap in higher education. For example, some have shown that males generally have lower educational aspirations than females and are more likely to have postsecondary plans that do not include college, such as entering the military or attending a vocational school (Fortin, Oreopoulos, & Phipps 2015; Reynolds & Burge 2008). This could be because males are less likely to perceive their education as being important to their future jobs (Carbonaro et al 2011; Jacob 2002; Kleinfeld 2009). Furthermore, female students are more apt to connect their education to personal goals beyond just desired occupations, such as contributing positively to society or enhancing their personal lives (Kleinfeld 2009; Mickelson 2003). As a potential consequence, males students are reportedly less engaged in school—they are less likely to set as a priority getting good grades (Lundy & Firebaugh 2005) and less likely to profess to enjoy school (Jacob 2002; Kleinfeld 2009).
These gendered patterns in academic behavior and attitudes, stemming from problematic notions of masculinity, create relatively heightened barriers to continuing education after high school for males. Moreover, males from low-socioeconomic and racial minority backgrounds may be more at risk for not extending their education beyond high school as they are potentially more likely to embrace masculine identities and attitudes that do not promote academic engagement and success. Finally, given the
10
importance of transitioning directly into postsecondary education after high school, researchers should identify which groups of high school graduates are most likely not to be planning to continue their education in the following academic year. This thesis seeks to connect specific academic attitudes and school behaviors consistent with popular notions of masculinity (irrelevance of education; low levels of academic effort and engagement) to male students’ educational trajectories, relative to their female peers, at a
crucial point of transition in their lives. I also consider the role of students’ SES and racial/ethnic background on the decisions students make to continue, or not continue, their education immediately after high school.
In light of these previous findings, I propose the following hypotheses. First, I expect to find a gender gap favoring females regarding whether or not a student intends to continue their education immediately after high school graduation. Second, I expect that both race and socioeconomic status moderates the gender gap in these postsecondary intentions in that a larger gender gap exists among both lower-SES and racial minority students. Finally, it is expected that negative school attitudes and behaviors mediates the gender gap in postsecondary intentions favoring females in that male students exhibit more negative attitudes and behaviors resulting in lower rates of males intending to continue their education immediately after high school graduation. The first and second hypotheses will be examined using regression analysis and the third hypothesis will be tested using decomposition-mediation analysis (described below).
11
3. Conceptual Models and Research Questions
Mediation Model
12
This thesis proposes that gender predicts college education intentions for students, and that this relationship is mediated by differences in academic attitudes and behaviors. Males are expected to have more negative attitudes and behaviors, stemming from particular notions of masculinity, contributing to their lower rates of intending to continue their education immediately following high school graduation. Furthermore, I expect the relationship between student sex and postsecondary education intentions will also be moderated by students’ SES and their race/ethnicity. Among males, students from lower-SES and/or racial/ethnic minority backgrounds are expected to display worse academic attitudes and behaviors and, thus, even lower rates of intending to pursue postsecondary education.
Research Questions
1. Are there gender differences in postsecondary education intentions at the end of high school?
2. Does socioeconomic status or race moderate any gender differences in postsecondary education intentions?
3. Is any estimated effect of gender on postsecondary education intentions mediated by negative school attitudes and behaviors?
13
4. Data and Methods
Data Set
The High School Longitudinal Study of 2009 (HSLS:09) was implemented by the National Center for Education Statistics (NCES) to learn more about students’ high school experiences and their transitions into college and/or the workforce upon leaving secondary school. This nationally representative study includes over 25,000 sampled students, who were in the 9th grade in 2009, from 944 public and private high schools in the United States. Student surveys were administered in 2009, 2012, and in 2013, when most students had completed high school. In addition to student surveys, the NCES also surveyed one of their parents, math and science teachers, and school administrators and counselors in 2009 and 2012. The 2013 questionnaire collected information on the student only and could be completed by either the student or a parent. Information from students’ high school transcripts is also included in the data. This thesis uses data
gathered from students, parents, administrators, counselors during all three waves of data collection. The analytic sample for this thesis is limited to students not missing on the postsecondary education intentions variable (described below) and those whose reported race was white, black, or Hispanic. The total number of cases excluded from analysis, based on this criteria, was around 7,580, resulting in an analytic sample size of about 14,480. (NCES requires all unweighted frequencies be rounded to the nearest ten.) Table 1 provides descriptive statistics on all variables used in the study (Stata’s ‘survey’
command produces population rather than sample estimates). Mean/mode imputation used to address all missing values on independent variables.
14
Dependent Variable
Postsecondary Education Intentions. The dichotomous postsecondary education intentions variable relies on the question from the 2013 update survey that asked
respondents (students or parents) to indicate what “activities [will/were/was] [you/your
teenager] [be] doing on or around November 1st?” Respondents addressed multiple options including, among others, taking postsecondary classes, working for pay, and serving in the military. Students who had responses of “no” or “don’t know” to the “taking postsecondary classes” option were coded negatively, capturing students least
likely to advance in their education immediately after high school graduation. This wave of data, the most recent wave of data NCES has released, was collected between June and December 2013, after high school graduation for most sampled students (Ingels et al. 2015). However, around 85% of participants responded to the 2013 survey before November 1st. Thus, the HSLS users’ guide for the 2013 survey states “Data collected
from interviews before November 1 are predictive, whereas data collected on or after this date are based on actual experience” (Ingels et al. 2015, p.16). Nonetheless, since
students are describing actions they are planning to take in the near future, typically the result of steps beginning a year or more before (Cabrera & La Nasa 2000), and since students are usually notified of admission to 4-year colleges in the early spring of their enrollment year, these expectations are more likely to reflect actual enrollment then expectation-reports collected, for instance, at the beginning of high school. Although an extended discussion of the limitations related to this variable are discussed in the
15
students who were consciously planning for, and thus intending, postsecondary
enrollment in an educational institution immediately following high school graduation.
In order to improve the validity of the postsecondary education intentions variable, students were coded positively (given a value of 1) if, in addition to reporting taking postsecondary classes, respondents also reported the student had a high school credential and provided a postsecondary school name that was able to be matched to an institution in the NCES Integrated Postsecondary Education Data System (IPEDS). Students were not separated by full-time/part-time status, nor by the level of their reported institution (i.e., less than 2-year, 2-year, 4-year), since no meaningful sex differences were discovered among these variables during preliminary analysis.
Independent Variables
Gender. Students’ gender was taken from a composite variable constructed by
NCES and included with the wave two (2012) data. This variable incorporates wave two survey responses regarding student sex with wave one (2009) survey responses to resolve cases with missing data. Responses were limited to only two options, “male” or “female.” While I acknowledge the problems associated with substituting the term ‘gender’ for ‘sex’, I use the former throughout this thesis in order to remain consistent with the prior
literature. A fuller discussion on the limitations of this variable is included in the Limitations section. Lastly, I imputed around fifty cases who were still missing on the 2012 composite variable with the mode (men).
Race. Reports of students’ race comes from another composite variable in the
16
the 2009 base year survey, or from the 2012 survey if this response was missing on the 2009 survey. I imputed for students missing on both measures (n=960), using the variable’s mode, white. Possible responses included: “American Indian/Alaskan Native,
non-Hispanic”; “Asian, non-Hispanic”; “Black/African-American, non-Hispanic”; “Hispanic, no race specified”; “Hispanic, race specified”; “More than one race, non-Hispanic”; “Native Hawaiian/Pacific Islander, non-non-Hispanic”; “White, non-Hispanic.” I combined the two Hispanic categories into a single group, while the “American
Indian/Alaskan Native”, “More than one race”, and “Native Hawaiian/ Pacific Islander” responses were collapsed into an “Other” category.
Socioeconomic Status. Information on students’ socioeconomic status (SES)
comes from the continuous NCES-constructed composite variable from the 2009 base year survey. This variable combines five measures regarding parents’ education level, parents’ occupation prestige score, and family income which the NCES then derived
estimated means and standard deviations from to create a single, continuous variable (Ingels et al. 2011). When comparing high-SES and low-SES students, a second NCES-constructed variable was used which separated students into five quintiles based on their score on the aforementioned continuous SES variable.
Negative School Attitude Scale. In order to measure how student attitudes towards school affects their performance and trajectory after graduation, I created a scale variable combining five measures from the base year survey (alpha=0.70). The five measures used to create school attitude variable were: “9th grader feels school is often a waste of time”,
“Getting good grades is important to 9th grader”, “9th grader thinks studying in school
17
get into college”, and “9th grader thinks studying in school rarely pays off later with good job.” All variables were measured on a scale ranging from 1 (Strongly agree) to 4
(Strongly disagree). The second variable (“Getting good grades is important to 9th
grader”) was reverse-coded so that higher values represented a more negative attitude and
was thus consistent with the other four variables. Higher values on this scale indicate more negative attitudes towards school and was standardized to a mean of 0 and standard deviation of 1.
Negative School Behavior Scale. The student behavior scale is an NCES
composite variable combining four measures of students’ in-school behavior: “How often
9th grader goes to class without their homework done”; “How often 9th grader goes to class without pencil or paper”; “How often 9th grader goes to class without books”; “How often 9th grader goes to class late.”Possible responses ranged from 1 (Never) to 4
(Often), with higher scores thus indicating more negative school behavior. The scale is reported to have an alpha of 0.67 (Ingels et al. 2011) and is standardized to a mean of 0 and standard deviation of 1.
Control Variables
In order to better meet the assumptions of multilevel regression models, several school-level control variables are used in my regression analysis, including
decomposition-mediation. These include school type, urbanicity, and geographic region. Also included are measures of the percent of students receiving free or reduced-price lunches, percent of ninth graders repeating the ninth grade, administrator’s assessment of school climate, and counselor’s perception of teacher’s, other counselor’s, and principal’s
18
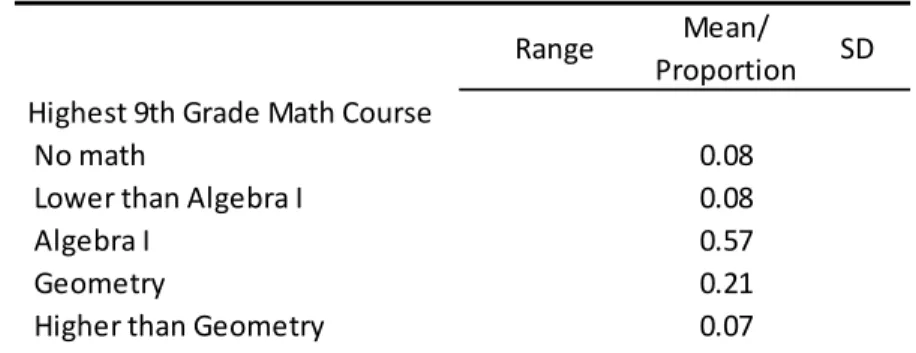
expectations. Finally, parental marital status, students’ overall high school grade point average, and the following measures of ninth grade achievement are also included in my regression and decomposition-mediation analysis: ninth-grader’s score on the NCES math assessment exam, ninth-grader’s fall 2009 math class, and the highest math course taken during ninth grade. Where appropriate, mean imputation was used to address missing data for control variables.
Analytic Plan
To facilitate interpretation of multivariate results, I first use descriptive statistics to show differences by gender, race, and SES in students’ attitudes and behaviors (this study’s mediators). High- and low-SES are defined as students falling in the top-two or
bottom-two SES quintiles, respectively. Students in the middle, or third, quintile were excluded just for these analyses, such that the sample size for this table is around 14,060. I use multilevel, mixed-effects regression analysis to address my first and second
research questions of whether a male disadvantage in postsecondary intentions exists at the end of high school and, if so, if it is moderated by SES or minority status. Because the clustering of adolescents within schools violates the assumption of independent errors, I use these multilevel models to improve estimates of standard errors (Bollen and Brand 2010). In addressing independence issues with clustered/ multilevel data, it has been proposed that multilevel modeling is a better analytical approach than clustering standard errors since multilevel modeling offers a ‘stronger’ form of correction (UCLA Statistical
Consulting Group 2013). As suggested by Clarke et al. (2010), I include school level controls to increase the likelihood of meeting the assumptions of these models. Since
19
there is no consensus among researchers that weights should be used in regression
analyses (Solon, Haider and Wooldridge 2013; Young and Johnson 2012), the wave three (2013) student analytic weight is only used for descriptive statistics.
I begin my analysis by regressing the dependent variable with the male variable to estimate baseline sex differences in expressing postsecondary intentions at the end of high school. In the second regression model, I add the SES and race variables to establish their main effects before introducing interactions in the next two models. The third model includes an interaction term between the male variable and the race variable to determine whether and how race moderates the estimated effect of gender on postsecondary
education intentions. Finally, I add an interaction term in the fourth model to determine whether and how SES moderates the estimated effect of gender on postsecondary education intentions. To facilitate interpretation of the interaction, a figure displays predicted probabilities post-estimated from the third regression model. Results from the fourth model are not displayed graphically because the interaction between SES and gender was not statistically significant.
To investigate the third research question, whether negative school attitudes and behaviors mediate the estimated effect of being male on postsecondary education intentions, I utilize Kohler, Karlson, and Holm’s (2011) decomposition-mediation
technique. This method, based in regression modeling, estimates the mediating effect size of specific independent variables and produces more intuitive results (in terms of
percentages rather than regression coefficients). In this way, the method responds to suggestions of researchers to shift the focus from statistical to substantial significance (Healy & Moody 2014). Furthermore, this method addresses scaling issues that occur
20
when comparing coefficients across logistic models to estimate mediation (Mood 2010) and accounts for the influence of other mediators and controls (Kohler et al. 2011). Since SES did not significantly differentiate the relationship between gender and postsecondary education intentions, these analyses are only stratified by race to understand whether there are race differences in how attitudes and behaviors mediate the effect of gender on postsecondary education intentions. Variables used in my decomposition-mediation analysis include the dependent variable, postsecondary enrollment intentions; gender; and both proposed mediators, negative school attitudes and negative school behaviors. SES is included as a control variable as are all other control variables described above.
21
5. Results
Gender, Race, and SES Differences in Attitudes and Behaviors
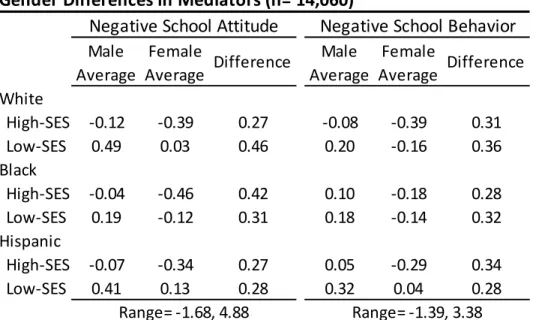
Table 2 looks at race and SES variation in gender differences in average scores on the negative attitude and negative behavior scales. As a reminder, both scales have been standardized, facilitating comparisons across subgroups. Consistent with the literature, males from all three racial groups have markedly higher values on these scales than their female counterparts, indicating worse school attitudes and behaviors. Low-SES white males had the highest mean value on the attitude scale, 0.49, followed by low-SES Hispanic males, 0.41. Among females, low-SES Hispanics had the highest mean score on the attitude scale, 0.13. The largest gender differences, as far as negative school attitudes, were found among low-SES whites and high-SES blacks. Low-SES white students had a sex difference of 0.46 on their attitude scales (0.49 – 0.03) and high-SES blacks had a sex difference of 0.42 (-0.04 – [-0.46]). Additionally, we observed substantial differences between high-SES and low-SES students, with low-SES students displaying worse attitudes and behaviors among all race-sex groups.
On the negative behavior scale, the highest mean value was held by low-SES Hispanic males (0.32) and low-SES white males (0.20). Similar to attitudes, low-SES female Hispanics reported the worst behavior among all female groups with a score of 0.04. While the gender differences in negative school behaviors are more uniform, the largest gender differences are found among low-SES whites and high-SES Hispanics. Low-SES whites had a gender difference of 0.36 on the negative attitude scale and high-SES Hispanics had a gender difference of 0.34.
22
Odds of Expressing Postsecondary Education Intentions
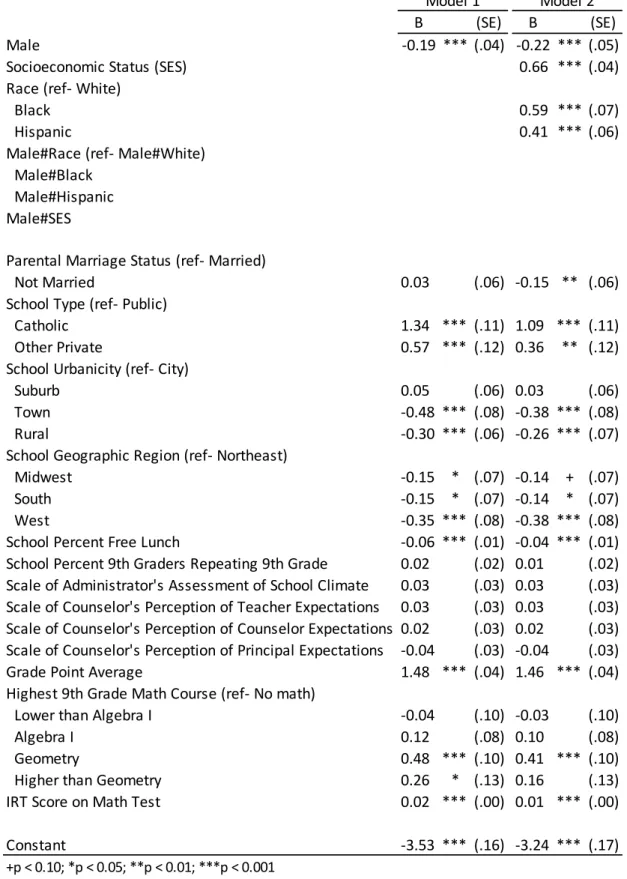
Tables 3a and 3b presents log odds from mixed-effects regression analysis to explore whether class or race moderate the relationship between gender and
postsecondary education intentions. Model 1 shows that, for males, the log odds of having postsecondary education intentions are 0.19 lower than females, which is
statistically significant, establishing that a gender gap in the dependent variable exists in the analytic sample and confirming my first hypothesis.
The second model displays the main effects of SES and race. With every one-unit increase in SES, the log odds of intending to pursue postsecondary education increases by 0.66. With white students as the reference group, black students’ log odds of expressing postsecondary education intentions are 0.59 higher while Hispanics’ are 0.41 higher.
Furthermore, Model 2 indicates males continue to have lower log odds of postsecondary education intentions even after controlling for SES and race.
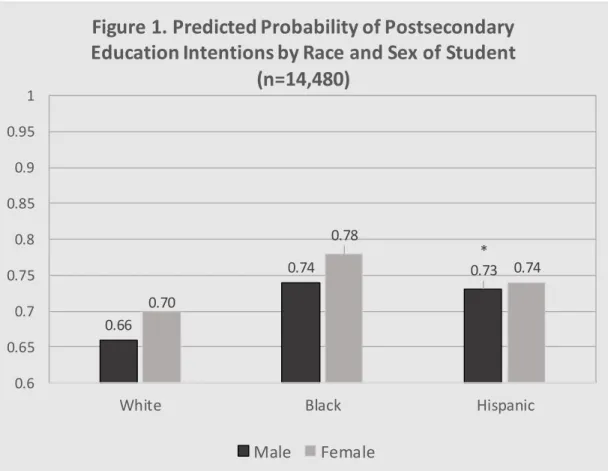
Model 3 in Table 3b introduces an interaction term between the male variable and the race variable to explore whether gender moderates the estimated effect of being male on postsecondary education intentions. The male coefficient in this model is relevant for white males, showing log odds of intending postsecondary education 0.27 lower on average than those for white females. Model 3 also shows that the log odds of intending postsecondary education are 0.60 higher on average for black students than those for white students. However, in addition to the disadvantage of being male (-0.27) and the advantage of being black (0.60), the log odds of intending a postsecondary education are 0.02 lower for black males than for white males. Though, since this interaction was not
23
statistically significant, we cannot conclude that this is true for the entire population of US students who were in 9th grade in 2009.
Finally for Model 3, Hispanics have, on average, 0.30 higher log odds than whites in postsecondary education intentions. In addition to this race advantage, Hispanic males experience a male disadvantage in postsecondary education intentions (-0.27) and an advantage relative to white males related to both their race and sex (0.23). This interaction was statistically significant so it appears that among the population of US students who were in 9th grade in 2009, Hispanic males were, on average, more likely
(0.30+(-0.27)+0.23=0.26 log odds) than white males to express intentions of pursuing postsecondary education, controlling on SES .
Model 4 includes an interaction term between the male and SES variables to determine whether SES moderates the gender disparity in postsecondary education intentions. In a first main effect, controlling on race, males continue to be disadvantaged vis-à-vis females in postsecondary education intentions, displaying 0.24 lower log odds. We do, however, see that SES effects the likelihood of expressing postsecondary
education intentions differently for males and females. For females, with every one-unit increase in SES, the log odds of expressing postsecondary education intentions increases by 0.72. Males, on the other hand, benefit less from higher SES. In terms of log odds, the male benefit from higher SES is 0.11 log odds lower than that for females. However, since this interaction failed to reach statistical significance, I cannot confirm my hypothesis which states lower SES male students are more disadvantaged compared to their female counterparts in postsecondary education intentions than higher SES male students.
24
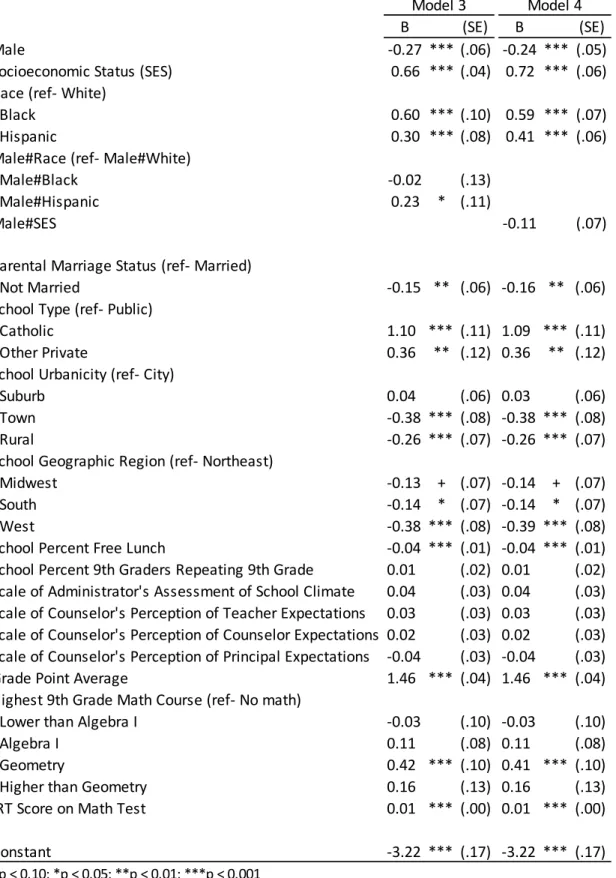
Figure 1 shows predicted probabilities of intending postsecondary education by gender and race estimated from the third regression model. We can quickly see that male graduates in each racial group are disadvantaged in postsecondary education intentions. Black and white males are equally disadvantaged compared to their female counterparts, although black adolescents, in general, have a higher probability of expressing
postsecondary education intentions. The predicted probability of a black male expressing postsecondary education intentions is 0.74, while for black females it is 0.78. For white high school graduates, the predicted probability of expressing postsecondary education intentions is 0.66 for males and 0.70 for females. Hispanic graduates show almost no gender difference in postsecondary education intentions. Hispanic males have a predicted probability of 0.73 while Hispanic females have predicted probability of 0.74. These results clearly show that minority male students are not less likely to express
postsecondary education intentions, relative to their female counterparts, than white males. I thus reject my second hypothesis.
Finally, the results of the decomposition-mediation analysis is presented in Table 4. This analysis estimates the extent to which negative attitudes and behaviors mediate the effect of student sex on postsecondary education intentions. Recall that Table 2 showed that all males had more negative attitudes and behaviors than females across all race and SES groups. For white students, negative school attitudes accounted for 15.5% of the gender differences in postsecondary education intentions while negative school behaviors accounted for just 0.3%. Black students’ negative school attitudes explained
21.6% of the male disadvantage in postsecondary education intentions while negative school behaviors was not a mediator for this group. Negative school attitudes accounted
25
for 86.5% of the gender differences in postsecondary education intentions among
Hispanic students and negative school behaviors accounted for 44.8%. Considering these findings, I cannot fully confirm my third hypothesis that negative school attitudes and behaviors mediates the male disadvantage in postsecondary education intentions.
26
6. Conclusion
This thesis sought to answer the following research questions: Are there gender differences in postsecondary education intentions at the end of high school; Does
socioeconomic status or race moderate any gender differences in postsecondary education intentions and; Is any estimated effect of gender on postsecondary education intentions mediated by negative school attitudes and behaviors? While I found evidence of a female advantage in postsecondary education intentions among the overall HSLS:09 student sample, this advantage was drastically smaller among Hispanic students. Between the two mediators considered in this paper, student attitudes had the larger effect on gender differences in postsecondary education intentions.
In regard to the first question, I did find evidence that the female advantage in the immediate transition into higher education has persisted well into the 21st century.
Among students who were in the ninth grade in 2009, a significantly higher number of females indicated at the end of high school that they intend on pursuing postsecondary education immediately after high school than males. In effect, many male high school students are severely harming their chances of attaining a college degree. Bozick and DeLuca (2005) found that even for students who delay college enrollment for just one year, the odds of completing a Bachelor’s degree are 64 percent lower. Similarly, a
recent Georgetown University report estimated that almost two-thirds of all jobs in the US will require some type of postsecondary education by the year 2020, and that the US will fall short of this demand by almost five million workers (Carnevale, Smith and Strohl 2013).
27
Beyond economic consequences, contemporary research has also found that it is now more common, among heterosexual married couples, for the wife to have a higher level of education and to earn more than her husband (Van Bavel, Schwartz, & Esteve 2018). While this research did not find any evidence that these marriages are less stable or more unequal in the distribution of housework (Van Bavel et al. 2018), these emerging patterns provide additional evidence of an increasing male disadvantage in educational and occupational outcomes.
While my results could not confirm whether SES impacted the relationship between gender and postsecondary education intentions, I was able to conclude that race/ethnicity did. The male disadvantage in postsecondary education intentions was significantly smaller for Hispanic adolescents than those for white or black adolescents. This finding aligns with a recent report from the Pew Hispanic Center which found that overall rates of college enrollment immediately after high school have become higher for Hispanic graduates than those for either white or black graduates (Fry and Taylor 2013). Additionally, it also clarifies that this trend of rising college enrollment rates for Hispanic students is not concentrated among Hispanic females.
Lastly, I investigated whether negative school attitudes and behaviors mediated the effect of gender on postsecondary education intentions. Negative attitudes contributed more to the relationship between student gender and postsecondary education intentions than negative behaviors for all three race/ethnic groups, although both attitudes and behaviors mattered more for Hispanic students than for white and black youth. Negative school attitudes contributed the least to gender differences observed among white students, indicating that even though they may not see their education as particularly
28
useful to their futures, white students may still feel that continuing their education beyond high school is a more appropriate path for them. In this way, racial and ethnic patterns of postsecondary enrollment may perpetuate implicit notions of white racial privilege, a charge that has been levied against higher education elsewhere (Carnevale and Strohl 2013). Finally, negative school behaviors had a negligible contribution on gender differences in postsecondary education intentions for white and black adolescents, but played a substantial role in the postsecondary education intentions of Hispanic youth, perhaps suggesting that behaviors indicating school disengagement (showing up to class unprepared or late) is more detrimental for them than for white or black students.
29
7. Discussion
Despite behaving more poorly in school, possessing more negative and
oppositional academic attitudes, and performing worse in the classroom (Buchmann and DiPrete 2006; Mickelson 1989; Morris 2012; Willis 1977), males have historically been able to rely on their social privilege for success in the job market. At the same time, women have, and continue to, face discrimination in the labor market and to be denied many opportunities for social mobility even as their rates of educational attainment have surpassed those of males. However, these economic patterns may be changing. With cultural shifts in favor of gender equality, and as college degrees are increasingly required for many jobs, women have increasingly been able to convert their college degrees into more lucrative job opportunities. A recent report from the US Census Bureau, for example, shows that since 1975, more young women (25-34) are earning an income above the national median and fewer are in jobs that put them in the lowest income category (Vespa 2017). Furthermore, the report also states that a higher
proportion of young males (25-34) are represented among the lowest earners, compared to 40 years ago, and are more likely to neither be working nor in school (Vespa 2017). For young males in the US, their lower rates of college participation, which I have suggested is partially a consequence of poorer attitudes and behavior in high school, may be hurting them on today’s job market.
Lastly, this thesis suggests that the gender gap in higher education looks different among Hispanic students compared to white or black students. Hispanics are the largest minority group in the US and are predicted to be the third fastest-growing population over the next fifty years (Vespa, Armstrong and Medina 2018). My results suggest that
30
while students from other racial/ethnic groups continue to see a female advantage in college participation, this is less true for Hispanic students. Additionally, the finding that Hispanic students are more likely to intend to continue their education immediately after high school compared to whites is complicated by their increased likelihood of attending high-poverty schools compared to white and Asian students (Orfield 2014). Previous research has associated attendance in schools with a large concentration of low-income students with poorer academic attitudes that can possibly inhibit educational commitment (Farkas et al. 2002; Tyson et al. 2005). Future research should explore these conflicting findings further and attempt to identify the mechanisms that contribute to college-going behavior among Hispanic students.
31
8. Limitations
This research did have certain limitations, particularly regarding variable
measurement and data availability. First, while others have used the HSLS:09 data set to describe the college enrollment patterns of the student sample in 2013 (Schneider & Saw 2016), I decided it is more appropriate to describe this dataset’s available measure as student’s postsecondary education intentions. First, as I have previously mentioned, the
timing of the 2013 survey for most of the sampled participants occurred between June and August, making responses related to college enrollment ‘predictive’ rather than ‘actual’ (Ingels et al. 2015). Second, a comparison of postsecondary enrollment rates
between the HSLS:09 sample and rates from the Bureau of Labor Statistics (BLS) for 2013, which is based on reports of actual enrollment from the October 2013 Current Population Survey, reveals discrepancies between the two sources. For example, BLS (2014) reported that 65.9% of 2013 high school graduates were enrolled in some form of postsecondary education while the NCES reported that 73.4% of the HSLS sample who were high school graduates were taking postsecondary classes (Dalton, Ingels and Fritch 2016). Finally, the third wave of data collection for the HSLS:09 included only one survey, which NCES allowed either the student or one of their parents to complete. As parents were nearly as likely as students to respond, we are forced to assume parents had accurate information regarding their child’s educational plans.
A second limitation concerns the measurement of the student sex/gender variable. Gender is central to the motivation for this thesis. The binary nature of this survey
question (male/female) means we have no information regarding the educational behaviors, attitudes, or trajectories of transsexual, binary, and other gender
non-32
conforming students. These students, as well as others under the LGBTQ+ umbrella, may have unique educational experiences compared to their cis-gendered peers and may react differently to pressures to conform to masculine or feminine stereotypes (Greytak, Kosciw and Diaz 2009). Future research should seek out information regarding this population of students and examine whether they experience post-secondary transitions differently from their peers.
Finally, due to limitations in data availability, I was not able to follow students beyond 2013, the year they graduated high school. In this way, I can make no assessment on how many students who do not continue to college immediately after high school eventually do, nor on how many students who transition ‘on-time’ drop out of college before receiving a degree. While I have emphasized the importance of transitioning to college directly from high school, the fact that the number of older, non-traditional college students is expected to rise over the next several years (Snyder, De Brey and Dillow 2018), and that this group of students deserves to be studied in its own right, cannot be ignored. Future researchers should take advantage of the next wave of HSLS:09 data to be released by NCES to track students’ progress further into their
33
9. Tables and Figures
Range Mean/
Proportion SD
Sex
Male 0.50
Socioeconomic Status (SES) (-1.93, 2.57) 0.08 (0.76)
Race White 0.69 Black 0.12 Hispanic 0.19 Postsecondary Education Intentions Yes 0.70
Negative School Attitude Scale (-1.68, 4.88) -0.04 (1.03)
Negative School Behavior Scale (-1.39, 3.38) -0.08 (0.92)
Grade Point Average (0,4) 2.78 (0.79)
Parental Marriage Status
Married 0.82 Not Married 0.18 School Type Public 0.80 Catholic 0.12 Other Private 0.07 School Urbanicity City 0.29 Suburb 0.36 Town 0.12 Rural 0.24
School Geographic Region
Northeast 0.16
Midwest 0.28
South 0.41
West 0.16
34
Range Mean/
Proportion SD School Percent Free Lunch
0% 0.22 >0%, <10% 0.08 10%, <20% 0.11 20%, <30% 0.13 30%, <40% 0.12 40%, <50% 0.10 50%, <60% 0.09 60%, <70% 0.08 70%, <80% 0.04 80%, <90% 0.02 90%, <100% 0.01 100% 0.003
School Percent 9th Graders Repeating 9th Grade 0% 0.46 >0%, <5% 0.25 5%, <10% 0.12 10%, <15% 0.09 15%, <20% 0.03 20% or more 0.05 Scale of Administer's
Assessment of School Climate (-4.22, 1.97) -0.33 (0.93) Scale of Counselor's Perception
of Teacher Expectations (-4.92, 1.56) 0.01 (0.98)
Scale of Counselor's Perception
of Counselor Expectations (-6.43, 1.15) 0.06 (0.98)
Scale of Counselor's Perception
of Principal Expectations (-5.51, 1.10) 0.09 (0.93)
IRT Score on Math Test (15.85, 69.93) 40.62 (11.18)
35
Range Mean/
Proportion SD
Highest 9th Grade Math Course
No math 0.08
Lower than Algebra I 0.08
Algebra I 0.57
Geometry 0.21
Higher than Geometry 0.07
36 Male Average Female Average Difference Male Average Female Average Difference White High-SES -0.12 -0.39 0.27 -0.08 -0.39 0.31 Low-SES 0.49 0.03 0.46 0.20 -0.16 0.36 Black High-SES -0.04 -0.46 0.42 0.10 -0.18 0.28 Low-SES 0.19 -0.12 0.31 0.18 -0.14 0.32 Hispanic High-SES -0.07 -0.34 0.27 0.05 -0.29 0.34 Low-SES 0.41 0.13 0.28 0.32 0.04 0.28
Table 2. Race and Socioeconomic Status (SES) Variation in Gender Differences in Mediators (n= 14,060)
Range= -1.68, 4.88 Range= -1.39, 3.38
Negative School Behavior Negative School Attitude
37
B (SE) B (SE)
Male -0.19 *** (.04) -0.22 *** (.05)
Socioeconomic Status (SES) 0.66 *** (.04)
Race (ref- White)
Black 0.59 *** (.07)
Hispanic 0.41 *** (.06)
Male#Race (ref- Male#White) Male#Black
Male#Hispanic Male#SES
Parental Marriage Status (ref- Married)
Not Married 0.03 (.06) -0.15 ** (.06)
School Type (ref- Public)
Catholic 1.34 *** (.11) 1.09 *** (.11)
Other Private 0.57 *** (.12) 0.36 ** (.12)
School Urbanicity (ref- City)
Suburb 0.05 (.06) 0.03 (.06)
Town -0.48 *** (.08) -0.38 *** (.08)
Rural -0.30 *** (.06) -0.26 *** (.07)
School Geographic Region (ref- Northeast)
Midwest -0.15 * (.07) -0.14 + (.07)
South -0.15 * (.07) -0.14 * (.07)
West -0.35 *** (.08) -0.38 *** (.08)
School Percent Free Lunch -0.06 *** (.01) -0.04 *** (.01)
School Percent 9th Graders Repeating 9th Grade 0.02 (.02) 0.01 (.02)
Scale of Administrator's Assessment of School Climate 0.03 (.03) 0.03 (.03) Scale of Counselor's Perception of Teacher Expectations 0.03 (.03) 0.03 (.03) Scale of Counselor's Perception of Counselor Expectations 0.02 (.03) 0.02 (.03) Scale of Counselor's Perception of Principal Expectations -0.04 (.03) -0.04 (.03)
Grade Point Average 1.48 *** (.04) 1.46 *** (.04)
Highest 9th Grade Math Course (ref- No math)
Lower than Algebra I -0.04 (.10) -0.03 (.10)
Algebra I 0.12 (.08) 0.10 (.08)
Geometry 0.48 *** (.10) 0.41 *** (.10)
Higher than Geometry 0.26 * (.13) 0.16 (.13)
IRT Score on Math Test 0.02 *** (.00) 0.01 *** (.00)
Constant -3.53 *** (.16) -3.24 *** (.17)
+p < 0.10; *p < 0.05; **p < 0.01; ***p < 0.001
Table 3a. Log Odds from Mixed-Effects Logistic Regression Predicting Postsecondary Education Intentions, Models 1-2 (n= 14,480)
38
B (SE) B (SE)
Male -0.27 *** (.06) -0.24 *** (.05)
Socioeconomic Status (SES) 0.66 *** (.04) 0.72 *** (.06)
Race (ref- White)
Black 0.60 *** (.10) 0.59 *** (.07)
Hispanic 0.30 *** (.08) 0.41 *** (.06)
Male#Race (ref- Male#White)
Male#Black -0.02 (.13)
Male#Hispanic 0.23 * (.11)
Male#SES -0.11 (.07)
Parental Marriage Status (ref- Married)
Not Married -0.15 ** (.06) -0.16 ** (.06)
School Type (ref- Public)
Catholic 1.10 *** (.11) 1.09 *** (.11)
Other Private 0.36 ** (.12) 0.36 ** (.12)
School Urbanicity (ref- City)
Suburb 0.04 (.06) 0.03 (.06)
Town -0.38 *** (.08) -0.38 *** (.08)
Rural -0.26 *** (.07) -0.26 *** (.07)
School Geographic Region (ref- Northeast)
Midwest -0.13 + (.07) -0.14 + (.07)
South -0.14 * (.07) -0.14 * (.07)
West -0.38 *** (.08) -0.39 *** (.08)
School Percent Free Lunch -0.04 *** (.01) -0.04 *** (.01)
School Percent 9th Graders Repeating 9th Grade 0.01 (.02) 0.01 (.02)
Scale of Administrator's Assessment of School Climate 0.04 (.03) 0.04 (.03) Scale of Counselor's Perception of Teacher Expectations 0.03 (.03) 0.03 (.03) Scale of Counselor's Perception of Counselor Expectations 0.02 (.03) 0.02 (.03) Scale of Counselor's Perception of Principal Expectations -0.04 (.03) -0.04 (.03)
Grade Point Average 1.46 *** (.04) 1.46 *** (.04)
Highest 9th Grade Math Course (ref- No math)
Lower than Algebra I -0.03 (.10) -0.03 (.10)
Algebra I 0.11 (.08) 0.11 (.08)
Geometry 0.42 *** (.10) 0.41 *** (.10)
Higher than Geometry 0.16 (.13) 0.16 (.13)
IRT Score on Math Test 0.01 *** (.00) 0.01 *** (.00)
Constant -3.22 *** (.17) -3.22 *** (.17)
+p < 0.10; *p < 0.05; **p < 0.01; ***p < 0.001
Table 3b. Log Odds from Mixed-Effects Logistic Regression Predicting Postsecondary Education Intentions, Models 3-4 (n= 14,480)
39 Note: "--" denotes variable was not a mediator
n=14,480
*Variables include Postsecondary Education Intentions; Gender; Negative School Behavior Scale; Negative School Attitude Scale; SES (control); All control variables
Negative Behavior 0.3% -- 44.8%
Table 4. The Extent to Which Negative Attitudes and Behaviors Mediate the Effect of being Male on Postsecondary Education Intentions by Race
White (n=9,980) Black (n=1,770) Hispanic (n=2,730)
40 0.66 0.74 * 0.73 0.70 0.78 0.74 0.6 0.65 0.7 0.75 0.8 0.85 0.9 0.95 1
White Black Hispanic
Figure 1. Predicted Probability of Postsecondary
Education Intentions by Race and Sex of Student
(n=14,480)
Male Female
Results from Regression Model 3 (Table 3b) +p < 0.10; *p < 0.05; **p < 0.01; ***p < 0.001
41
10. References
Abreu, Jose M, Rodney K Goodyear, Alvaro Campos, and Michael D Newcomb. 2000. "Ethnic Belonging and Traditional Masculinity Ideology among African
Americans, European Americans, and Latinos." Psychology of Men & Masculinity 1(2):75.
Bollen, Kenneth A., and Jennie E. Brand. 2010. "A General Panel Model with Random and Fixed Effects: A Structural Equations Approach." Social Forces 89(1):1-34. Bozick, Robert, and Stefanie DeLuca. 2005. "Better Late Than Never? Delayed
Enrollment in the High School to College Transition." Social Forces 84:527-50. Brannon, Robert. 1976. "The Male Sex Role: Our Culture's Blueprint of Manhood, and
What It's Done for Us Lately." Pp. 1-48 in The Forty-Nine Percent Majority: The Male Sex Role, edited by Robert Brannon and Deborah David. Reading, MA: Addison-Wesley.
Buchmann, Claudia, and Thomas A. DiPrete. 2006. "The Growing Female Advantage in College Completion: The Role of Family Background and Academic
Achievement." American Sociological Review 71(4):515-41.
Bureau of Labor Statistics. 2014. "College Enrollment and Work Activity of 2013 High School Graduates." Washington, DC.
Cabrera, Alberto F, and Steven M La Nasa. 2000. "Understanding the College‐Choice Process." New directions for institutional research 2000(107):5-22.
Carbonaro, William, Brandy J Ellison, and Elizabeth Covay. 2011. "Gender Inequalities in the College Pipeline." Social Science Research 40(1):120-35.
Carnevale, Anthony P, Nicole Smith, and Jeff Strohl. 2013. Recovery: Job Growth and Education Requirements through 2020: Georgetown University Center on Education and the Workforce.
Carnevale, Anthony Patrick, and Jeff Strohl. 2013. Separate and Unequal: How Higher Education Reinforces the Intergenerational Reproduction of White Racial Privilege: Georgetown University Center on Education and the Work Force. Clarke, Paul, Claire Crawford, Fiona Steele, and Anna Vignoles. 2010. The Choice
between Fixed and Random Effects Models: Some Considerations for Educational Research (Doqss Working Paper No. 10-10). London, UK:
Department of Quantitative Social Science, Institute of Education, University of London.
Collins, Patricia Hill. 2002. Black Feminist Thought: Knowledge, Consciousness, and the Politics of Empowerment: Routledge.
Connell, Raewyn W. 1987. Gender and Power: Society, the Person and Sexual Politics. Cambridge: Polity Press.
Coston, Bethany M, and Michael Kimmel. 2012. "Seeing Privilege Where It Isn’t: Marginalized Masculinities and the Intersectionality of Privilege." journal of Social Issues 68(1):97-111.
Crenshaw, Kimberlé Williams. 1991. "Mapping the Margins: Intersectionality, Identity Politics, and Violence against Women of Color." Stanford Law Review
42
Dalton, Ben, Steven J Ingels, and Laura Fritch. 2016. High School Longitudinal Study of 2009 (Hsls: 09) 2013 Update and High School Transcript Study: A First Look at Fall 2009 Ninth-Graders in 2013 (Nces 2015-037rev). Washington, DC: National Center for Education Statistics.
Downey, Douglas B, and Anastasia S Vogt Yuan. 2005. "Sex Differences in School Performance During High School: Puzzling Patterns and Possible Explanations."
The Sociological Quarterly 46(2):299-321.
Erikson, Erik H. 1993. Childhood and Society: WW Norton & Company.
Farkas, George, Christy Lleras, and Steve Maczuga. 2002. "Does Oppositional Culture Exist in Minority and Poverty Peer Groups?" American Sociological Review
67(1):148-55.
Fine, Michelle, Lois Weis, Judi Addelston, and Julia Marusza. 1997. "Secure Times: Constructing White Working-Class Masculinities in the Late 20th Century."
Gender & Society 11(1):52-68.
Finn, Jeremy D. 1989. "Withdrawing from School." Review of Educational Research
59(2):117-42.
Flashman, Jennifer. 2013. "A Cohort Perspective on Gender Gaps in College Attendance and Completion." Research in Higher Education 54(5):545-70.
Fordham, Signithia, and John U. Ogbu. 1986. "Black Students’ School Success: Coping with the Burden of 'Acting White'." The Urban Review 18(3):176-206.
Fortin, Nicole M, Philip Oreopoulos, and Shelley Phipps. 2015. "Leaving Boys Behind Gender Disparities in High Academic Achievement." Journal of Human
Resources 50(3):549-79.
Fry, Richard, and Paul Taylor. 2013. Hispanic High School Graduates Pass Whites in Rate of College Enrollment. Washington, DC: Pew Hispanic Center.
Goldin, Claudia, Lawrence F Katz, and Ilyana Kuziemko. 2006. "The Homecoming of American College Women: The Reversal of the College Gender Gap." Journal of Economic Perspectives 20(4):133-56.
Goldrick-Rab, Sarah. 2006. "Following Their Every Move: An Investigation of Social-Class Differences in College Pathways." Sociology of Education 79(1):61-79. Greytak, Emily A., Joseph G. Kosciw, and Elizabeth M. Diaz. 2009. Harsh Realities: The
Experience of Transgender Youth in Our Nation's Schools. New York: GLSEN. Healy, Kieran, and James Moody. 2014. "Data Visualization in Sociology." Annual
Review of Sociology 40:105-28.
Hearn, James C. 1992. "Emerging Variations in Postsecondary Attendance Patterns: An Investigation of Part-Time, Delayed, and Nondegree Enrollment." Research in Higher Education 33(6):657-87.
Hirschman, Charles. 2016. From High School to College: Gender, Immigrant Generation, and Race-Ethnicity. New York: Russell Sage Foundation.
Hochschild, Arlie Russell. 2016. Strangers in Their Own Land: Anger and Mourning on the American Right. New York: The New York Press.
Ingels, SJ, DJ Pratt, DR Herget, M Bryan, LB Fritch, R Ottem, JE Rogers, and D Wilson. 2015a. "High School Longitudinal Study of 2009 (Hsls: 09) 2013 Update and High School Transcript Data File Documentation (Nces 2015-036)." National
43
Center for Education Statistics, Institute of Education Sciences, US Department of Education. Washington, DC.
Ingels, Steven J, Daniel J Pratt, Deborah R Herget, Laura J Burns, Jill A Dever, Randolph Ottem, James E Rogers, Ying Jin, and Steve Leinwand. 2011. "High School Longitudinal Study of 2009 (Hsls: 09): Base-Year Data File Documentation. Nces 2011-328." National Center for Education Statistics.
Ingels, Steven J., Daniel J. Pratt, Deborah R. Herget, Michael Bryan, Laura Burns Fritch, Randolph Ottem, James E. Rogers, and David Wilson. 2015b. High School Longitudinal Study of 2009 (Hsls:09) 2013 Update and High School Transcript Data File Documentation (Nces 2015-036). Washington, DC: National Center for Education Statistics.
Jackson, Carolyn, and Steven Dempster. 2009. "‘I Sat Back on My Computer… with a Bottle of Whisky Next to Me’: Constructing ‘Cool’masculinity through
‘Effortless’ Achievement in Secondary and Higher Education." Journal of Gender Studies 18(4):341-56.
Jacob, Brian A. 2002. "Where the Boys Aren't: Non-Cognitive Skills, Returns to School and the Gender Gap in Higher Education." Economics of Education Review
21(6):589-98.
Kessels, Ursula, and Ricarda Steinmayr. 2013. "Macho-Man in School: Toward the Role of Gender Role Self-Concepts and Help Seeking in School Performance."
Learning and Individual Differences 23:234-40.
Kimmel, Michael. 2008. Guyland: The Perlous World Where Boys Become Men. . New York, NY: Harper.
—. 2013. Angry White Men: American Masculinity at the End of an Era: Nation Books. Kleinfeld, Judith. 2009. "No Map to Manhood: Male and Female Mindsets Behind the
College Gender Gap." Gender Issues 26(3):171.
Kohler, Ulrich, Kristian Bernt Karlson, and Anders Holm. 2011. "Comparing Coefficients of Nested Nonlinear Probability Models." The Stata Journal
11(3):420-38.
Legewie, Joscha, and Thomas A DiPrete. 2012. "School Context and the Gender Gap in Educational Achievement." American Sociological Review 77(3):463-85.
Levant, Ronald F, Richard G Majors, and Michelle L Kelley. 1998. "Masculinity Ideology among Young African American and European American Women and Men in Different Regions of the United States." Cultural Diversity and Mental Health 4(3):227.
Lundy, Garvey F, and Glenn Firebaugh. 2005. "Peer Relations and School Resistance: Does Oppositional Culture Apply to Race or to Gender?" The Journal of Negro Education:233-45.
MacLeod, Jay. 1987. Ain’t No Makin’ It: Aspirations and Attainment in a Low-Income
Neighborhood. Boulder, CO: Westview Press, Inc.
McDaniel, Anne, Thomas A DiPrete, Claudia Buchmann, and Uri Shwed. 2011. "The Black Gender Gap in Educational Attainment: Historical Trends and Racial Comparisons." Demography 48(3):889-914.
Meece, Judith L, and Beth Kurtz-Costes. 2001. "Introduction: The Schooling of Ethnic Minority Children and Youth." Educational Psychologist 36(1):1-7.