C e n t r u m v o o r W i s k u n d e e n I n f o r m a t i c a
Software ENgineering
Landscape maps for enterprise architectures
L.W.N. van der Torre, M.M. Lankhorst, H. ter Doest,
J. Campschroer, F. Arbab
R
EPORTSEN-E0514 N
OVEMBER2005
SEN
CWI is the National Research Institute for Mathematics and Computer Science. It is sponsored by the Netherlands Organization for Scientific Research (NWO).
CWI is a founding member of ERCIM, the European Research Consortium for Informatics and Mathematics. CWI's research has a theme-oriented structure and is grouped into four clusters. Listed below are the names of the clusters and in parentheses their acronyms.
Probability, Networks and Algorithms (PNA) Software Engineering (SEN)
Modelling, Analysis and Simulation (MAS) Information Systems (INS)
Copyright © 2005, Stichting Centrum voor Wiskunde en Informatica P.O. Box 94079, 1090 GB Amsterdam (NL)
Kruislaan 413, 1098 SJ Amsterdam (NL) Telephone +31 20 592 9333
Telefax +31 20 592 4199 ISSN 1386-369X
Landscape maps for enterprise architectures
ABSTRACTLandscape maps are a technique for visualizing enterprise architectures. They present architectural elements in the form of an easy to understand 2D 'map'. A landscape map view on architectures provides non-technical stakeholders, such as managers, with a high-level overview, without burdening them with technicalities of architectural drawings. In this paper we discuss the use of and techniques for landscape maps. A formal model for landscape maps is introduced as the basis of visualization and interaction techniques. Moreover, we show how a landscape map can be generated from its underlying model. Finally we show several interaction techniques, for example to build a landscape map from scratch, independently of an underlying model, or to change a landscape map together with its underlying model.
2000 Mathematics Subject Classification: 68U35 Information systems
Landscape Maps for Enterprise Architectures
L. van der Torre
1, M.M. Lankhorst
2, H. ter Doest
2, J. Campschroer
3, F. Arbab
1 1CWI, Amsterdam, the Netherlands
2Telematica Instituut, Enschede, the Netherlands
3Ordina, the Netherlands
Abstract
Landscape maps are a technique for visualizing enterprise architectures. They present architectural elements in the form of an easy to understand 2D 'map'. A landscape map view on architectures provides non-technical stakeholders, such as managers, with a high-level overview, without burdening them with technicalities of architectural drawings. In this paper we discuss the use of and techniques for landscape maps. A formal model for landscape maps is introduced as the basis of visualization and interaction techniques. Moreover, we show how a landscape map can be generated from its underlying model. Finally we show several interaction techniques, for example to build a landscape map from scratch, independently of an underlying model, or to change a landscape map together with its underlying model.
1.
Introduction to landscape maps
The IEEE 1471-2000 standard [4] promotes the use of viewpoints for architectural description, and it presents as examples the structural, behavioural, physical connect, and the link bit error rate viewpoint. Moreover, to relate to other standards, it includes discussions on the decomposition and allocation, enterprise, information, computational, engineering, and technology viewpoint. Many other viewpoints have been proposed. Also others, such as Nuseibeh et al. [10] and Finkelstein et al. [3], have advocated the use of viewpoints for describing architectures.
In this paper we discuss so-called landscape map
viewpoints used in decision support of, e.g., information planning. Decision support viewpoints help managers in decision making by offering insight into cross-domain architectural relations. Typically, this is accomplished through projections and intersections of underlying models, but analytical techniques also play a role in construction of landscape maps. Such manipulations of architectural models typically result in lists, tables, matrices and reports. As such, decision support
viewpoints create high-level, coherent overviews of enterprise architectures, providing the ‘big picture’ required by decision makers.
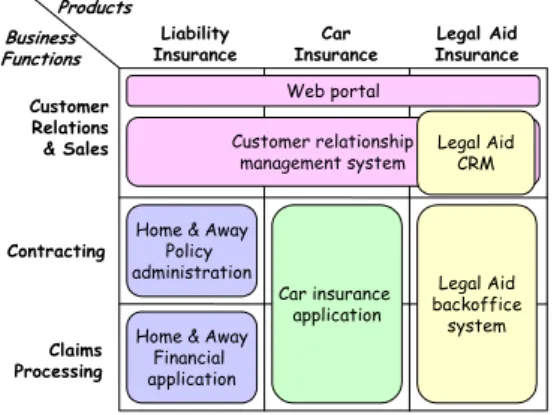
Landscape map viewpoints are used for example to publish an overview for managers and process or system owners, or they are employed by architects as a convenient tool for the analysis of changes or to find patterns in the allocation of resources. A landscape map, as defined by Van der Sanden and Sturm [11], is a matrix that depicts a three-dimensional coordinate system representing architectural relations. Figure 1 is an example of a landscape map that shows which information systems support the operations of an insurance company. The vertical axis represents the company’s business functions; the horizontal axis shows its insurance products. An application rectangle covering one or more cells means that this particular function/product pair is supported by the application, e.g., contracting of a legal aid insurance is supported by the legal aid backoffice system.
Customer Relations & Sales Claims Processing Contracting Liability
Insurance InsuranceCar InsuranceLegal Aid
Web portal Customer relationship
management system
Home & Away Policy
administration Legal Aid backoffice
system Legal Aid
CRM
Home & Away Financial application Business Functions Products Car insurance application
Figure 1. Example of a landscape map.
The dimensions of the landscape maps can be freely chosen from the architecture that is being modeled. In practice, dimensions are often chosen from different architectural domains, for instance business functions, products and applications, etc. In most cases, the vertical axis represents behavior like business processes or functions; the horizontal axis represents “cases” for which
2
those functions or processes must be executed. These “cases” can be different products, services, market segments, or scenarios. The third dimension represented by the cells of the matrix is used for assigning resources like information systems, infrastructure, or human resources. The value of cells can be visualized by means of colored rectangles with text labels.
1.1 Research question and approach
We are interested in the further development of landscape maps for enterprise architectures. For example, thus far landscape maps have been used as standalone views, and tools do not check on conflicts between landscape maps and the description of their underlying models. Moreover, tools support neither the automatic generation of landscape maps from an underlying model, nor the manipulation of underlying models via a landscape map. More advanced visualization and interaction techniques enable the use of landscape maps for navigating their underlying models, or analyzing them.
To define visualization and interaction techniques, we must be more precise about what we mean by landscape maps. How can we define a formal model of landscape maps that can be used to describe existing landscape maps, and which can be used to develop new kinds of landscape maps? As they are used in practice, several different varieties are called landscape maps. The first contribution of this paper is a formal underpinning for landscape maps.
To visualize landscape maps, we must develop techniques to extract landscape maps from an underlying model. We discuss guidelines for choosing the axes and the order of the items on the axes, and we discuss rules for building landscape maps as the one in Figure 1. For example, the top right corner of this map indicates that the customer relation and sales of legal aid insurance are supported by web portal, customer relationship management system, and a legal aid CRM, but why are these three systems visualized in this way?
To interact with landscape maps, we propose to add interactivity to landscape maps. We distinguish between interactions that change only the visualization but keep the underlying model intact, such as changing the order of the rows and columns, and interactions that also change the underlying model of a landscape map. We introduce a particular kind of landscape map actions as the basis of interaction.
We study these questions based on the view and viewpoint notions of IEEE 1471-2000 standard. We extend these notions with a separation of concerns between the conceptualization of the architecture – the content of a view - and its visualization. Moreover, we formally define the signature of a landscape map as three
sets of concepts and a ternary relation defined on these sets. We also define the signature of the underlying model (concepts and relations), such that the landscape map viewpoint contains a partial mapping from the latter signature to the former one, together with a visualisation.
We motivate and illustrate our approach by a running example, which is also being realized in a prototype. 1.2 Scope of the paper
Our formal model and its associated techniques to visualize and interact with landscape maps are based on existing ideas and tools, but we do not give a full survey of all kinds of landscape maps found in the literature and in available tools. We are primarily interested in developing foundations for future generations of landscape map tools.
We propose to use landscape maps as a presentation format (modality) of enterprise architecture models expressed in the ArchiMate language [5,6]. However, our approach is not restricted to this particular modeling language. In this paper we illustrate how ArchiMate models can be mapped to landscape maps, and how landscape maps can be used as an interactive medium for architecture design. For instance, the landscape map in Figure 1 relates business functions (customer relation and sales, etc.) and products (liability insurance, etc.) to systems (web portal, etc.). The relation between business functions and products is directly supported by the assignment relation. The relation between products and systems is indirectly supported: products are assigned to processes (or functions), which in turn use systems.
The study of the effectiveness of existing landscape maps, and the development of useful and effective new ones, is based on two complementary issues. First there are technical issues, for example the generation of landscape maps from underlying models, or the development and use of interaction mechanisms to utilize landscape maps. Second, there are psychological aspects, such as the interpretation of landscape maps by humans, or the reasons why some landscape maps help to convey new insights in architecture whereas other landscape maps only confuse the stakeholders. This paper is concerned with technical issues only.
The layout of this paper is as follows. In Section 2 we introduce our running example, in Section 3 we give our formal model of landscape maps. In Section 4 we discuss the visual aspects of landscape maps, and we show how a landscape map can be constructed from an underlying model. In Section 5 we discuss interaction with landscape maps, where we distinguish between editing a landscape map from scratch, without reference to an underlying model, and changing the landscape map while simultaneously changing its underlying model as well.
2.
Running example
To illustrate the concept of landscape maps, we introduce an example to be used in the remainder of this paper. Our example involves ArchiSurance, an imaginary (though reasonably realistic) insurance company. ArchiSurance, originally in the business of home and travel insurance, has merged with PRO-FIT (car insurance) and LegallyYours (legal aid). As a result of this merger, the company’s main products are now in home, travel, car, liability, and legal aid insurance.
To create high-level insight in ArchiSurance’s primary operations, the company is described in terms of its main business functions: Customer Relations & Sales, Contracting, Premium Collection, Claims Processing, and Document Processing.
3
-Post-merger integration is in full swing. The first step in the integration process has been the creation of a single department for Customer Relations and Sales. However, behind this front office are still three separate back offices:
Home & Away: this department was the original pre-merger ArchiSurance, responsible for home and travel insurance.
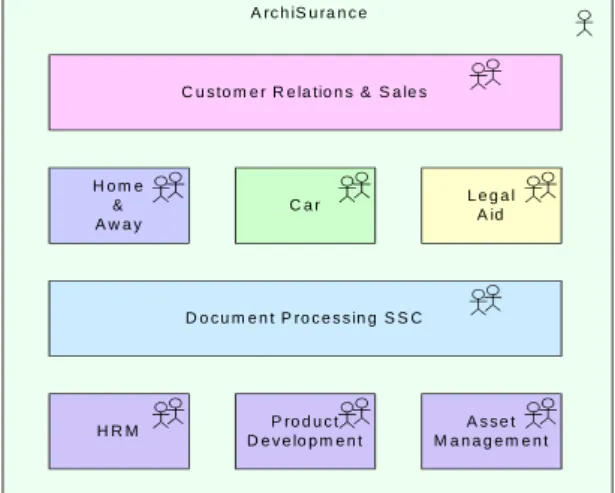
Car: this department is the core of the old PRO-FIT and handles car insurance, including some legal aid. Legal Aid: this is the old LegallyYours, except for the part that has now moved to the Customer Relations & Sales department. H o m e & A w a y C a r L e g a lA id C u s to m e r R e la tio n s & S a le s D o c u m e n t P ro c e s s in g S S C H R M D e v e lo p m e n tP ro d u c t M a n a g e m e n tA s s e t A rc h iS u ra n c e
Figure 2. Actor diagram showing ArchiSurance departments.
As in many recently merged companies, IT integration is a problem. ArchiSurance wants to move to a single CRM system, separate back-office systems for policy administration and finance, and a single document management system. However, Home & Away still has
separate systems for claims handling, premium collection, and payment, and uses the central CRM system and call center. The Car department has its own monolithic system, but uses the central CRM system and call center. The Legal Aid department has its own back- and front office systems (Figure 3).
Home & Away Car Legal Aid Customer Relations & Sales
Document Processing SSC
Home & Away Policy administration
Home & Away Financial application Car Insurance application Legal Aid backoffice system Web portal Call center application
CRM system Legal AidCRM
Document management
system
Figure 3. Applications used by departments.
An important prerequisite for the changes in ArchiSurance’s IT is that the IT integration should be “invisible” to ArchiSurance’s clients: products and services remain the same. However, this is not a straightforward requirement. To illustrate the complex relationships among organization, products, business processes and IT support, Figure 4 shows the relations among the Damage Claiming process, its IT support, and the organization. Note that this figure shows these relations for only a single business process.
Damage claiming process
Registration Acceptance Valuation Payment
Home & away Policy administration
CRM system
Home & away Financial application Home & Away Customer information service Claim information service Customer administration service Claims administration service Payment service Claim registration service Customer information service Claims payment service Printing service Scanning service Document management system Document Processing SSC Customer Relations & Sales
Figure 4. Relations among Damage Claiming process, its IT support, and the organization.
In general, many business processes within the back office link the external products and services with the internal systems. As an example, Figure 5 shows the
‘travel insurance’ product, comprised of a number of services realized by different business processes.
Travel Insurance Claim registration service Customer information service Claims payment service Insurance policy Insurance application service Premium payment service Customer data mutation service Customer
Figure 5. The 'travel insurance’ product.
This web of relations creates a major problem if we want to create insight in the IT support of ArchiSurance. Many systems used by many processes realizing various products and services comprise too much detail to display in a single figure. This is a typical example of where landscape maps can help. As shown in Figure 6, a landscape map of ArchiSurance’s IT applications in relation to its business functions and products provides a high-level overview of the entire IT landscape of the company. Customer Relations & Sales Claims Processing Contracting Document Processing Liability
Insurance InsuranceCar Travel
Insurance Home
Insurance InsuranceLegal Aid
Web portal Call center application Customer relationship management system
Home & Away Policy administration Legal Aid backoffice system Legal Aid CRM
Document management system Home & Away
Financial application Business Functions Products Premium Collection Car insurance application
Figure 6. Landscape map of ArchiSurance.
From this figure, it is apparent that there is an overlap in ArchiSurance’s IT support, both in the Car insurance application and in the Legal Aid CRM system. This insight is difficult to obtain from the previous figures. It requires the composition of relations such as ‘product contains business service’, ‘business service is realised by business process’, ‘business process is part of business function’, ‘business process uses application service’, and ‘application service is realised by application’.
3.
Definition of landscape maps
In this section we give a formal definition of landscape maps, which is used to facilitate the construction of landscape maps from underlying architectural models, the interaction between the visual part of a landscape map and its underlying model, and the analysis of landscape maps. So far landscape maps have been used as a notation without formal underpinnings. Though visualization and interaction techniques can also be developed without a formal model in the background, we believe that the uniform and abstract view on landscape maps given by our formal definition facilitates their design and realization.
The formal definition of a landscape map is based on a well-defined relation to an underlying architectural model and on our notion of the signature of a landscape map, which in turn is loosely based on the notions of architectural description informally defined in the IEEE 1471-2000 standard document [4]. In the subsection below we explain what we mean by a signature of a landscape map. Next, we distinguish symbolic and semantic models, based on this signature. Finally, we discuss landscape map viewpoints, and the distinction between views and visualizations. This terminology is borrowed from formal methods [8], and the use of this terminology in enterprise architecture is discussed in more detail in [2].
3.1 The signature of a landscape map
Intuitively, architectural descriptions such as landscape maps visualize a set of generic concepts and relations. A concept is interpreted as a set, and elements of this set are called concept instances. Of course, in many cases concepts like function and application in our running example are interpreted as objects, not as sets. In such cases we have to add the constraint that the set is a singleton set. Representing concepts by sets is the most general approach, and applied in most modelling languages.
There is a set of concepts on the X-axis (categories, e.g., products), a set of concepts on the Y-axis (functions, e.g., business functions), and one or more sets of concepts displayed on the matrix (e.g., applications). Moreover, there is a ternary relation that represents a landscape map. Thus, the ArchiSurance example contains the following concepts and one relation. Note that the set of concepts does not make explicit which concepts occur on the X-axis, the Y-axis or on the plane.
C = CA∪C X∪CY∪CZ
CA = {product, function, application} CX = {home_ins, travel_ins, …}
5
CY = {customer_rel, claim_processing, …} CZ = {web_portal, call_center, …} R = {use}
Furthermore, we assume an implicit “is-a” or subset relation on the concepts, since each element of CX is a product, each element of CY is a function, and each element of CZ is an application.
home_ins⊆product travel_ins⊆product
…
Finally, the relevant information in the landscape map in Figure 6, e.g., that web portal is used by customer relations & sales, but not contracting, can be represented in two ways. First, we may say that the relation is defined on the set of concepts, i.e., use ⊆ C × C × C. We have
product on the X-axis and function on the Y-axis, i.e. use ⊆ CX × CY × CZ.Under this interpretation of the relation, the landscape map in Figure 6 can be represented by the following relation.
use ={ 〈home_ins, customer_rel, web_portal〉, 〈home_ins, customer_rel, call_center〉, 〈home_ins, customer_rel, crm〉,
〈travel_ins, customer_rel, web_portal〉,
…
Alternatively, inspired by the notion of signature in formal methods [8,2], we can interpret relations on concept instances use ⊆product × function × application. More precisely, the relation can be interpreted as follows.
use⊆home_ins × customer_rel × web_portal
∪home_ins × customer_rel × call_center
∪home_ins × customer_rel × crms
∪travel_ins × customer_rel × web_portal
…
In this paper we use the latter option, which is analogous to the notion of typing information in signatures of formal languages [8]. For the techniques developed in this paper both options could be used, but for other techniques such as analysis and simulation of enterprise architectures, the latter option is preferred [2]. The difference is that in the second case, the relation is not defined on the concepts, but on the concept instances. Consequently, the relation between concepts may be called typing information of the landscape map. This is explained in more detail in the following section, when we discuss the interpretation of a
signature, and semantic models. A further discussion can also be found in [2].
The combination of a set of concepts together with the pre-defined is-a relation, and the relation together with typing information, is called the signature of a landscape map.
3.2 Semantic and symbolic models
The notion of an architectural model is notoriously ambiguous. The ambiguity becomes clear when we use our formal machinery. First, we have to distinguish between semantic and symbolic (syntactic) models of an architecture. The former are an abstract description of the structure and ‘meaning’ of the architecture itself; the latter are its denotation, i.e., part of the architectural description. This distinction between the architecture and its description is also made in the IEEE 1471 standard.
A semantic model consists of a domain and an interpretation function. In such a model, each concept is interpreted as a set from a domain, which represents that concepts are generic. The ternary landscape map relation is defined on the concepts instances, not on the concepts themselves. For example, the following describes a simple model. Assume that all concepts that are not mentioned are empty sets.
home_ins = {h1,h2,h3}
customer_rel = {c1,c2,c3}
web_portal = {w1,w2,w3)
use = {〈h1,c1,w1〉, 〈h1,c2,w3〉}
In this example, use is defined on instances of concepts like h1 and c1.
Second, the notion of architectural model in the IEEE 1471 standard corresponds to what we call symbolic models, which are logical theories based on a signature. Symbolic models are part of the architectural description, and thus they can describe elements of an architecture. In our formal model, an architectural description is more than just a signature that can be visualized in a view: it also contains constraints and actions which play an important role in analysis and interaction.
Landscape map constraints are logical expressions expressed in terms of the landscape map signature. They further describe the architectures (the semantic models) that fit the signature of the landscape map. For example, there may be constraints that each concept is non-empty, or that concepts are singleton sets. Examples of such constraint languages are OCL for UML [9] and description logics for first-order models [1].
6
Landscape map actions are descriptions of how a view can be modified, for example due to interaction with the user or as triggered through another view. An action specifies both the interaction dialogue with the user (which kind of information must be obtained from the user when he clicks a button), as well as the consequence of the interaction (e.g., whether and how the underlying model must be modified after interaction with the user). 3.3 Viewpoints, views and vizualizations
In the IEEE-1471 standard [4] a view is a representation of a whole system from the perspective of a related set of concerns, that may consist of one or more architectural (i.e., symbolic) models. A viewpoint is a specification of the conventions for constructing and using a view.
In our formal model of landscape maps we abstract away from stakeholders and their concerns, because they are notoriously hard to formalize. Moreover, we distinguish between a view and its visualization. A landscape map viewpoint contains a partial mapping from the signature of the architecture to the landscape map signature, and a landscape map view is the result of applying this mapping to an underlying model. Moreover, the landscape map viewpoint contains a mapping from the view to visual structures.
The visual structure can be formalized in many ways, for example by a signature that expresses in a mathematical way that there is an X-axis, a Y-axis, a plane and rectangles in this plane. Under this formalization, the landscape map viewpoint contains a partial bijective mapping between the signature of the landscape map and the signature of the vizualization. Such a mapping is partial because some elements of the architecture will not be visualized and some elements of the visualization (e.g., colors) may have a meaning outside of the model. However, visual structures can also be formalized in other ways, and we do not constrain ourselves to this particular formalization.
Summarizing, in our model we see a landscape map as a composition of a symbolic model and a visual structure, together with a partial bijective mapping of the model on the visual structure. This is less ambiguous than the informal IEEE standard.
4.
Visual aspects of landscape maps
The goal of a landscape map is to give an overview of and insight into some architectural relations. In general, a landscape map represents two relations in one map: on the one hand the relation between the entities along the vertical axis and the entities in the plane, and on the other hand the relation between the entities along the horizontal
axis and again the entities in the plane. Through the entities in the plane, an indirect relation is established between the two dimensions of the axes. For instance, if an application supports some business function in relation to a certain product, then the business function can be said to support that product.
4.1 The axes
An intuitive and easy to understand choice for the axes is essential for landscape maps to be useful. In the infrastructural approach of Ordina [12], the axes are chosen as follows. The vertical axis represents business functions, i.e., business behavior categorized with regard to results and independent of resource or deployment choices. The horizontal axis represents cases, which still can be specialized to different types of entities. For instance, products or services can be considered as cases business functions add value.
To be useful for managing and designing for change, it is important that the choice of axes is stable, i.e., that the same axes can be used for different usages of the map, and for representing different situations over time. Another requirement is that the choice of axes results in a useful decomposition of the domain. The map is useless if all entries are assigned the same value, or if the matrix becomes sparse in all situations.
The axes themselves allow some freedom in how columns (or rows) are ordered. Sometimes this freedom can be used for arranging columns such that the plane consists of nice rectangular regions like in Figure 6. In other cases, there are semantic constraints, like ordering of business functions in time or an ordering according to priority.
Finally, it is possible to add a hierarchical structure to an axis. For business functions or processes this is an obvious approach to allow more detail in a landscape map.
4.2 The cells
The cells of a landscape map, which are the third dimension of the landscape map, depend on the purpose of the landscape map. If the map is to be used for enterprise application integration, the cells will represent applications or systems; see, for instance, the landscape map in Figure 6. If the purpose is to give insight into the use of data elements, the cells will hold references to data types.
The landscape map in Figure 6 is a view on an underlying model, with its own signature. For example, it may be based on the same sets of concepts, but with two other relations:
7 -C = -CA∪CX∪CY∪CZ
CA={product, function, application} CX = {home_ins, travel_ins, …}
CY = {customer_rel, claim_processing, …} CZ = {web_portal, call_center, …} R = {support, realize}
Figure 3 illustrates how an application supports a business process that spans a number of business functions, and assumes, moreover, that the underlying model specifies how an application realizes a product. Now we have:
support⊆ CY × CZ
realize⊆ CZ × CX
In this particular case, we can directly find the use
relation as the product of support and realize. To be precise, combining support and realize leads to a relation CY × CZ × CX, so we still have to reshuffle the order of the parameters to find the use relation. Moreover, as explained in Section 3.1, support, realize and use are defined on concept instances, not on concepts themselves.
use = support × realize
Note that in this case, because the ternary use relation of the landscape map is constructed as a cross product of two binary relations, its components can always be visualized as a rectangle. That is, if there is an application say z, for (x1,z,y1), and (x2,z,y2), then there are also components for (x1,z,y2) and (x2,z,y1).
At the first sight, it may seem that the visualization in Figure 6 of the three dimensional use relation is straightforward. However, a closer inspection reveals that several choices must still be made. First, the three dimensional relation does not specify in which order the items on the axes are presented.
Second, the three dimensional relation does not specify how applications are ordered within a cell of the matrix. Consider for example the top right cell, which visualizes the applications used for Customer Relations & Sales, and
Legal Aid Insurance. There are four application components in this cell: Web portal, Call center application, Customer relationship management system, and Legal Aid CRM. However, the relation does not specify that the web portal must be on top, that it is bigger than the two others below, etc. This is what we call visual information, which must be deduced and/or produced by a layout algorithm.
4.3 Automatic layout of landscape maps
An important condition for landscape maps to be effective for problem identification is that the visualization must be intuitive and easy to understand. To a large extent, the choice of the axes and the ordering of the rows and columns determine the layout of a landscape map. If adjacent cells in the plane have the same value assigned, they can be merged to form a single shape. If there are no other criteria for ordering the axes such as time or priority, the ordering can be applied to optimize the layout of shapes the plane, and also to limit their number.
Creating the layout of a landscape map can be seen as a search process. We must define the search space, what it means to have a ‘good’ or ‘nice’ layout, and we must find smart ways to search.
For the search space, a cell that has multiple values assigned can be visualised by multiple combinations of overlaps and ways to split the cell. The input for an automatic layout algorithm is an empty matrix with a per-cell list of values. A per-cell that has multiple values assigned may be visualised by using overlaps and/or cell splitting. For instance, the top right cell of Figure 6 has 4 values assigned and is visualised by splitting the cell in three rows of which the bottom one is overlapped by the fourth value. A layout algorithm should be able to derive such a visualisation (semi-)automatically. Examples of rules that can be used to evaluate possible layouts are:
Minimize the number of objects on the plane. Minimize the number of corners on the objects. Maximize the convexity of the objects.
Make the smallest object as large as possible.
We must define also the precedence of the rules in cases of conflict.
For the order of searching the search space, we must find some good heuristics because the search space is huge, already for a simple example as in Figure 6. For instance, assume that a cell has four values assigned, i.e., four applications are used by a particular combination of a product and a business function. The basic layout of this cell can be chosen from 168 possible options:
4 overlaps, no cell splitting Æ 4*3*2 (top bottom order!)
4 subcells, no overlaps Æ 4*3*2 = 24 2 subcells with 2x2 overlaps Æ 4*3*2 = 24 2 subcells, one with 3 overlaps Æ 4*3*2 = 24 3 subcells, one with 2 overlaps Æ 4*3*2 = 24 3 subcells, one overlapping two Æ 24 3 subcells, one overlapping three Æ 24
Clearly, the total number of possible visualizations for a landscape map grows exponentionally. Therefore, the search space must be constrained by rules. Some rules to guide the search process are:
8
-Consider only applications that are allowed by the model.
For subcells at the border of a cell, choose applications that also occur in neighboring cells.
Start with borders, then go for corners, and finally choose centers of cells.
A particular kind of search process works as follows. We first try to find a good initial layout and thereafter we try to improve this initial layout.
In this case, it is important to find a good initial layout, since improvement is slow. Here we can use variants of the search heuristics mentioned above. The landscape map of Figure 6 has been generated using the following set of rules:
Choose applications for borders. Choose applications for corners.
For applications that occur only in one cell, put the application in the center of the cell (e.g., top right corner).
Fill rows and columns (e.g., top three rows of applications).
Fill neighbors in a “smart” way.
In the particular case of Figure 6, these construction rules directly yield the presented landscape map without the need for any improvement rules. However, in general there will be room for improvement. Examples of improvement rules are:
Enlarge one application in a cell, as long as it does not exclude another application from the cell.
Swap two subcells in a cell.
The improvements are again measured by the same kind of rules as in the previous case. Now, the additional possibility is not to search the whole search space in an exhaustive way, but to randomly apply the improvement rules, as in evolutionary learning techniques.
5.
Interaction with landscape maps
So far, landscape maps have been used as a static one-way presentation format, and landscape map tools contain only editors that allow architects to create landscape maps, with no provisions to relate them to more formal underlying architectural models. We use landscape maps as an interactive medium. Landscape maps are used as a starting point for more detailed models and specifications and they can be used for entering relations between the chosen dimensions. Changes in the landscape map can also be analyzed for impact on other elements of the map.
We have developed new techniques to define interactive landscape maps. In this section we discuss the notion of landscape map action, which has already been defined in Section 3.2 as a description of how a view can
be modified, for example due to interaction with the user or as triggered through another view.
We say that landscape map actions create new views and visualizations from existing ones, and can therefore be formally described as mappings between views and their vizualizations. At this abstract level, they have something in common with our notion of viewpoint. However, intuitively they are clearly different in important ways, and this is reflected also in our formal definition.
First, when we change the landscape map view we may also have to change the underlying model, and vice versa. For example, consider a stakeholder that works with multiple views at the same time, or multiple stakeholders with multiple viewpoints. In such cases, we visualize the changes directly in all views (with the problem of calculating new visual attributes). On the contrary, when we create a new view from a viewpoint, then existing views do not change. Actions that change the underlying model necessarily have a strict semantics, whereas actions that change only the visualization of a model in a view can be used to make a landscape map more ‘suggestive’, e.g., by using colors and sizes of objects to signify their relative importance. Although important in practice, we do not discuss visual and psychological aspects of landscape maps here.
Second, actions may be interpreted in different ways, depending on the stakeholder and its viewpoint. For example, some stakeholders may change the underlying model, while others may not. For this reason, we represent actions explicitly in views, in the sense that viewpoints or landscape map actions can also modify the landscape map actions. In this, we use an extended notion of ‘view’ compared to the IEEE 1471 standard, in which views only relate to the architecture itself.
Third, actions typically require some interaction with the user, before they can be executed. We therefore extend the notion of action by associating an interaction protocol with it. Thus, an action specifies both the interaction dialogue with the user (which kind of information must be obtained from the user when he clicks a button), as well as the consequence of the interaction (e.g., whether and how the underlying model must be modified after interaction with the user).
In this section we discuss two kinds of interactions. In Section 5.1 we describe the creating and navigating a landscape map. In Section 5.2 we discuss the more complex case in which the underlying model can be changed by editing the landscape map. This tends towards impact analysis. Section 5.4 describes how these interactions may be realised by embedding corresponding actions explicitly in the landscape map view.
5.1 Creating and navigating a landscape map The first contours of a landscape map are usually drawn on a white-board, flip-over or piece of paper. Together with the stakeholders the architect tries to address their concerns. The map should be such that it concentrates on the choices that must be made. The drawing must also be such that consequences are visible. In this interaction the architect chooses the concepts on the axes and on the plane, the level of detail, leaving out the facts that are less important. For the sake of readability, understandability, and acceptance the architect juggles a little bit with the (unwritten) rules of the landscape map. With pen and paper this can obviously be done.
9
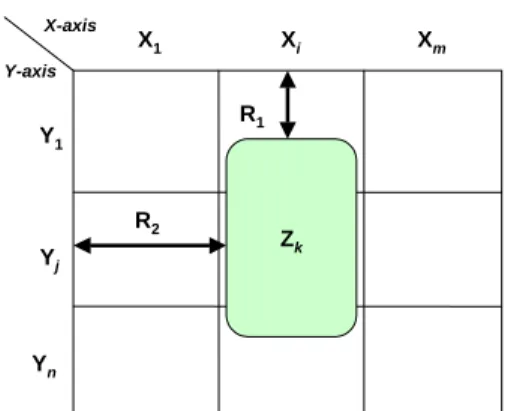
Back at the desk and using the tool we envisage, the landscape map must be constructed in a more formal way. First, the architect needs to select the type of concepts used on the X-axis, on the Y-axis, and on the plane (see Figure 7). In our ArchiSurance example, the X-axis contains products, the Y-axis signifies business functions, and the plane holds applications.
Next, the objects on these axes must be chosen (the X1, …, Xm and Y1, …, Yn in the figure). If a landscape map is
used to define a new architecture, these objects can be freely chosen (of course conforming to the type of the axes). Alternatively, if an existing architecture model is visualized they may be selected from this model. By choosing the concepts for the axes the field of play is defined. Y1 Yn Yj X1 Xi Xm Y-axis X-axis Zk R2 R1
Figure 7. Elements of a landscape map.
After this, the architect must choose the type of assertions that are made by putting an object Zk somewhere on the
plane, i.e., the relations R1 and R2. In our example, he chooses business functions on the vertical axis, products on the horizontal axis and applications on the plane. The most obvious, intuitive assertion is that an application is used by activities required within the business function in realizing the product, giving us R1 = support and R2 =
realize. For every object the architect places on the plane, these relations between Xi, Yj, and Zkare instantiated.
Furthermore, if the rectangle of the application Zk is
not exactly aligned within a row and/or column, then the relations with the X and Y elements are in a sense ‘incomplete’. For example, an application may deliver only some of the functionality needed to support a business function.
In a similar fashion, an existing landscape map can be used as a starting point for navigation. In this case, relevant interactions include:
-Open a rectangle: detailed specifications or detailed models are shown in a separate window.
Close detailed specification or detailed models.
Change granularity of an axis; for instance, business processes can be changed to business activities.
Link two rectangles by a relation supported by the underlying concept. For instance, if rectangles represent systems, use or composition can be used. We are currently developing a prototype interaction engine for landscape maps based on these ideas.
5.2 Changing a landscape map
If an architect or stakeholder wishes to change an existing landscape map, the effects of this change on the underlying architecture model need to be assessed. Some changes may be purely ‘cosmetic’ in nature, e.g., changing the color of an object. Other changes need to be propagated to the underlying model, e.g., if an object is added or deleted.
Mapping a seemingly simple change to the map onto the necessary modifications of the model may become quite complicated. Since a landscape map abstracts from many aspects of the underlying model, such a mapping might be ambiguous: many different modifications to the model might correspond to the same change of the landscape map. Human intervention is required to solve this, but a landscape map tool might suggest where the impact of the change is located.
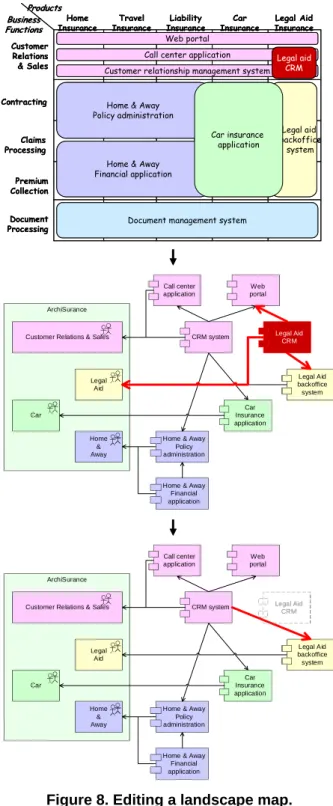
In the example of Figure 6, the architect may, for instance, want to remove the seemingly redundant Legal aid CRM system by invoking a ‘remove overlap’ operation on this object. This operation influences both the visualization and the architectural model. Figure 8 illustrates the effects of the operation on the underlying model.
First, the architect selects the object to be removed, in this case the Legal Aid CRM system. The envisaged tool colors this object and maps it back onto the underlying object in the architecture model (an element of the set CZ as defined in Section 3.1).
ArchiSurance Home & Away Car Legal Aid Customer Relations & Sales
Home & Away Policy administration
Home & Away Financial application Car Insurance application Legal Aid backoffice system Web portal Call center application
CRM system Legal Aid
CRM ArchiSurance Home & Away Car Legal Aid Customer Relations & Sales
Home & Away Policy administration
Home & Away Financial application Car Insurance application Legal Aid backoffice system Web portal Call center application
CRM system Legal Aid
CRM Customer Relations & Sales Claims Processing Contracting Document Processing Liability
Insurance InsuranceCar Travel
Insurance Home
Insurance InsuranceLegal Aid
Web portal Call center application Customer relationship management system
Home & Away Policy administration Legal aid backoffice system Legal aid CRM
Document management system Home & Away
Financial application Business Functions Products Premium Collection Car insurance application Customer Relations & Sales Claims Processing Contracting Document Processing Liability
Insurance InsuranceCar Travel
Insurance Home
Insurance InsuranceLegal Aid
Web portal Call center application Customer relationship management system
Home & Away Policy administration Legal aid backoffice system Legal aid CRM
Document management system Home & Away
Financial application Business Functions Products Premium Collection Car insurance application
Figure 8. Editing a landscape map.
Next, the relations connecting this object to its environment are computed (the second part of Figure 8). Here, this concerns the relations of Legal Aid CRM with the Web portal and the Legal Aid backoffice system. These relations will have to be connected to one or more objects that replace the objects that are to be removed. Since we have chosen a ‘remove overlap’ operation, the
landscape tool computes with which other objects Legal Aid CRM overlaps, in this case the CRM system. The relations formerly connecting Legal Aid CRM are then moved to the other CRM system, unless these already exist (e.g., the relation with the Web portal).
Naturally, this scenario presents an ideal situation with minimal user intervention. In reality, a tool cannot always decide how a proposed change is to be mapped back onto the model, and may only present the user with a number of options. For example, if the functionality of the Legal Aid CRM system would overlap with more than one other system, remapping its relations requires knowledge about the correspondence between these relations and the functions realized by these other systems.
5.3 Impact analysis
The use of viewpoints may play an important role in architecture-level impact analysis (see, e.g., [12]). The type of editing illustrated above tends toward this type of analysis. By propagating changes to the landscape map through the architectural model, a high-level impression of the effects of a change can be obtained. Several visual techniques such as colors, line styles, and fonts can be used to highlight these effects within the landscape map.
Landscape maps can also be used to visualise the results of other types of analysis. For example, a cost or performance analysis may yield quantitative results that can be shown by, e.g., colouring objects in a landscape map according to these values. Suppose we would analyse the maintenance cost of the applications of ArchiSurance and plot this in a landscape map as illustrated in Figure 9.
Customer Relations & Sales Claims Processing Contracting Document Processing Liability
Insurance InsuranceCar Travel
Insurance Home
Insurance InsuranceLegal Aid
Web portal Call center application Customer relationship management system
Home & Away Policy administration Legal Aid backoffice system Legal Aid CRM
Document management system Home & Away
Financial application Business Functions Products Premium Collection Car insurance application
Maintenance cost High
Low
Figure 9. Maintance cost of applications.
This figure gives a rapid overview of, e.g., legacy systems that are in need of replacement and products whose application support is too costly. Combined with the information the landscape map gives on the overlap between applications, this yields a valuable instrument in deciding about the migration to a future application architecture.
In analysis, the view itself does not change, but a new view is created to visualize the analysis results (possibly including a visualization of constraints). This view has a larger underlying model and a richer visual construct then the original one, i.e., the original is a subset of the view showing the results of the analysis.
5.4 Actions embedded in views
11
-The landscape map editor in Section 5.1 can be described in terms of a number of basic actions that can be performed on the map. The initial state of the landscape map editor is an empty canvas. However, the landscape map view is not empty. It contains actions for selecting the type of concepts on the X-axis, on the Y-axis, and on the plane. Once these have been selected, a new view is created which contains actions that allow the user to select and draw the applications, such as the following.
Draw a rectangle (rubber band) covering one or more cells of the map. A user may choose the color and assign an object (instance of a concept) to the rectangle.
Extend an existing rectangle with another rectangle that overlaps with the original. Color and label are inherited.
Modify a rectangle: e.g., its coverage, color, and value. Delete a rectangle.
The landscape map actions thus work in this way as a kind of bootstrapping mechanism for the landscape map editor. All interaction mechanisms are defined in the actions, not in the editor itself. In other words, the editor is generic, and can be used for any other task as well.
A crucial mechanism underlying the landscape map actions is the interaction protocol for interaction dialogues. For example, assume that the editor visualizes the landscape map actions as a set of buttons, and that pressing a button triggers the associated interaction protocol. If the user presses the button for adding an object on the X-axis, the system responds with a question for the name of the object, and asks the user where the new column must be added. Clearly, there are also interactions that are not visualized by buttons. For example, the action `change columns’ is typically triggered by a user clicking on the column to be moved. If we look at the interaction of the user with the landscape
map editor in more detail, we can distinguish the trigger, the atomic steps and the protocol.
1. Typically the dialogues start with a trigger from the user, such as pressing a button on the screen.
2. The dialogue may contain several atomic interactions. For example, when an item is added to an architecture, there are atomic interactions of selecting the kind of item, typing in the name of the item, pointing a place on the canvas where the item should appear, etc.
3. The protocol tells in which order the atomic interactions should be done. We assume that the protocol consists of a complete ordering of atomic interactions, such that each new atomic interaction can be done only when the previous one has been finished.
If the user presses an add- or delete button, then a dialogue is initiated in which the systems asks for the parameters to execute the action. For example, when a user presses a delete button, the editor asks the user which object is to be deleted.
R3(a,b,c)
User Landscape view
press delete ask object
Figure 10. Interaction with landscape view.
The same mechanisms of landscape map actions and dialogue protocols is also used in the more complicated interactions in Section 5.2, in which also the underlying model is affected by the edit operations.
An example of interaction with landscape map views that is concerned with two views is represented in the sequence diagram of Figure 11.
rebuild del realize(b,c) realize(b,c) ask subrel use(a,b,c) press delete ask object Model
User Landscape view
Figure 11. More complex interaction with landscape view and underlying model.
12
The user presses the delete button, and the landscape view asks which application should be deleted. The user clicks on an application, which we abstractly describe by
use(a,b,c). Now for the system to delete this relation from the model, it can due to the construction of our relation use from support and realize, it can either delete
support(a,b) or realize(b,c). When the user has selected
realize(b,c), the action del in the model is called, and finally the landscape map is rebuilt.
Moreover, actions may be interpreted in different ways, depending on the stakeholder and its viewpoint. The stakeholder assumed in Figure 10 is allowed to change the underlying model. However, we can block this permission by updating the action in the view such that the del-realize(b,c) is not triggered by the delete action. Since the actions are specified in the view, and not in the landscape map tool, this blocking can be realized by another landscape map action.
Summarizing, if we consider landscape maps as an interactive medium, which contain interactions involving changes to the underlying model, then the flexibility of landscape map actions becomes very useful.
6.
Conclusions and Future Work
In this paper we introduce landscape maps for enterprise architectures, which is an instrument that has proven its value in the architecture and consultancy practice of Ordina. The landscape map is an easy-to-read informative format that provides overview of and insight into architecture relations between different domains. We define a formal semantics for landscape maps based on a mapping to and from the ArchiMate language. We show how landscape maps can be automatically derived from enterprise architectural models and explain how they can be automatically visualised. Finally, we explain how interaction with landscape maps is realised by propagating changes back to the underlying model by means of actions.
The development of landscape maps in this paper carefully balances formalization and informal discussion. Enterprise architectures are often informal, because they must not constrain the architect. However, to provide the architect with useful tools, some formal definitions are necessary. In this paper we only adopt a minimal formalization in terms of the signature of a landscape map, but we do not constrain for example the visual structures, or the landscape map actions. The minimal formalization has been sufficient to define the visualization and interaction techniques.
Based on the formalization of landscape maps presented in this paper, we are developing a prototype that will illustrate the added value of the formal semantics of landscape maps and the benefits of interactive
landscape maps (based on actions). The prototype will serve as a proof of concept of the formalization of, automatic layout of, and interaction with landscape maps. Furthermore, it will be used to show to members of the ArchiMate Tool Vendor Forum the tool support that we envisage for enterprise architecture. The Tool Vendor Forum consists of tool vendors associated with the ArchiMate project with the purpose of realizing commercial tool support for ArchiMate research products. References
[1] F. Baader, D. Calvanese, D. McGuinness, D. Nardi, and P. F. Patel-Schneider, editors. Description Logic Handbook: Theory, Implementation and Applications. Cambridge University Press, 2002.
[2] M. Bonsangue, F. de Boer, J. Jacob, A. Stam, and L. van der Torre (2004), A logical viewpoint on architectures,
Submitted.
[3] A. Finkelstein, J. Kramer, B. Nuseibeh, L. Finkelstein, and M. Goedicke, (1992), Viewpoints: A Framework for Multiple Perspectives in System Development,
International Journal of Software Engineering and Knowledge Engineering, Special issue on 'Trends and Future Research Directions in SEE', World Scientific Publishing Company Ltd., 2(1): 31-57, March 1992. [4] IEEE Computer Society (2000), IEEE Std 1472-2000:
IEEE Recommended Practice for Architectural Description of Software-Intensive Systems, Oct. 9, 2000.
[5] H. Jonkers et al. (2003). A Language for Coherent Enterprise Architecture Descriptions. Proceedings of the 7th IEEE International Enterprise Distributed Object Computing Conference (EDOC'03), 2003. IEEE Computer Society Press.
[6] H. Jonkers, M.M. Lankhorst R. van Buuren, S. Hoppenbrouwers, M. Bonsangue, and L. van der Torre (2004), Concepts for Modelling Enterprise Architectures,
International Journal of Cooperative Information Systems, special issue on Architecture in IT (forthcoming).
[7] Lassing, N., Rijsenbrij, D., Vliet, H. van (2001), Viewpoints on modifiability, International Journal of Software Engineering and Knowledge Engineering, Vol. 11, no. 4 (2001), pp. 453-478.
[8] J. van Leeuwen, Ed., Handbook of Theoretical Computer
Science, vol. B: Formal Methods and Semantics, North-Holland, Amsterdam.
[9] A. Kleppe and J. Warmer, The Object Constraint Language and its application in the UML metamodel, in Proceedings UML'98 Beyond the Notation, Mullhouse, France, June 1998.
[10] B. Nuseibeh, S. Easterbrook, and A. Russo, (2001), Making Inconsistency Respectable in Software Development, Journal of Systems and Software, 56(11), November 2001, Elsevier Science Publishers.
[11] W.A.M. van der Sanden en B.J.A.M. Sturm (2000), Informatiearchitectuur, de infrastructurele benadering (in Dutch), Panfox.
[12] W.A.M. van der Sanden, P. Bergman, J.C.Campschroer en H.R. de Reus (1999), Realisatie van flexibele
informatievoorziening (in Dutch), Informatie nr. 41, January 1999, pp. 58-65.