1
A Conceptual Framework for the National Flood Interoperability Experiment
1 By David R. MaidmentCenter for Research in Water Resources University of Texas at Austin
Revised, 9 February 2015
Summary
The National Flood Interoperability Experiment (NFIE) is a one-year research collaboration among government, academia and industry to help demonstrate the next generation of national flood hydrology and emergency response at the National Water Center. High spatial resolution hydrologic forecasting systems are being built on a geospatial data infrastructure describing the natural water flow system of the continental United States divided into 2.67 million reach catchments. Detailed river hydraulic modeling and flood inundation mapping are being carried out for selected communities and regions. Planning for using this information to improve local flood emergency response and community resilience is being developed. A seven-week Summer Institute in June and July 2015 for graduate students at the National Water Center will serve as the focus to bring these activities together and help to establish a continuing pathway from research to operations in flood forecasting for the United States. If successful, this experiment will result in an increase in spatial density of flood forecasting locations by more than 700 times compared with the present NWS river forecasting system. This would be
transformative for improved real-time flood information in the United States.
Contents
Introduction ... 2
NFIE Components... 3
NFIE-Geo: National Geospatial Framework for Hydrology ... 5
NFIE-Hydro: National Hydrologic Simulation Framework ... 8
NFIE-River: Local River Hydraulics and Flood Inundation Mapping ... 11
NFIE-Response: Local Flood Emergency Response Planning ... 15
NFIE-Services: Web Services for Sharing Flood Information ... 17
Research Questions ... 19
Conclusions ... 20
Appendix: Nomenclature ... 21
1The author gratefully acknowledges the comments on a previous draft of this paper of Edward Clark, David
Gochis, Alan Rea, David Tarboton and graduate students in his flood forecasting class. He is also grateful to David Arctur, Harry Evans, Fernando Salas, Marcelo Somos Valenzuela, Tim Whiteaker and Xing Zheng of the Center for Research in Water Resources of UT Austin. Appreciation is also expressed to the CUAHSI NFIE Committee, to CUAHSI staff in particular Richard Hooper and Emily Clark, to Andy Ernest of the University of Alabama, and to commercial partners Deltares, ESRI, Kisters, and Microsoft Research. This research is supported in part by NSF grant ICER 1343785: EarthCube Building Blocks: Integrating Discrete and Continuous Data.
2
Introduction
Flooding is the natural disaster most frequently impacting people in the United States. About two-thirds of all federal disaster declarations include flooding as a cause, and the cost to the federal government for disaster relief for flooding exceeds that from any other form of natural disaster. Beside the devastation of homes and businesses, flooding also causes significant loss of human life, including the lives of first responders who are seeking to rescue flood victims and keep people safe during flood events. Better real-time flood information is needed to save lives and reduce damage during flood events.
The National Flood Interoperability Experiment (NFIE) is a one-year collaboration, from September 2014 to August 2015, between the National Weather Service and its government partners, and the academic community and commercial partners, that is designed to demonstrate a transformational suite of science and services for the next generation of national flood hydrology and emergency response. This experiment leverages new communications standards that simplify the exchange of water information among disparate producers and consumers, as well as integrating cutting edge hydrologic modeling and analysis techniques from the research community. The NFIE will be conducted through the new National Water Center, recently established by NOAA-National Weather Service on the Tuscaloosa campus of the University of Alabama to support and expand the forecasting function of the thirteen regional River Forecast Centers, and to develop a new seamless suite of analyses and guidance data sets for the water budget variables spanning the entire continental United States.
The NFIE will address the following questions:
How can real-time hydrologic simulations at high spatial resolutions, covering the nation, be developed using a next generation “HydroFabric” – a framework of open water data services in space and time?
How can this lead to improved emergency response and community resilience?
How can an improved interoperability framework support the first two goals and lead to sustained innovation in the research to operations process?
The NFIE consists of three phases: (1) A Planning Phase from September to December 2014, during which the initial elements of the HydroFabric were assembled within the existing systems of the
participating federal, academic and private partners; (2) A Mobilization Phase from January to May 2015 during which a CUAHSI webinar series is being presented and a student application process
administered; (3) A Summer Institute, from June 1 to July 17, 2015, when students and faculty from the University of Alabama and from other universities around the country will join with the NOAA-National Weather Service and other partners to assemble, demonstrate and explore alternatives for the next generation flood data, modeling, forecasting and inundation mapping system for the United States. The flood information services supporting the Summer Institute will be maintained operationally until August 31, 2015 to facilitate completion of Summer Institute research projects and demonstration of its outcomes to external audiences. The Consortium of Universities for the Advancement of Hydrologic Science, Inc, (CUAHSI) is coordinating the participation of the academic community in the NFIE. A series of recorded webinars are being held to provide further information.2
3
The NFIE takes place in parallel with several other federal initiatives supporting open information exchange. During 2014, an Open Water Data Initiative was launched by the Federal Geographic Data Committee and the Advisory Committee for Water Information, the principal bodies for coordination of geospatial and water information at the federal level in the United States. This initiative is administered by the Subcommittee on Spatial Water Data which reports to both of these bodies. The NFIE is the first of what are planned to be several experiments being performed within the Open Water Data Initiative to test the implementation of web services for distributing water information nationally.
Prior to the Open Water Data Initiative, an agreement was made among the National Oceanic and Atmospheric Administration (NOAA), US Geological Survey (USGS), and the US Army Corps of Engineers (USACE) in 2011, called Integrated Water Resources Science and Services (IWRSS). FEMA is an
anticipated critical addition to the IWRSS consortium. IWRSS is a new business model for the federal agencies whose missions include monitoring, forecasting and management of water resources. The National Water Center concept of operations is under development to support the IWRSS partnership and complimentary water resources related missions across NOAA. An important first-task for IWRSS is to develop interoperability and data synchronization of essential information across all agencies when dealing with regional water emergencies, thus establishing a Common Operating Picture for Water Resources in the United States.
The NFIE is an initial activity that will help the federal partners to develop and refine the requirements for a high-resolution real-time water resources modeling and forecasting platform at the National Water Center. The NFIE will culminate in a near-real time system capable of characterizing the state of surface water resources, specific to flood or near flood stage on a spatial domain that spans the continental United States, and at a resolution that facilitates decision-making within the emergency management community.
NFIE Components
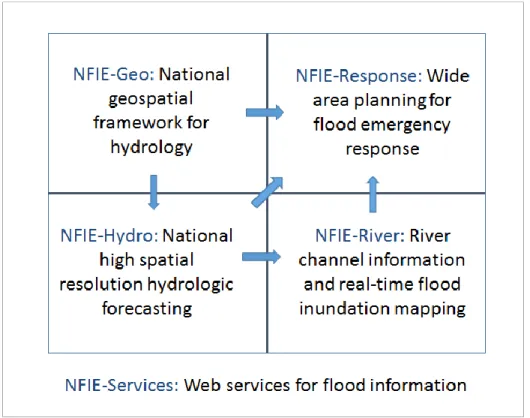
Undertaking such a complex task as the National Flood Interoperability Experiment is facilitated by breaking down the overall task into a series of five components, as shown in Figure 1. Definitions of basic concepts being used in the experiment are collected in the list of nomenclature included as an appendix at the end of this paper.
Beginning at the top left of the Figure 1, there is NFIE-Geo which is a set of vector feature classes of high resolution geospatial information describing the natural water flow system of the continental United States divided into 2.67 million reach catchments connected by a national flow network. Building on this is NFIE-Hydro, which is a continental scale hydrologic simulation framework operating on the National Water Data Infrastructure, linking weather forecasts, land-atmosphere modeling and channel flow routing to produce probabilistic flood forecasts for each reach catchment. The two components on the left side of this diagram are based on federal information and enable flows to be computed simultaneously throughout the stream network of the continental US, and to be corrected by real-time observations produced at stream gage sites, and by forecasts at about 3600 locations on larger streams and rivers being produced in parallel with the NFIE-Hydro by the normal National Weather Service River Forecast System.
The two components on the right of the diagram, NFIE-Response and NFIE-River, describe local scale information at the level of a county, city, state or water agency that is concerned with flooding within its own region. NFIE-Response describes a plan for flood response action developed by a local emergency response community that includes a flood warning map whose reach-based flood warning zones are colored during a flood event according to the National Weather Service standard flood warning
4
classification. NFIE-River is a database of river channel information and associated flood hydraulic
models that can be used to flood emergency response planning and real-time flood inundation mapping. NFIE-Response and NFIE-River are based on local information and interpretations, and are intended to support implementation of the NFIE-Hydro flood forecasts to help local flood emergency response and community resilience.
Figure 1. Components of the National Flood Interoperability Experiment (NFIE)
All four components just described rest upon a foundation of flood information services called NFIE-Services. NFIE-Services is a set of standardized web services for water and weather observations and forecasts, which will initially consist of those coming from the federal government, but later may include comparable services produced by local and regional water agencies.
The direction of the arrows in Figure 1 conveys the flow of information through the NFIE components – the geospatial information from NFIE-Geo creates the framework for hydrologic modeling in NFIE-Hydro, whose forecast flows enable flood inundation mapping in NFIE-River, which informs flood emergency response in NFIE-Response. NFIE-Geo and NFIE-Hydro are both national frameworks at the scale of the continental United States, not yet including Alaska, Hawaii and or other territories. River and NFIE-Response are regional and local in scope where the availability of detailed river channel information and the engagement of the flood emergency response community supports their implementation. The arrow connecting NFIE-Hydro and NFIE-Response is meant to indicate that even in the absence of detailed river channel information, real-time flood mapping can be carried out using a floodplain map of fixed areal extent whose risk level is colored according to the National Weather Service flood warning classification.
Each of the five components is itself a complex task, so this summary paper is meant to outline the possible content of each component as a precursor to a more comprehensive description of the
5
Texas, and flooding in the Onion Creek watershed in Austin, Texas are used to provide illustrative examples of the conceptual framework. During Halloween 2013, a severe flood occurred almost without warning in the Onion creek watershed in which 700 homes were flooded and five people were drowned.
NFIE-Geo: National Geospatial Framework for Hydrology
NFIE-Geo is a geospatial information database at high spatial resolution covering the continental United States being assembled by the Subcommittee for Spatial Water Data to support the NFIE. It is an initial version of what may later come to be called a National Water Data Infrastructure. Central to this is the National Hydrography Dataset (NHD)3, which was developed by the USGS and EPA approximately during
the period 1995 to 2005 to combine the digital representation of the “blue lines” on USGS topographic maps with EPA information on the connectivity of stream reaches and water bodies to form a
topologically connected flow network across the United States. During the same period, there was developed a National Elevation Dataset for land surface terrain at 30m and then 10m scale, a National Land Cover Dataset based on Landsat remote sensing to define the percent distribution of land cover, and a Watershed Boundary Dataset which formally defines watershed boundaries in a six-level hierarchical system called Hydrologic Unit Codes. During the period from approximately 2005 to the present, these four national datasets were combined into a composite dataset called NHDPlus4 in which
the land surface of the continental United States is subdivided into 2.67 million elementary “reach catchments” where each reach catchment is traversed by a single flow line. Both the reach catchment and its flow line have a common identifier, or COMID, which is uniquely numbered across the nation. Thus the land and water systems of the nation are connected. Attributes of the reach catchment define local properties such as catchment drainage area and land cover distribution. Attributes of the flow line define the cumulative value of these properties over all upstream reach catchments. Flowline attributes also include an estimate of the mean annual flow and the average velocity on the flow line. The average size of the reach catchments is 3 square kilometers, and the average reach length is 2 km. This spatial resolution is sufficiently detailed to provide information for local flood emergency response operations at the stream and street level.
In a parallel development, beginning in 2003, FEMA initiated an ambitious plan called Flood Map Modernization, working with cities and counties and their engineering contractors to update Flood Insurance Rate Maps and convert them to digital form. A Digital Flood Insurance Rate Map (DFIRM) is a set of geospatial information layers that define the spatial extent of flood inundation area for the 100 year flood, or Base Flood, and in some areas provide the Base Flood Elevation as well. If a home mortgage loan comes from a federal source, the homeowner is required to purchase federal flood insurance if the home lies within the flood hazard zone area. The DFIRMS from individual cities and counties have been synthesized into a National Flood Hazard Layer (NFHL) that covers 60% of the land area and 88% of the population of the United States. Flood Map Modernization has been followed by a new FEMA program called RiskMAP (Risk Mapping Assessment and Planning) which includes flood depth and velocity grids over the floodplain and enables individual home owners to assess their actual flood risk in relation to their location within the floodplain.
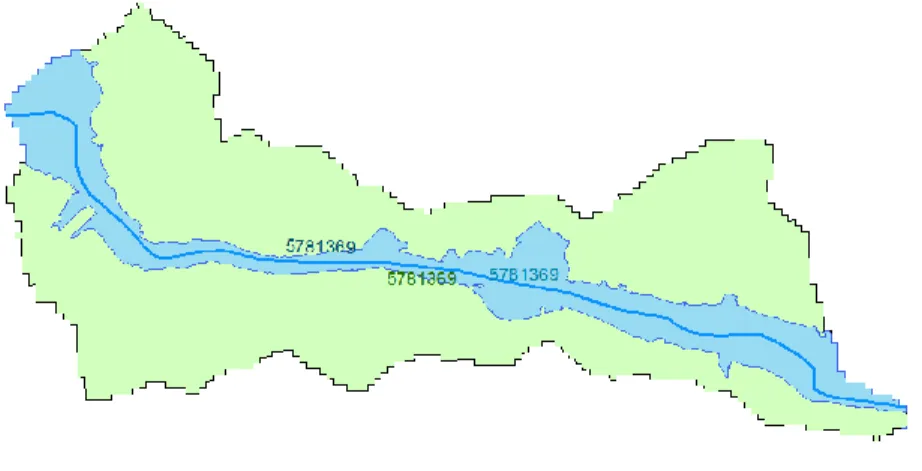
The NHDPlus and National Flood Hazard Layer can be intersected so that an elementary flood warning zone is created for each reach catchment where flood mapping has been done, as illustrated in Figure 2, for reach catchment 578139, which is located on Onion Creek in Austin, Texas. If the reach flood
3 Further information about the National Hydrography Dataset is at: http://nhd.usgs.gov/ 4 Data for the NHDPlus are accessible at http://www.horizon-systems.com/nhdplus/
6
warning zone is similarly labelled 578139, and a national flood forecasting system can be built on the reach catchment scale, then real-time flood risk information can be developed for each reach flood warning zone, and thus local flood emergency response supported for situations like the Halloween Flood. A challenge for the National Flood Interoperability Experiment is to allow for the fact that the National Flood Hazard Layer does not exist for 40% of the land area of the United States, including much of its rural lands.
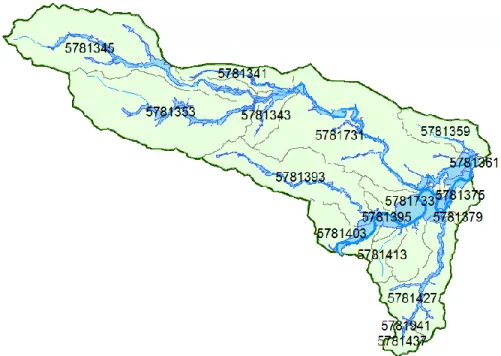
Figure 2. A reach catchment on Onion Creek with its associated stream reach and flood warning zone While the reach catchment is a useful unit for localized flow computation and flood warning, a larger drainage area is need for flood emergency response planning on a watershed basis. This is provided by the most refined level of the Watershed Boundary Dataset5 called the HUC12 Subwatersheds. The term
HUC12 refers to the numbering system for the subwatersheds. Figure 3 shows a Subwatershed for part of the Onion Creek drainage area. This Subwatershed has a 12-digit identifying number 120902050408, which means that it lies within Water Resource Region 12, Subregion 09, Basin 02, Subbasin 05,
Watershed 04, Subwatershed 08. This particular subwatershed has 19 reach catchments defined within it, but this number varies from one water resource region to another depending on how densely defined the stream network is at that region. The subwatershed and reach catchment boundaries are spatially coincident where they overlap.
The HUC12 Subwatershed scale is also where a great deal of detailed physical information for hydrologic modeling has been compiled nationally. For example, the HydroTerre system from Penn State
University has available about 200 TB of information about “Essential Terrestrial Variables” on elevation, soils, geology, land cover, precipitation and atmospheric conditions, subwatersheds and NHD stream reaches. This information is indexed by HUC12 Subwatersheds and can be downloaded to support detailed hydrologic modeling on any subwatershed using the Penn State Integrated Hydrologic Model (PIHM)6 or other approaches.
5 The Watershed Boundary Dataset was developed by USDA Natural Resources Conservation Service and the US
Geological Survey under a procedure defined by the Subcommittee on Spatial Water Data. More information is at:
http://www.nrcs.usda.gov/wps/portal/nrcs/main/national/water/watersheds/dataset/
6 Further information about HydroTerre is at http://www.hydroterre.psu.edu and about PIHM is at
7
Figure 3. Subwatershed 120902050408 and its associated reach catchments.
Figure 4: An NWS River Forecast Center Subbasin and Forecast Point, ATIT2, which contains 76 reach catchments. This is the drainage area of Onion Creek at Highway 183 in Austin, Texas
The National Weather Service has thirteen River Forecast Centers (RFCs) distributed across the nation which are continually running hydrologic models and producing river flow forecasts for fairly large subbasins on large rivers and their principal tributaries. One such RFC subbasin, labelled ATIT2,
encompasses the drainage area of Onion Creek above Highway 183 in Austin, Texas, as shown in Figure 4. During flood conditions this is one location of about 3600 in the country where the NWS issues
8
official flood forecasts7. Precipitation and runoff over the Subbasin are forecast, as is the discharge at
the Forecast Point located at the Subbasin outlet. About three quarters of the NWS forecast points are collocated with USGS stream gage sites to facilitate forecast verification. It happens that this forecast subbasin ATIT2 contains 76 NHDPlus catchments of which the example catchment 5781369 in Figure 2 contains the forecast point at the ATIT2 subbasin outlet. It follows that NFIE flood forecasts defined on NHDPlus stream reaches can thus be compared with forecasts coming from the NWS River Forecast Centers, and perhaps adjusted so that the reach catchment scale and NWS Subbasin scale forecasts are consistent with one another.
Besides catchment and stream reach data, geospatial information is also needed for water bodies, dams, and stream gage locations. Geospatial information for these three data layers nationally will also be derived from the NHD and be part of NFIE-Geo. The waterbodies, stream reaches, dams, gage locations and forecast points will be topologically connected to the NHD stream network. A sample version of some layers of NFIE-Geo has been prepared at the University of Texas and made publicly accessible through HydroShare, an NSF-supported research program designed to provide a storage platform for sharing of hydrologic data, models and other information.8
NFIE-Hydro: National Hydrologic Simulation Framework
Continental scale hydrologic modeling of the vertical interaction between the land surface and the atmosphere has been carried on for more than a decade using gridded land-atmosphere models. These form the basis for national weather and climate modeling. Such models require a framework to connect them with the modeling of the atmosphere itself, and one such framework is WRF-Hydro, developed at the National Center for Atmospheric Research. WRF-Hydro is “both a stand-alone
hydrological modeling architecture as well as a coupling architecture for coupling of hydrological models with atmospheric models”.9 The term WRF refers to the Weather Research and Forecasting model,
which is a “mesoscale numerical weather prediction system designed to serve both atmospheric research and operational forecasting needs”.10 The National Weather Service is examining the
application of WRF-Hydro as a framework for connecting atmospheric and hydrologic modeling at the National Water Center and it will be used as one of the key elements of the NFIE.
One of the weather models possessing interoperability with the WRF-Hydro framework is the High Resolution Rapid Refresh (HRRR) model, which is “a NOAA real-time 3-km resolution, hourly updated, cloud-resolving atmospheric model, initialized by 3km grids with 3km radar assimilation”.11 The NWS
uses this model to forecast precipitation up to 15 hours in advance, and thus by using its results in the NFIE, it is possible to examine the hypothesis that flood runoff can be forecast for small watersheds before the rainfall even begins in the watershed. If proven to be accurate and reliable, the advance
7 The information for forecast point ATIT2 can be seen at
http://water.weather.gov/ahps2/hydrograph.php?wfo=EWX&gage=ATIT2 During non-flood periods, just the
observations up to present are displayed, drawn from a USGS gage at the same location. When floods happen, the forecast information also appears in the web site.
8 This draft version of NFIE-Geo for 12 hydrologically distinct water resource regions can accessed through a web
map interface as follows. Click on the map region to obtain access to the data for that region.
https://www.arcgis.com/home/webmap/viewer.html?webmap=2c30160429984a59873f26b9d118dbfe
9 Further information about WRF-Hydro is at: http://www.ral.ucar.edu/projects/wrf_hydro/
10 Further information about the Weather Research and Forecasting model (WRF) is at:
http://www.wrf-model.org/
9
knowledge of expected flood magnitudes and their uncertainly would be of very significant value in planning local flood emergency response.
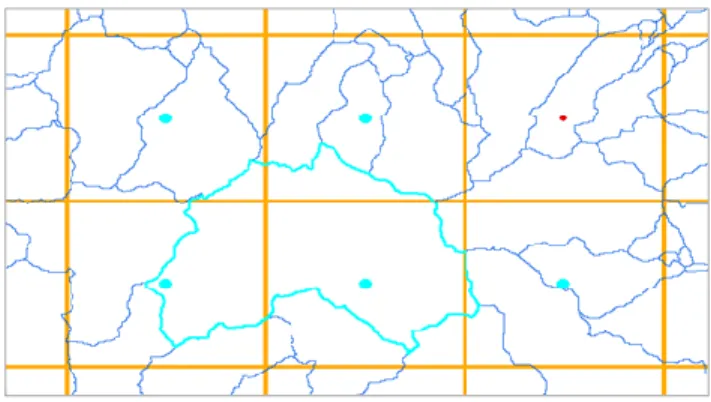
In a gridded land-atmosphere model each grid cell is an elementary unit in the landscape, and in the NHDPlus framework, the reach catchment plays the same role as an elementary landscape unit. It follows that to make the NFIE function effectively, a rapid connection is needed to convert runoff between grid cells and reach catchments. This “grid to catchment” conversion can be done by intersecting the grid cells and the catchments and compiling a set of area weights that define for each catchment (boundary highlighted in blue in Figure 5) the grid cells (highlighted as blue dots at their center points) contribute runoff to that catchment, and what proportion of the runoff comes from each grid cell. A set of weights of this kind has been computed as part of the NFIE to connect a WRF-Hydro gridded representation of the continental United States with the 2.67 million catchments in the NHDPlus representation of the same landscape. Similar weight computations can be made for other hydrologic models using a different grid cell layout and spacing.
Figure 5. Linking grid and catchment based representations of the landscape
One method of routing flow through the river network is to use a model called RAPID 12 or Routing
Application for Parallel computation of Discharge, which was specifically developed to operate on top of the NHDPlus stream reach network and uses parallel computation to solve the Muskingum flow
equations on very large river networks. Each NHDPlus reach has attributes of stream length and average flow velocity, and from these the time of travel on the reach can be estimated, and with an estimate of degree of water storage as the flow traverses the reach, the discharge at the lower end of the reach can be computed. As part of the mobilization phase for the NFIE at the University of Texas, RAPID has been coupled to WRF-Hydro and used to compute flows as a function of time on all 2.67 million NHDPlus reaches in the continental United States for a 14-day historical period. Work is ongoing to enable WRF-Hydro coupled with RAPID to operate at the continental scale in a real-time mode with forecasts updated daily.
An alternative approach to weather and hydrologic modeling at the continental and indeed at the global scale, is provided by the Global Flood Awareness System (GloFAS) of the European Center for Medium-Range Weather Forecasts (ECMWF) and the European Joint Research Commission. The ECMWF supports weather agencies in European countries by providing weather forecasting beyond five days ahead, and has also developed an operational system for forecasting flood response on European river basins called the European Flood Awareness System (EFAS). GloFAS is a research effort aimed at
10
extending the EFAS approach globally13 to provide a capability for anticipating floods some days or
perhaps even weeks before their occurrence.
In parallel with the development of the NFIE, researchers at Brigham Young University have shown that the GloFAS weather and hydrologic simulations can be coupled to RAPID routing of flows in rivers in some international basins, and they have also succeeded in executing this ECMWF-RAPID coupling for the 67,313 NHDPlus reaches in the Texas Gulf region, which is Water Resources Region 12 of the United States. As shown for reach catchment 5781369 in Figure 6, the forecast is for 15 days ahead from January 13, 2015, and results in an ensemble of 50 forecast hydrographs whose statistical characteristics (mean, maximum, mean + standard deviation) are illustrated.
Figure 6. Ensemble flow forecast for reach catchment 5781369 in the Texas Gulf region14
It is unclear with what fidelity such long range forecasts can be made and this question will be examined as part of the NFIE. The ECMWF forecasts are for six hour time intervals, the same as is used by the NWS River Forecast Centers, so this information will be of limited use during flash floods where the main storm event may last just for a few hours, but may be insightful ahead of flood occurrence to anticipate the likely flood magnitude and the potential for something much larger to occur.It appears from these demonstration examples that ensemble flood forecasting systems operating at the NHDPlus reach catchment scale can be developed for the continental United States. The weather and hydrology models just described are meant to be illustrative and not definitive of approaches that could be tested during the NFIE Summer Institute. A very important part of the NFIE is to test alternative modeling approaches that could be used in such an ensemble forecasting system and examine the advantages and limitations of each. If the geospatial framework used for a particular hydrologic model is different from NFIE-Geo, then a mapping like that shown in Figure 4 could be developed so that the results from a different hydrologic models can be compared using the NFIE-Geo framework.
13Further information about EFAS is at: http://www.ecmwf.int/en/research/projects/efas and about GloFAS is at:
http://www.globalfloods.eu/en/
14 Source of information: Jim Nelson, Nathan Swain, Alan Snow of Brigham Young University
11
NFIE-River: Local River Hydraulics and Flood Inundation Mapping
Once a flow forecast is available the next task is to translate that into a forecast of flood water surface elevation in the river channel and a map of flood inundation over the floodplain. The USGS and National Weather Service have a joint program of flood inundation mapping15 at National Weather Service
forecast point locations that are also USGS stream gage locations. At these locations, a flood
inundation map library is computed in uniform increments of water surface elevation such as one foot. Then, as the discharge forecasts are made, they are converted into the corresponding water surface elevations using a rating curve for the stream gage site, and the corresponding flood inundation map is selected from the library. As illustrated in Figure 7, the left side of the map has a scale both in elevation above the NAVD88 geodetic datum, and in stage height or height above the reference elevation for the stream gage.
As the cursor is moved up and down over the elevation scales on the left side of the map, the inundation area expands or contracts in the map display. The relative colors of blue in the inundation map refer to the depth of inundation at that location shown in the scale on the right hand side of the map. The North American Vertical Datum of 1988 (NAVD88) is a surface of constant gravitational potential defined to be zero elevation, which approximately corresponds to mean sea level.
The appearance of two vertical elevation scales on this map is instructive. The National Weather Service uses stage height to establish its reference heights for flood warnings (e.g. Action Stage, Flood Stage, Moderate Flood Stage and Major Flood Stage). FEMA uses water surface elevations above
geodetic datum to relate to similarly measured elevations of the first floor elevations of homes and thus to assess the risk of individual homes being flooded. Both elevation scales are needed to get a complete picture of flood warnings and impacts.
The map in Figure 7 has an extent of one mile upstream and downstream of the stream gage,
comparable to the average length of a stream reach in a reach catchment. There are several hundred of these real-time flood inundation mapping sites distributed across the nation, so the length of stream miles thus mapped in real time is very small compared to the total of about 4 million miles of rivers and streams that exist nationally. Another solution is needed for mapping flood inundation in the stream reaches without stream gages located on them.
15 More information about the USGS flood inundation mapping program is at:
12
Figure 7. Flood inundation mapping on Onion Creek at Highway 183 in Austin, Texas, which is NWS forecast point ATIT2 and USGS streamgage 08159000.16
Suppose in each reach catchment, the stream reach has a representative point located on it, such as at its midpoint, and a rating curve relating discharge to water surface elevation is available there, as illustrated in Figure 8 for a cross-section near the midpoint of the reach 5781369 shown Figure 2. The information shown in Figure 8 is derived from a HEC-RAS model of flood flow in Onion Creek developed by the City of Austin.17 HEC-RAS stands for Hydrologic Engineering Center, River Analysis System model,
which is a product of the US Army Corps of Engineers widely used for modeling river hydraulics and flood inundation. The four points shown in the rating curve relating stage height (ft) to discharge (cfs) in Figure 8 correspond to flood discharges with return periods 10, 50, 100 and 500 years used for the flood modeling in this creek. The HEC-RAS hydraulic model has 58 such cross-sections in the reach 5781369 and the stage height versus discharge relationship has a smooth variation progressing along the reach from one end to the other. This suggests that there may be some way to generalize the flood rating curves for stream reaches and thus to develop them for reaches that do not have detailed hydraulic geometry and modeling available.
Normally in river hydraulic models, the cross-sections are numbered in terms of flow distance such that cross-section 60255 means a cross-section located 60255 feet from the downstream end of the modeled
16 Source of map: http://water.weather.gov/ahps2/inundation/inundation_google.php?gage=atit2 17 This model can be obtained from http://www.austintexas.gov/floodpro/
13
channel reach. This stream addressing system is sufficient for the purposes of the hydraulic model but for a national flood inundation mapping system, a national stream addressing system is needed. The National Hydrography Dataset has such national stream addressing system indexed by a ReachCode, shown in Figure 8 as 12090205000078, which signifies stream segment 78 in HUC8 Subbasin 12090205. The precise location within this stream segment is given by the percent distance from the lower end of the reach. Hence, locally determined cross-sections and rating curves from flood hydraulic modeling can be located by linear referencing on the NHD stream network covering the nation.
Figure 8. Cross-section and rating table from a HEC-RAS model of Onion Creek.
Over the last decade, more than $2 billion has been spent on FEMA floodplain mapping, which may be the largest civilian mapping program in the world. This large investment has inspired the emergence of a commercial industry for LIDAR (LIght Detection And Ranging), which is used for precise land surface terrain mapping. There are hundreds of HEC-RAS and other hydraulic models that have been created to support regulatory flood mapping at many locations in the nation, and also for hydraulic modeling of the large main stem rivers such as the Missouri, Mississippi and Ohio rivers. If rating curves and tables like that shown in Figure 8 can be defined from this information at modeled locations, and if a way can be found to generalize these rating curves in unmodeled reaches, then forecast flood discharge can be translated into forecast flood water surface elevation at a representative location in each stream reach. Flood inundation maps could thus be created for ungaged reaches in the manner shown in Figure 7. A relevant question is how to translate the sophisticated flood forecasting information described in the earlier sections of this paper into “actionable intelligence” or decision support information for the first
14
response community and the public during a flood event. One way to do this is to adopt the National Weather Service color scheme for the flood warning, as shown in Figure 9. This might be done in a simple way by comparing the ensemble flood forecast discharges with the return periods on the flood frequency curve. If this colored map were time-indexed to the flood forecast so that the colors changed as the flood passes through the area, then the time available for action and completing flood warnings and evacuations would be clearer.
A more sophisticated approach would create a library of flood inundation maps like those in Figure 7, complete for all flood warning zones in a subwatershed, and indexed by flood return period. By “dialing up or down” the flood return period, the flood warning map would extend or diminish in area. By intersecting these maps with layouts of the road network, critical infrastructure and key resources, housing footprints, and address points, and assessment can be made for each subwatershed of the infrastructure and people at risk for floods of varying severities. By coupling these estimates with the ensemble flood forecast, a probability estimate of the impact on people and the economic flood damage could be made. It is particularly important after a flood happens to be able to quickly quantify its damage because this facilitates a rapid declaration of a federal disaster and the availability of disaster relief funds.
Figure 9. National Weather Service flood warning levels and colors18
The process just described for flood inundation mapping can be called “static” in the sense that there is a unique relationship between stage height and discharge defined by the rating curve arising from steady flow computation in the reach. A more complete “dynamic” flood inundation mapping system requires a solution of the St Venant equations of unsteady,one-dimensional river flow that can be applied over very large river networks, and also the river channel cross-section and roughness
information used in HEC-RAS modeling. One such open source model is SPRNT19 (Simulation Program
for River Networks), developed through a collaboration between the University of Texas and IBM, that
18 Source of information:
http://www.nws.noaa.gov/os/water/ahps/resources/Guide_to_Hydrologic_Information_Brochure.pdf
15
adapts ideas from Very Large Scale Integrated design of the flow of electricity in computer chips to be applied to flow of water in river networks. In some instances, two-dimensional flood modeling and mapping is needed to depict accurately the movement of water over large flat areas. There are also higher dimensional hydraulic modeling programs such as ADCIRC and Delft3D applicable at the coastline and where rivers are broad and tributaries merge.
The most advanced state-level floodplain mapping program in the United States is in North Carolina where the North Carolina Floodplain Mapping Program has developed state-wide LIDAR terrain data coverage and a very sophisticated Flood Risk Information System20 capable of computing the flood risk
at individual homes in the flood hazard zone. Elements of this system are shared by flood mapping programs in Alabama and Virginia. The Iowa Flood Information System also has a very well developed set of flood maps for individual communities in Iowa and a state-wide flood forecasting system that provides real-time information to updating the present status of the flood inundation.21
NFIE-Response: Local Flood Emergency Response Planning
Flood forecasts are used directly by the public and also by the emergency response community which has to respond when people need to be rescued from flooded homes and streams. These actions are carried out by Fire Departments and also by law enforcement Departments, and are coordinated through Emergency Operations Centers that cities, counties, states and water agencies operate during flood events. All of these organizations depend upon the National Weather Service to provide them with weather and flood forecast guidance. The key questions that emergency responders face when dealing with a flood event are: “How large is the problem, and how much time do I have?” Flood Emergency Response Planning has two parts – a pre-flood planning effort that studies the flood potential over a region and devises plans to cope with floods of various severities and locations, and a flood action plan that supports decision and deployment of resources before, during and after an actual flood event.
When an emergency (911) phone call is made, depending on the caller’s geographic location, the call is routed to a particular Public Safety Answering Point (PSAP) from which appropriate emergency response vehicles (fire, ambulance, police) are dispatched to the requested location. If this is a street address, the location is shown by an Address Point on a map, as shown in Figure 10. There are about 500,000 such address points in Travis and Williamson Counties, Texas, which encompass the City of Austin.
A rather obvious way to assess how many people could be affected by flooding in a particular area is to intersect the flood hazard zone map with the address points and the count how many address points could be flooded in each area of the floodplain, as illustrated in Figure 10 for a portion of the Onion Creek floodplain whose homes were heavily damaged in the Halloween Flood.
20 North Carolina Flood Risk Information System: http://fris.nc.gov/fris/ 21 Iowa Flood Information System: http://ifis.iowafloodcenter.org/ifis/en/
16
Figure 10. Address Points in Travis and Williamson Counties, Texas
Figure 11. Address Points in the Floodplain of Onion Creek, Austin, Texas.
The total number of address points subject to flood risk can then be summarized by subwatershed, as shown in Figure 12. The example subwatershed 120902050408 shown in Figure 3, has 1981 address points within its floodplain in Figure 12. A moment’s reflection shows the magnitude of the problem – if a flood is immanent in this area, how do you alert and warn people in 1981 homes? Is there enough
17
time available for them to evacuate? If so, where should they go for shelter? Are the roads flooded that they would normally take to leave their home? Is the flood peak so immanent that they would be safer staying at home to “shelter in place” than trying to evacuate?
A potential use of cell phone technology is to target flood warnings from cell phone towers to all phones in the tower’s target area that are geographically located within a floodplain. Such warnings might be automatically triggered under prescribed flood conditions and lead to location-specific flood warnings rather that county-wide warnings as is normally the case now.
A comparable map to that shown in Figure 11, can be obtained by intersecting the floodplain with the transportation network and computing the length of streets and roads within the floodplain. This result is also shown by subwatershed in Figure 12, and it has a similar pattern of high concentrations of flooded roads where there are flooded homes in Travis County. Example subwatershed 120902050408 has 52 km of flooded roads. In the northern part of Williamson County, there is a greater risk of flooded roads compared to flooded homes. As can be seen from the distribution of address points themselves in Figure 8 that the northern part of Williamson county is still largely rural land and has not been
extensively urbanized. Thus the roads flooded there have less traffic on them than those in Travis County, at least at present – urban development is happening rapidly in this area!
Figure 12. Number of address points and length of streets and roads in the floodplain, indexed by subwatershed, for Travis and Williamson Counties, Texas.
A “Wide Area Flood Plan” is needed for these two counties that will take each flood warning unit within a reach catchment, assess its flood risk and devise appropriate plans for flood emergency response, and inform the public through a Public Education program of what to do in a flood event.
NFIE-Services: Web Services for Sharing Flood Information
During a flood event, a great many organizations and individuals exchange information as to anticipated and current flood conditions. In part, the desire to achieve greater cohesion concerning flood
18
Science and Services (IWRSS) consortium among the federal water agencies. The charge for the Open Water Data Initiative states:
“Quantifying the availability, use, and risks to our national water resources is an effort of national importance for the present and the foreseeable future. Improving access to data and enabling open exchange of water information is foundational to identifying and understanding existing water resources issues and developing sustainable future solutions particularly in the face of climate change and unprecedented drought. To address this challenge, we are proposing a new Open Water Data Initiative that will integrate currently fragmented water information into a connected, national water data framework and leverage existing systems, infrastructure and tools to underpin
innovation, modeling, data sharing, and solution development.”22
Several years ago, the US Geological Survey established a water data services infrastructure, which includes an Instantaneous Values Service23 and a Daily Values Service, which both use the WaterML2
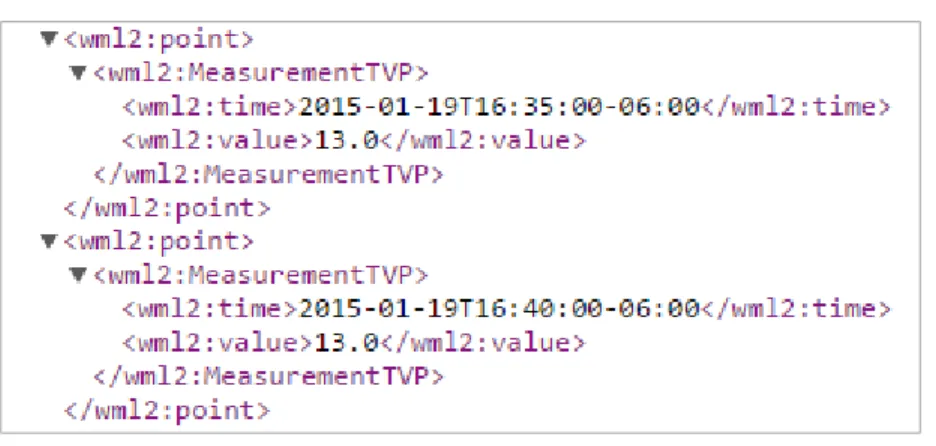
language for publishing hydrologic time series. A research project under CUAHSI developed the original WaterML language, and it was later modified and adopted in the WaterML2 form as a standard by the Open Geospatial Consortium.24 In this standard, time series information is presented as a sequence of
time-value pairs, as shown in Figure 13, and the header of the message contains a metadata description of the origin of the information, measurement site, units of measure, etc. For example, if the web reference below is copied into a web browser, a result is almost instantaneously returned that provides information from site 08159000 (Onion Creek at Highway 183) for P1D (last one day) and parameter code 00060 (Streamflow):
http://waterservices.usgs.gov/nwis/iv/?format=waterml,2.0&sites=08159000&period=P1D¶meterCd=00060
and the result shown in Figure 13 provides streamflow information with a 5 minute time interval complete in this instance up to about 10 minutes before the retrieval was made. It is remarkable that the United States has such an effective real-time infrastructure for real-time streamflow data services.
Figure 13. Streamflow information as a sequence of time-value pairs in the WaterML2 language.
22 “Open Water Data Initiative: Proposal and Charge for Discussion”, Advisory Committee for Water Information,
21 July 2014, http://acwi.gov/acwi-minutes/acwi2014/Open_water_data_proposal_to_acwi-7-21-14.pdf
23 For further information, see http://waterservices.usgs.gov/
19
As part of the NFIE, the National Weather Service has committed itself to similarly publishing in
WaterML2 its forecast information from its 3600 hydrologic forecast points, such as for site ATIT2 shown in Figure 4. The variables published will be precipitation over the drainage area (inches), runoff from the drainage area (inches), and discharge at the NWS forecast subbasin outlet (cfs), in six hour time
intervals. This NWS hydrologic forecast service will synthesize the forecast information produced by the 12 River Forecast Centers in the continental United States, and be housed at the University of Alabama adjacent to the National Water Center. Together, these web services for USGS water observations and NWS forecast information establish for the first time in the United States a common language for publishing through the internet the past, present and future of hydrologic conditions at a point. That is quite a signal milestone in its own right. Other national agencies such as NASA, and commercial water database providers such as Kisters and Aquatic Informatics, have also adopted the WaterML2 for web services of hydrologic time series.
The gridded forecast information being used in the NFIE will be obtained from the Internet Data Distribution system operated by Unidata in Boulder, Colorado.25
It is intended that all of the geospatial information layers in NFIE-Geo will be published by agencies responsible for those layers, based on guidelines developed by the Subcommittee for Spatial Water Data. This will include the NHDPlus data layers, the flood inundation map information from the National Flood Hazard Layer, the USGS gage site locations, the NWS forecast points and the NWS forecast
subbasins. Publishing this information as services will facilitate access to it and subsetting for particular areas of the country.
It should be noted that forecast information arising from various alternative experiments in the NFIE Summer Institute will not be made publicly available in real-time to avoid any confusion with official forecast products created by the National Weather Service. The NFIE forecast information will be shared among the research teams and a selected set published at a later time as part of the regular journal publication process for papers arising from NFIE research.
Research Questions
Some research questions for the NFIE Summer Institute suggest themselves from this discussion: 1. How can flood warning zones of sufficient accuracy to support flood emergency response
actions be defined for reach catchments in the 40% of the nation not covered by the National Flood Hazard Layer?
2. Can short-term rainfall forecasting be used to forecast flood runoff before the storm begins in a small watershed?
3. Can long range flood forecasting up to 10-15 days in advance of the event be accomplished? 4. What is the statistical distribution of the ensemble forecasts and how can this be formulated as
a probability model?
5. How does the uncertainty in the flood discharge forecast translate to uncertainty in the corresponding water surface elevation?
6. Can a flood rating curve function be generalized for stream reaches over a region and thus enable development of flood rating curves for reaches that do not have detailed hydraulic geometry and modeling available?
20
7. How can ensemble flood forecast information be interpreted to apply a five-stage color-coded warning status for reach flood warning zones?
8. How can flood information services for local, regional and national flood information be made publicly accessible for a particular application area in real-time as flood events occur?
Many things have been glossed over in the discussion in this paper. There are formidable technical challenges to produce the information envisaged here in a timely fashion during flood events and many research questions of a technical character arise from the cyberinfrastructure needed to operate the NFIE. Other research questions will suggest themselves as planning for the NFIE proceeds. The questions just described are meant to provide a sample of issues that might be investigated.
Conclusions
The National Flood Interoperability Experiment (NFIE) is a unique opportunity in the development of hydrology at the national scale in the United States. If successful, the locations at which flood forecast information is available would increase from the present approximately 3600 to about 2.67 million, which is a factor of more than seven hundred times more spatially dense. If achieved, this would truly be a transformative change for the practice of hydrology in the United States. Ensemble flood forecasts would be provided on a probability basis for local areas before storm events occurred, which would significantly improve the capacity for flood emergency response planning. Real-time flood information would provide guidance as to the anticipated map of spatial flood risk over a region. These
improvements in the nation’s flood forecasting system would help to save lives during floods, and would enable communities to become more flood-aware and flood-resilient.
The conceptual framework for the NFIE is divided into five components: Geo, Hydro, NFIE-River, NFIE-Response and NFIE-Services. NFIE-Geo is very well defined based on authoritative federal information that is publicly accessible, and from this an application NFIE-Geo geodatabase at the county or regional scale can readily be developed anywhere in the continental United States. NFIE-Hydro is the continental scale flood forecasting framework which will be functional by the time of the NFIE Summer Institute but whose forecast inputs, simulation models, data processing methods, and visualization of results need considerable work before they will be fully useful. NFIE-River is the local and regional scale river hydraulics and flood inundation mapping component, which is still in its formative stages in which alternatives are being tested and a standardized approach will be further developed at the NFIE Summer Institute. NFIE-Response is a methodology for flood emergency response planning in local communities based on NFIE information. This is just beginning to be defined and the NFIE Summer Institute should see considerable progress on this component. NFIE-Services are based on existing federal data systems that are gradually being harmonized through the use of standards such as WaterML2.
As can be seen, the maturity of the various NFIE components differs significantly from one to another. However, the foundational elements, in particular NFIE-Geo and NFIE-Hydro, are sufficiently advanced that it can be anticipated that during the NFIE Summer Institute a continuously functioning simulation and forecasting of flow in the 2.67 million reach catchments of the continental United States will be carried out. Of course, this is far from having an operational forecasting system at this high spatial resolution. The NFIE is meant only to create a demonstration example of what the National Water Center may at some point in the future be able to make operational for the nation.
From the research perspective, what is being constructed as part of the NFIE is the first comprehensive real-time common operating picture of water conditions across the nation. The scale and spatial resolution of the data assembly, hydrologic and hydraulic modeling, ensemble forecasting and
21
now” in which continental scale hydrologic forecasting is being treated in much the same way as is normal for continental scale weather forecasting. The association of the National Flood Interoperability Experiment with the new National Water Center means that as this Center gradually becomes
established, the results of the experiment will inform how the National Weather Service and their IWRSS partners decide to operate the Center in the future. In this manner, the knowledge and insight of the academic community and the commercial sector partners can contribute in a significant way to the future practice of hydrology in the nation.
Appendix: Nomenclature
Base Flood – a flood discharge with a 1% probability of being equaled or exceeded in any year
Base Flood Elevation – the water surface elevation of a base flood
Base Flood Hazard Zone Area – the area of flood inundation if base flood conditions occur uniformly over a region
Dynamic Flood Inundation Map – a map over a region of the spatial extent of flood inundation showing water surface elevation and inundation area varying in space and time as a flood occurs.
Flood Rating Curve – a table that defines the water surface elevation, stage height and discharge at a stream cross-section for a set of specified flood frequencies.
Flood Inundation Map Library – a set of static flood inundation maps for a sequence of specified flood frequencies or water surface elevation increments.
National Stream Network – a high resolution stream network for the nation that includes the reach flowlines but also additional tributary streams within the reach catchments.
National Flood Hazard Layer – a geospatial database for the Base Flood Hazard Zone Area of that part of the United States for which FEMA Flood Insurance Rate Maps have been approved.
National Flood Interoperability Experiment (NFIE) – a one-year collaboration among government, academia and industry to help demonstrate the next generation of national flood hydrology and emergency response at the National Water Center.
NFIE-Geo – a national geospatial data framework for hydrology. This is the initial version of what may later come to be called a National Water Data Infrastructure.
NFIE-Hydro – a continental scale hydrologic simulation framework operating on NFIE-Geo linking weather forecasts, land-atmosphere modeling and channel flow routing to produce probabilistic flood forecasts.
NFIE-River – a database of river channel information and associated flood hydraulic models that can be used to support flood inundation mapping.
NFIE-Response – a plan for flood response action developed by a local emergency response community.
NFIE-Services – a set of standardized web services for water and weather observations and forecasts.
Open Water Data Initiative – an initiative of the Subcommittee on Spatial Water Data to provide a framework for open sharing of standardized water data services in the United States.
22
Reach Catchment – a local drainage area that has only one flow inlet and one flow outlet. The inlet and outlet are joined by a Reach Flowline, which shares the same unique identifier as the Reach Catchment. The continental United States is divided into 2.67 million reach catchments.
Reach Flood Warning Zone – the base flood hazard zone area within a Reach Catchment. This is the anticipated area of flood risk if a flood is occurring.
Reach Flood Warning Map – a map in which reach flood warning zones are colored according to National Weather Service flood warning levels.
Reach Flowline – a single stream centerline or artificial path through a waterbody that links the inlet and outlet of a Reach Catchment. Each Reach Flowline shares the same unique identifier as the Reach Catchment that drains to it.
Stage Height – the elevation of a water surface above a local datum, such as that established at a stream gage, or at the minimum bed elevation of a stream cross-section.
Static Flood Inundation Map – a map over a region of the spatial extent of flood inundation for a specified flood frequency.
Stream Cross-Section – a line drawn across a stream channel transverse to the flow direction, which contains a set of points whose vertical elevation defines the bed of the stream channel and the land surface elevation of the adjacent flood plain.
Subcommittee on Spatial Water Data – the water subcommittee of the Federal Geographic Data Committee and the spatial subcommittee of the Advisory Committee on Water Information.
Subwatershed – a collection of contiguous Reach Catchments that describe a drainage area. The continental United States is subdivided into approximately 86,000 Subwatersheds.
WRF-Hydro – Weather Research and Forecasting – Hydro is a community-based, coupling architecture supported by the National Center for Atmospheric Research for building large scale hydrologic
simulation systems