Effectiveness of Household-Based Poverty Programs: Lesson Learn
from Indonesia
Luh Gede Meydianawathi Ni Putu Wiwin Setyari
Economics and Business Faculty, Universitas Udayana Corresponding Author: [email protected]
Abstract
Poverty is a social dimension in a society that cannot be solved easily. Various government programs implemented in fact it does not negates the poor, but at least they try to reduce the amount. Indonesia so far has various poverty programs aimed at different groups based on the primary target, ranging from household (cluster one), a community or group of communities (clusters two), and small and medium enterprises (cluster three). This study aims to look at the effectiveness of the implementation of the government's poverty programs mainly intended for households. Specific target to be achieved is nothing but a refinement of the targeting mechanisms and beneficiaries of the program. The results are expected to contribute to the policy assessments of poverty alleviation program and their perfecting in the future. Analyzes used data of Indonesia Family Life Survey (IFLS) in 2007 and 2014. In accordance with its objectives, there are three policies that would be seen its impact on household welfare indicators, namely the health policy (ASKESKIN), consumption policy (BLT) and education policy (BSM). The test results show if the three policies programs targeting households poverty alleviation do not have the same effect on the changes in household income. Direct cash assistance (consumption policy/BLT) was most effective compared to other programs. Therefore it can be concluded if these three programs have different effects at different time periods, so it must be applied in accordance with the needs.
Keywords: poverty household-based programs, direct cash transfer, government programs in education and health
JEL Classification: D04, D31, H52, H51
1. INTRODUCTION
Poverty is a multidimensional and complex problem, thus definition of poverty may vary in accordance to evolution of knowledge and social sciences themselves. Poverty can be defined as one’s or family’s condition in which they were incapable of meeting their most basic needs due to state of deprivation (Kartika, 2013). Government basically remains active in its efforts to mitigate poverty through various program and policies presumed to be effective in diminishing the number of population living in poverty. Poverty nevertheless is very unlikely to be fully eradicated due to its multidimensional definitions.
Concepts of poverty are diverse. Some opinions pertinent to poverty range from an inability to meet basic consumption needs and improve well-being, lacking of productive opportunities, to broader definition which includes social and moral aspects as well. Other opinion asserts that poverty relates to attitude, life style and environment in a society. Some also state that poverty is a powerlessness of some group of people against government-imposed system, thus rendering them in a very weak and exploited position (structural poverty).
A
C
C
E
P
T
E
D
M
A
N
U
S
C
R
IP
T
Still though, poverty is generally being implied as material poverty. In this sense, someone would enter poverty when they were unable to meet minimum basic need standards to live a decent life. This is frequently dubbed as consumption poverty.The robustness of Indonesian economic growth has generally been able to diminish poor population in Indonesia during the last seven years. However if we look at the facts, according to data from Central Statistics Bureau, in March 2016, the number of poor population (those with monthly per capita expenditure below poverty line) in Indonesia remained at 28.01 million people (10.86 percent).
Even though absolutely and relatively, the number of poor population in Indonesia in March 2016 seems to decline 0.50 million people compared to September 2015,this decline in numbers and percentages of poor population is relatively sluggish. The deceleration of poverty rate decline can be explained at least in two different ways. First, when poverty rate is relatively lower, poverty would naturally decline slower than when poverty rate is relatively high such as in the 30 to 40 percent range. Second, poverty at a relatively low rate is speculated to have reached chronic poverty which requires more complex treatment and longer time span.
Table 1.Poverty Statistics in Indonesia
2010 2011 2012 2013 2014 2015 2016 2017* Absolute Poverty (in
millions) 31 30 29 29 28 29 28 26
Relative Poverty
(% of population) 13.3 12.5 11.7 11.5 11.0 11.1 10.7 10.1 Source: Central Statistics Bureau, 2018
Note: * September 2017 data
When examined from root indicators, food commodity still contributes predominantly to poverty line in Indonesia compared to contributions from non-food commodities (housing, clothing, education, and health). Contribution of Food Poverty towards Poverty Line in March 2016 was recorded at 73.50 percent, this condition was quite similar to condition in September 2015 which stood at 73.01 percent (https://www.bps.go.id). Type of food commodities with highest contribution to poverty line in both urban and rural areas consisted of rice, filteredclove-cigarettes, chicken egg, sugar, instant noodle, onion and bread. While non-food commodities with greatest contributions were housing cost, electricity, gasoline, education and toiletries. Policy improvements on poverty mitigation has been conducted for several recent years including development in Integrated Data as an improvement effort aimed at household and individual-based programs. All of those improvements were implemented by adhering to what was needed. In order to implement poverty mitigation acceleration strategy, a targeted poverty mitigation program was executed (targeted program). Integrated Data for the Poor Handling Program (Integrated Data PPFM) is an electronic data system containing social, economic, and demographic information from about 40% of households with the lowest welfare status in Indonesia. This Database is managed by the Integrated Data Management Team of the Poor Handling Program. Integrated Data PPFM is the result of Integrated Database Update (PBDT) conducted in 2015 by the Central Bureau of Statistics (BPS). Integrated Data PPFM is used to improve the quality of targeting social protection programs. Integrated Data PPFM helps program planning, improves budget use and social protection program resources. Using data from PPFM Integrated Data, the number and targets of program beneficiaries can be analyzed from the beginning of program planning. This will help reduce errors in setting social protection program targets (http://www.tnp2k.go.id)
Poverty mitigation programs have been implemented by directly targeting those categorized as poor or near-poor (Sutikno, et al., 2010). Poverty mitigation programs directed to the needyare expected to be far more effective in poverty mitigation effort. First group is poverty mitigation programs targeted to households/families (Cluster I). These programs includes: conditional cash
A
C
C
E
P
T
E
D
M
A
N
U
S
C
R
IP
T
transfer/Program Keluarga Harapan, (PKH), unconditional direct cash transfer/Bantuan Langsung Tunai (BLT), direct assistance in form of in-kindassistance, such as rice distribution to the poor (raskin), and appealing to vulnerable population groups such as the disabled, senior citizen, orphans, etc. Second group is poverty mitigation programs targeted to community (Cluster II). Community-targeted poverty mitigation programs in its implementation adheres to community empowerment principle (Community Driven Development). National Program on Community Empowerment/Program Nasional Pemberdayaan Masyarakat (PNPM-Mandiri) is an example of such program. Third group is poverty mitigation programs targeted to micro and small enterprises (Cluster III). Objective of such programs is to provide economic access and reinforcement for micro and small-scale business owners. Fourth group is poverty mitigation programs aimed at improving access to basic service availability and improving living quality of the poor. Programs included in this group are other poverty programs which are directly or indirectly capable to boost economic activities and welfare of the poor.
Numerous poverty mitigation programs have been launched by government. Evaluation and monitoring results have also provided points of improvements for future policies. Empirical studies related to those policy evaluations tend to be partial through observing individual success of each of those policies. On the other hand, poverty mitigation programs, especially at household level, aims for different targets. Program Keluarga Harapan (PKH) targets household to boost child education status, while rice for the poor/raskin and Direct Cash Transfer/BLT targets household consumption security. Comprehensive studies so far have yet to determine which of those programs is most effective in achieving target. Moreover, the government is beginning to consider to implement inclusive finance as a way deemed effective in mitigation poverty.
This research has an important and urgent point to be performed, since by comparing effectiveness of various poverty mitigation programs at household level we can identify which program is most effective in achieving target. In addition, through field case study we can observe and evaluate program distribution’s accuracy to predetermined targets for database and distribution method improvements.
Central statistical bureau defines poverty as inability to meet minimum standard of basic needs which includes food and non-food needs. These minimum standardsare manifested in form of a poverty line. In economic context, poverty occurs when income of a household no longer stands above certain limits. These limits may differ for each country, or even for each city/area. International standard refers to extreme poverty at income attainmentof less than $1 per day (UNESCO, 2016).
Poverty is frequently associated with families (instead of individuals) and adjusted by the number of family members. Absolute poverty measures poverty associated with the sum of money needed to meet basic needs such as food, clothing, and housing. The concept of absolute poverty is unrelated to the limits of quality of life or inequality level in the society. Thus, this approach cannot accommodate individuals’ positions with prominent roles in a social community and culture. However, the concept of absolute poverty has been criticised on the grounds that it minimises the range and depth of human needs. Human needs are interpreted as predominantly physical needs rather than social needs. People are relatively deprived if they cannot take part in the ordinary way of life of the community and cannot play their roles by virtue of their membership of the society. Furthermore, there have been difficulties in substantiating the absolute poverty approaches in robust empirical terms (Anwar, 2005). This led analysts to a social formulation of the meaning of poverty—relative deprivation which some have defined as having income less than half or two-third or three-fourth of average expenditure (or income) norm. Definition of relative poverty is consequently associated with economic status of other community members. People can be qualified as poor when they fall below living standards of community groups where they belong.
A
C
C
E
P
T
E
D
M
A
N
U
S
C
R
IP
T
Most countries use one or several ‘official’ financial poverty indicators on which progress is regularly monitored and which serve as a basis for policy interventions. Such as The United States (US) that uses an absolute poverty indicator that is based on a minimum cost of living threshold which is compared to a families’ gross income. Meanwhile, the financial poverty indicator that is used by the European Union (EU) member states is based on a relative concept of poverty; the poverty threshold is set at 60 percent of national median income and compared to household’s disposable income (Notten & Neubourg, 2011)
Criticisms on both concepts showed that all of them focus merely on income and consumption. Some experts opined that poverty could also incorporate lack of access to services such as education, health, information, and lack of people’s access to participation in development and politics (BPS, National Poverty Profile and Analysis 2013, 2013). Poverty data published by BPS consists of macro and micro data. Macro data on poverty is data that shows only aggregate number and percentage of poor population. This data is generated from National Social and Economic Survey/Survei Sosial dan Ekonomi Nasional (Susenas). While micro data on poverty is provided based on access to basic needs criteria. Micro data is generated from Data Collection of Social Protection Program/Pendataan Program Perlindungan Sosial (PPLS).
Poverty rates maintained so far by the government are macro poverty rates calculated from SUSENAS. Macro poverty rates are employed to provide picture of macro condition and for macro planning purposes. Beside macro poverty rates, Central Statistical Bureau (BPS) also conduct census on data collection of target household through PPLS which resulted in micro poverty rates. These rates are employed in micro program/activity planning, especially in targeted programs/activities.
Poverty rate can be measured through several approaches (BPS, National Poverty Profileand Analysis 2013, 2013):1) Economic Approach. Poverty from economic perspective is measured through income approach. Poverty is viewed as inability in economic sense to meet basic food and non-food needs measured in expenditure term. Thus poor population is population with monthly average per capita expenditure below poverty line; 2) Purchasing Power Parity Approach (PPP). World Bank defined international poverty lines as US$ 1 and US$ 2 perday in 1993 which were measured through purchasing power parity approach (PPP). Purchasing power parity is defined as a method implemented to measure how much similar goods or services a currency is capable of procuring in international measurement since goods and service prices differ among various countries. PPP is measured by adjusting goods and service price differences among countries. Poverty measurement based on US$ 1, is generally adopted for third-world countries such as in Africa. While poverty measurement based on US$2 is adopted for countries within the middle income category, such as East Asia and LatinAmerica. These conversion numbersare calculated based on price and quantity in each country collected in a survey commonly conducted every five years; 3)Multidimensional Poverty Index (MPI). Definition of poverty continues to develop and not limited to measurement in monetary terms. United Nation Development Program (UNDP) developed a definition of poverty from various aspects by creating a multidimensional poverty index. Multidimensional poverty index identifies one’s inability to meet his/her basic needs based on three dimensions consisting of health, education, and living standards. These dimensions are derived further into ten indicators consisting of nutrition, child mortality, length of school, school participation rate, cooking fuel, toilet type, water, electricity, floor type, and assets ownership. The calculation of multidimensional poverty index can be computed from micro data derived from household survey. MPI methodology can be modified to produce a national multidimensional poverty measure which reflects culture, economy, climate, and other local factors. International MPI is designed as an analytical tool to compare acute poverty among countries.
Decline in poverty rate in Indonesia during 1976-1996 period is one of the most impressive development episodes and became one of success stories in poverty mitigation for Indonesia and for many other countries as well. During this period poverty rate in Indonesia fell from 40 percent
A
C
C
E
P
T
E
D
M
A
N
U
S
C
R
IP
T
range to 11.7 percent. This trend broke when Indonesia was overwhelmed by Asian financial crises in 1997-1998. Starting from 2000, trend in poverty rate decline resumed again albeit with slower pace compared to pre 1997-1998 crises periods. This deceleration in poverty rate lasted until the beginning of 2009 (http://www.tnp2k.go.id).
Poverty program in Indonesia is divided into four clusters. Cluster one is family-based integrated assistance program (household). Group of assistance-based poverty mitigation programs is aimed to promote basic rights fulfillment, living cost relieve, and living quality improvement for the poor. Focus on basic rights fulfillment is intended to improve living quality of the poor for a better life, such as fulfillment of rights on food, health care, and education. Programs in assistance and social security-based poverty mitigation group are characterized by fulfillment of main individual and poor household basic rights which includes education, health care, food, sanitation, and clean water. Other characteristics of these programs are direct activity implementations and the benefits of which being enjoyed directly by the poor. Scope of programs in assistance and social security-based poverty mitigation group are centered on the fulfillment of main basic needs. These main basic needs prioritize on fulfillment of rights on food, education, health care, sanitation and clean water. Beneficiaries from assistance and social security-based are directed to extremely poor community groups. This is not just caused by the vulnerable condition of the extremely poor, but also due to their inability to accomplish and fulfill basic rights adequately and self-reliantly. Types of program in this cluster include Jamkesmas, Program Keluarga Harapan (PKH), Raskinand Assistance for Poor Students/Bantuan Siswa Miskin (BSM). Cluster two is integrated poverty mitigation programs based on community empowerment. Poverty mitigation is not limited only to distributing direct assistance to the poor since poverty is not just caused merely by materialistic aspects, but also due to vulnerability and minimal access to improve living quality of the poor. Empowerment approach is intended to relieve the poor from poverty by using their own potential and resources. Community empowerment-based poverty mitigation program group is an advanced stage in poverty mitigation process. During this stage poor population begin to realize their capabilities and potentials to exit from poverty. Empowerment approach as instrument of this program is intended not only to incite awareness of the poor of their own potentials and resources, but also to compel the poor to participate in broader scale especially in regional development processes.
Characteristics of programs in community empowerment-based poverty mitigation group are:1) Implementing participative approach. Participative approach is not limited to community’s participation in implementing the program, but also community’s involvement in every stage of program implementation, consisting of needs identification process, planning, execution, and monitoring of program’s execution, even up to the maintenance stage of the program; 2) Reinforcement of community’sinstitutional capacity. Community empowerment-based poverty mitigation program group emphasizes on reinforcement of community’s institutional aspects, so that community is capable of independently promoting development it aspires to. Reinforcement of organizational capacity is not just limited to community organizing stage to achieve its basic rights, but also reinforcing the social community’s institutional functions as a means of poverty mitigation; 3) Activity execution by community in a collective and self-manage fashion. Community empowerment-based poverty mitigation program group must foster confidence of the poor in order to expose opportunities for community to self-manage and associate, by improving their own potentials to induce independent potential development; 4)Sustainable development planning. Program planning is carried out openly with from, by, for the people-principle and its outcomes become part of development planning in village, district, regency, province, and national levels. This process requires a clear coordination in policy implementation and program execution control among stake holders in implementing those poverty mitigation programs.
Scope of programs in community empowerment-based poverty mitigation program group can be classified based on:1) Area. Community empowerment-based poverty mitigation programs are
A
C
C
E
P
T
E
D
M
A
N
U
S
C
R
IP
T
conducted in rural, urban, and under-developed areas; 2) Sector. Community empowerment-based poverty mitigation program group focuses on capacity reinforcement of the poor by developing various program schemes based on particular sector needed by the community in certain area.Recipients of community empowerment-based program groupare community groups categorized as poor. Those impoverished community groups are the ones that still possess the ability to utilize their potentials despite limitations persist. Included in this cluster is PNPM Mandiri.
Cluster three is integrated program based on micro and small enterprises. Micro and small enterprise empowerment-based poverty mitigation program aims at providing economic access and reinforcement for micro and small business owner. Important aspect in reinforcement is providing broad access to the poor to strive and improve their quality of life. Program characteristics in micro and small enterprise empowerment-based poverty mitigation group are: 1) Providing capital assistance or micro-scale financing. This program group is a development from community empowerment-based program group that is more self-reliant in a sense that the government facilitates micro and small business owners to obtain additional capital from financial institutions/banks while being guaranteed by the government; 2) Strengthen business self-reliance and access to market. Providing broad access to do business and perform market penetration and expansion, both at domestic or international levels onproducts of micro and small enterprises. Access in this context refers to not only the availability of business support and channel, but also to business facilitation; 3) Improving business skills and management. Providing training and mentoring in improving business skills and management to micro and small business owners.
Scope of micro and small enterprise-based program group can be divided into three, which are: (i) financing or capital assistance; (ii) opening access to capital and product marketing;and (iii) mentoring and improvement of business skills and management.Beneficiariesof this micro and small enterprise empowerment-based program group are near-poor community groups that do businesses at micro and small scales.Beneficiariesof this program group are also aimed at impoverished population that has yet to own a business or being involved in economic activities. Type of program in cluster three includes People’s Business Credit/ Kredit Usaha Rakyat (KUR). Several researches related to poverty have been performed frequently. Kwon and Kim analyzed the evolution of cash transfer in Indonesia during several economic periodsin transfer policy context and national adaptation (Kwon & Kim, 2015). First period was during Asian economic crises. During this period the government began to implement various social programs aimed to the poor through social safety net. In its implementation, this program was considered ineffective and inefficient. Later it was realized that institutional structure was needed to provide an effective social mentoring. Second period began after Indonesia went through oil crisis in 2005. During this period institutional structure has been established, albeit the state has yet been able to develop a comprehensive social security system. Indonesia’s experience in transfer policy and adaptation has showed that cash transfer mainly aimed to protect the poor has evolved. This program became an important political commodity in congruence with institutional structure improvement, nevertheless cash transfer has shown significant developments at micro level due to its contribution to social security system.
Another research by Rasyid (2013) showed the indication of crowding-out effect between public and private transfers in Indonesia. Cash transfer is designed to support the poor from economic crisis which in turn will produce undesired effect if form of decline in transfer among households as an informal social safety net.The role of transfer among households has long been a part of life and social community in Indonesia. The existence of crowding out effect impacts the effectiveness of government transfer due to the decline in private transfer (Rasyid, 2013).
Fachrudin (2015) on his research results found that realization of poverty mitigation policy implementation in Balikpapan city was far from successful. This was caused by some deficiencies and constraints in its execution, such as: (i) in educational assistanceprogram, has been irrelevant
A
C
C
E
P
T
E
D
M
A
N
U
S
C
R
IP
T
due to the sum of aid to assist fulfillment of the poor’s education needs; (ii) constraints on the usage of health care assistance by the poor due to lack of procedural knowledge in health care assistance in general and current health insurance (BPJS); (iii) lacking of maximal skill training program for the poordue to lack of interest to participate in skill training in respective fields provided by the government; and (iv) the failure of capital assistance program with rolling fund scheme.
In term of regional level, Arham and Naue (2015)found that public expenditures on education and health had negative and significant effects toward the poverty level in all regencies/city in Gorontalo while the public expenditure on infrastructure did not have any effect toward the level of poverty in all regencies/city in Gorontalo. In this case, poverty measured by the percentage of poor in regencies/cities, meanwhile education measured by budget spending on education per capita and health program measured by budget spending on health per capita.
2. RESEARCH METHOD
This study aimed to determine effectiveness of government policy programs in poverty mitigation, especially at household level in Indonesia.Sources of data employed in this research are longitudinal data from Indonesian Family Life Survey (IFLS) for 2007 and 2014 periods. In order to achieve research objective, the impact of three policies, consisted of health policy (Asuransi Kesehatan untuk Masyarakat Miskin/ASKESKIN), consumption policy (BLT2) and education policy (BSM), on household welfare indicator would be estimated. Askeskin represented all health policies including Jamkesmas and other similar programs. Askeskin is the Health Insurance for the Poor, a subsidized social health insurance for the poor and the informal sector that introduced in 2005. However, since 2008 ASKESKIN changed to JAMKESMAS. In 2005, ASKESKIN / JAMKESMAS management became one in PT Askes, which changed its name to BPJS-Kesehatan since 2013. Due to our data started from 2007 - 2014, where health insurance has changes their name or term various times, this variable is inserted into ASKESKIN because it has the same target.
BLT2 represented BLT and BLSM (Community Temporary Direct Assistance/Bantuan Langsung Sementara Masyarakat) programs, and similar programs. While BSM represented Poor Student Assistance/Bantuan Siswa Miskin (BSM) program and other similar programs. Output indicator employed was logarithmic changes of income (dlnincome).
In order to produce more actual estimation of poverty mitigation policy programs’ impact on income change variable, some variables describing household characteristics must be controlled. Social variables at household level employed to control the impact of poverty mitigation policy programs were: last education of household head is SD (primary); last education of household head is SMP (secondary); last education of household head is SMU (tertiary); last education of household head is University (university); age of household head (agehead); number of adult household member (numadult); availability of terminal in the village (terminal); availability of rural telecommunication kiosk (wartel); and availability of rural post office (pos). Methodology employed in this study was panel data regression analysis. Analysis was started with presenting basic results using ordinary least square, with policy impact estimation as follows:
𝑖𝑛𝑐𝑜𝑚𝑒𝑖𝑡 = 𝛼 + 𝛽1𝑡𝑟𝑒𝑎𝑡𝑚𝑒𝑛𝑡𝑖𝑡+ 𝛽𝑘𝑋𝑖𝑡𝑘+ 𝜀𝑖𝑡 1) Wherey it represents household income as outcome variable and treatment it represents poverty programs received by each household. Households received three types of different programs, consisted of ASKESKIN (for health), BLT (for consumption), and BSM (for education).ASKESKIN represents all health policies including JAMKESNAS and other similar programs. BLT represents BLT and BLSM (Community Temporary Direct Assistance/Bantuan Langsung Sementara Masyarakat) programs,which only appeared in the latter IFLS,and other
A
C
C
E
P
T
E
D
M
A
N
U
S
C
R
IP
T
programs. Meanwhile BSM represents Poor Student Assistance/Bantuan Siswa Miskin (BSM) program and other similar programs.𝑋𝑖𝑡𝑘 represents group of variables of household and community characteristics as control variables. 𝜀𝑖𝑐𝑡is idiosyncratic error which is assumed uncorrelated with other explanatory variables (strict exogeneity assumption). 𝛽1value is an estimated measure of household income differences between those who received poverty programsand those who did not.
Subsequently, equation model (1) was indicated to still contain biases since all three policies were not distributed randomly to receiving households.Possible source of bias which occur in estimating a program’s impact might be resulted from unobserved heterogenity, which is unobserved group characteristics. Bias can also occur due to endogeneityproblem as consequences of household decision whether to participate in a program or not (self selection bias). To anticipate this problem, a second analysis method was employed usingfixed effect area, with policy impact estimation as follows:
𝑖𝑛𝑐𝑜𝑚𝑒𝑐𝑖𝑡 = 𝛼 + 𝛽1𝑡𝑟𝑒𝑎𝑡𝑚𝑒𝑛𝑡𝑐𝑖𝑡+ 𝛽𝑘𝑋𝑐𝑖𝑡𝑘 + 𝛿𝑐+ 𝜀𝑖𝑡 2) 𝛿𝑐 represents fixed effect area which captured unobserved community characteristics correlated with treatment received by household and its income.
3. RESULT DISCUSSION
Budget programs such as BLT, BSM, RASKIN and ASKESKIN are all funded from the state budget (APBN). Compared to other social protection programs, RASKIN (which included in BLT in this research) has a relatively larger share of the budget (TNP2K, 2015). Several studies have shown that BLT, ASKESKIN and BSM are effective for improving the welfare of the poor. However, the results of field studies conducted by SMERU (2013) programs such as BSM are said to be better than BLT or related program because the BSM program has more clear targets. The results of other SMERU studies (2008) also indicates if the RASKIN policy effect was not as effective as expected. The low effectiveness of the program is characterized by a lack of program socialization and transparency; inappropriate recipients' targets, price, quantity, and frequency of rice receipts; the high cost of program management; not yet optimal implementation of monitoring and evaluation; and poorly functioning complaints mechanism.
This study is intended to see three types of programs effectiveness using same indicators. The use of same indicator is intended to obtain more objective results, so as we can capture a picture of those three effectiveness and comparable. Estimation results by employing IFLS4 and IFLS5 data are as follows.
Table 2. Analysis Results using OLS Model
(1) (2) (3)
VARIABLES dlnincome dlnincome dlnincome
ASKESKIN 0.176** (0.0689) BLT 0.298*** (0.0756) BSM 0.132 (0.0940)
A
C
C
E
P
T
E
D
M
A
N
U
S
C
R
IP
T
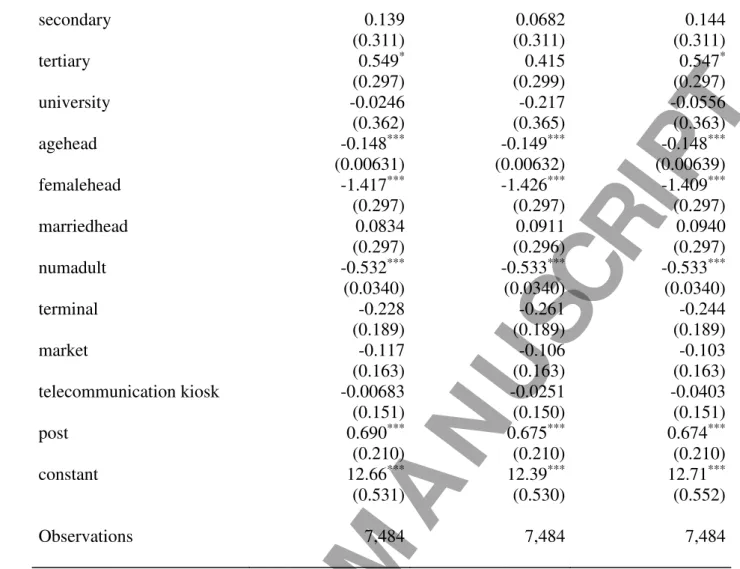
secondary 0.139 0.0682 0.144 (0.311) (0.311) (0.311) tertiary 0.549* 0.415 0.547* (0.297) (0.299) (0.297) university -0.0246 -0.217 -0.0556 (0.362) (0.365) (0.363) agehead -0.148*** -0.149*** -0.148*** (0.00631) (0.00632) (0.00639) femalehead -1.417*** -1.426*** -1.409*** (0.297) (0.297) (0.297) marriedhead 0.0834 0.0911 0.0940 (0.297) (0.296) (0.297) numadult -0.532*** -0.533*** -0.533*** (0.0340) (0.0340) (0.0340) terminal -0.228 -0.261 -0.244 (0.189) (0.189) (0.189) market -0.117 -0.106 -0.103 (0.163) (0.163) (0.163) telecommunication kiosk -0.00683 -0.0251 -0.0403 (0.151) (0.150) (0.151) post 0.690*** 0.675*** 0.674*** (0.210) (0.210) (0.210) constant 12.66*** 12.39*** 12.71*** (0.531) (0.530) (0.552) Observations 7,484 7,484 7,484
Robust standard errors in parentheses, *** p<0.01, ** p<0.05, * p<0.1
Regression results showed that only ASKESKIN and BLT posed significant impacts on household income, while BSM’swas insignificant. Basically the three programs was intended to provide differing outputs, or biased and thus did not pose any direct impacts on household income. BLT program is a national program intended to assistPoor Householdin fulfilling food needs. On the other hand health care for the poor, policies implemented areHealth Insurance for the Poor/Asuransi Kesehatan Masyarakat Miskin (Askeskin) in 2005 and Jamkesmas in 2008. Askeskin policy (and Jamkesmas) are policies to improve health access for the poor through insurance scheme where the government covers insurance premium. Meanwhile Poor Student Assistance/Bantuan Siswa Miskin (BSM) program was set against backdrop of low educational participation rate especially in impoverished groups due to high direct and indirect educational costs.
While BLT and ASKESKIN can be enjoyed by all poor households, the same cannot be stated with BSM. BSM can only be enjoyed by households with school-age children. The significant effects of ASKESKIN and BLT programs on household income can be inferred that these programs’ distribution had direct impacts on household income, while BSM possibly impactedincome indirectly.This is possibly due to the length of time needed for programs and investments in education to show their effectiveness.Due to indication of bias from unobserved heterogeneity, analysis must also be conducted using fixed effect method. Results of which are as shown in Table 3
Table 3 Analysis Results using Fixed Effect Model
A
C
C
E
P
T
E
D
M
A
N
U
S
C
R
IP
T
(1) (2) (3)
VARIABLES dlnincome dlnincome dlnincome
ASKESKIN 0.152** (0.0715) BLT 0.242*** (0.0796) BSM 0.106 (0.0978) primary -0.302 -0.320 -0.294 (0.251) (0.252) (0.251) secondary 0.111 0.0660 0.135 (0.348) (0.349) (0.350) tertiary 0.504 0.420 0.531 (0.324) (0.323) (0.325) university 0.101 -0.0298 0.106 (0.418) (0.413) (0.416) agehead -0.138*** -0.139*** -0.139*** (0.00654) (0.00653) (0.00659) femalehead -1.346*** -1.346*** -1.335*** (0.332) (0.332) (0.333) marriedhead 0.137 0.143 0.144 (0.323) (0.322) (0.322) numadult -0.583*** -0.582*** -0.584*** (0.0364) (0.0364) (0.0365) terminal 0.298 0.306 0.329 (1.265) (1.255) (1.261) market -1.867 -1.904 -1.897 (1.191) (1.185) (1.192) telecommunication kiosk -0.0747 -0.0911 -0.0805 (2.344) (2.328) (2.334) post 2.497* 2.507** 2.474* (1.281) (1.269) (1.276) constant 12.75*** 12.53*** 12.78*** (1.892) (1.881) (1.868) observations 7,484 7,484 7,484 Number of EA 317 317 317
Robust standard errors in parentheses, *** p<0.01, ** p<0.05, * p<0.1
Analysis using fixed effect method produced robust results. ASKESKIN and BLT posed significant effect, while BSM did not. This indicates that in order to provide direct effect to income, government ought to choose programs in the fields of consumption security (such as BLT) and health (such as ASKESKIN and JAMKESMAS) as appropriate alternative choices. While social security programsthrough improvement of access to education may have indirect effect, nevertheless they provide positive effects to household income improvement in Indonesia.
4. CONCLUSION
A
C
C
E
P
T
E
D
M
A
N
U
S
C
R
IP
T
Poverty as the root of significant inequality in health status has and always been a principal agenda in government policy to combat poverty using various approaches either economic, social or political. Calculation of poverty rate based on income do not reflect actual condition since there are some population that do not qualify as poor according to income measures but become poor due to lack of access to public services and the severity of human indicators. This triggers the government to launch various social security programs as an attempt to reduce the number of poor population. Poverty mitigation effort in Indonesia has never ceased as various policy instruments being deployed. Analysis results by using Indonesian household in particular have showed that poverty programs based on household consumption and health security would positively impact household income. As contrast, programs aimed to secure education access have been shown as not having any significant effect. However, it needs to be taken into consideration the weakness of this measurement which employed of one outcome variable (in this case household income) as sole indicator. This is considering all three forms of program have different objectives and targets and thus their direct effects might not be detected during analysis.
ACKNOWLEDGEMENT
Acknowledgments of researchers for funding provided by Lembaga Penelitian dan Pengabdian kepada Masyarakat (LPPM), Udayana University. Researchers would also like to thank to the Center for Sustainable Development Policy Studies (CSDPS) as well as the Faculty of Economics and Business of Udayana University so this research can be completed well.
REFERENCES
Anwar, T. (2005). Prevalence of Relative Poverty in Pakistan . The Pakistan Development Review, Vol. 44(4), 1111 – 1131.
Arham, M. A., & Naue, T. F. (October 2015). Public Expenditures and Poverty: Evaluation of Government's Priority Programs in Gorontalo Province. Economic Journal of Emerging Market, 107-119.
BPS. (2013). Profil dan Analisis Kemiskinan Nasional 2013. Jakarta: BPS.
BPS. (2014). Indikator Makro Ekonomi Kota Denpasar Tahun 2014. Kota Denpasar: BPS. Kartika, I. N. (2013). Strategi Pengentasan Kemiskinan terhadap Penurunan Rumah Tangga
Miskin di Kota Denpasar. Buletin Studi Ekonomi, 26-33.
Tim Nasional Percepatan Penanggulangan Kemiskinan. (2015). Tantangan Meningkatkan Efektifitas Program Raskin. Jakarta : Sekretariat Wakil Presiden Republik Indonesia. Kwon, H.-j. K., & Kim, W.-r. (2015). The Evolution of Cash Transfers in Indonesia: Policy
Transfer and National Adaptation. Asia and the Pacific Policy Studies, 425-440.
Notten, G., & Neubourg, C. d. (2011). Monitoring Absolute and Relative Poverty; ‘Not Enough’ is not the Same as ‘Much . The Review of Income and Wealth, Vol. 57(2), 247-269. Rasyid, M. (2013). Crowding-out Effect of Cash Transfer Programs on Inter-household Transfers:
Evidence from Indonesian Family. Journal of Economics and Sustainable Development, 47-53.
A
C
C
E
P
T
E
D
M
A
N
U
S
C
R
IP
T
SMERU, L. P. (2008). Efektivitas Pelaksanaan Raskin. Jakarta: Lembaga Penelitian SMERU. SMERU, L. P. (2013). Kajian Pelaksanaan Program Bantuan Langsung Tunai (BLT) 2008 dan
Evaluasi Penerima Program BLT 2005 di Indonesia. Jakarta: Lembaga Penelitian SMERU.
Sutikno, Sudjono, E. S., Rumiati, A. T., & Trisunarno, L. (2010). Pemilihan Program Pengentasan Kemiskinan Melalui Pengembangan Model Pemberdayaan Masyarakat dengan Pendekatan Sistem. Jurnal Ekonomi Pembangunan, Vol. 11(1), 135 - 147.