An Optimized Model for the Objective Assessment of
Roughness Sensations in Vehicle Noise
R. Hoeldrich
IEM - Institute of Electronic Music
Graz, Austria
AVL - Sound Engineering Conference
22/23 July 1999 in Graz
An Optimized Model for the Objective Assessment of Roughness
Sensations in Vehicle Noise
Robert Hoeldrich
Institute of Electronic Music, Jakoministr. 3-5, A-8010 Graz/AUSTRIA
ABSTRACT
In the assessment of vehicle noise quality, sound characteristics caused by modulation play an important role. The proposed model for the sensation of psychoacoustical roughness was developed as part of a research program with the aim of establishing an onboard analysis system for vehicle interior noise quality based on objective sound parameters.
The roughness model can be adjusted by model parameters to calculate an optimized version of roughness, thereby accentuating different psychoacoustical assumptions. The model is based on the excitation-time pattern of the interior car sound which is recorded using an artificial head system. From the excitation-time pattern, a set of specific roughness parameters in overlapping critcal bands is obtained utilizing different weighting functions for the envelope spectrum in each band and various correlation methods between adjacent bands. The specific roughness parameters in critical bands are superimposed in several ways resulting in a set of modulation parameters. The model was successfully tested not only in predicting roughness assessment, but it also proved to result in a valid objective parameter for the description of vehicle interior noise quality [1].
INTRODUCTION
In the procedure of improving vehicle interior noise quality, most car manufacturers evaluate their vehicles by cost intensive subjective assessments of experts. In order to reduce this time-consuming method of subjective assessment, a measurement system was developed for noise quality evaluation [2] based on objective sound parameters such as the psychoacoustical entities: loudness, sharpness, tonality, impulsiveness and roughness. The new tool establishes a noise quality map for passenger cars covering all operating conditions. Results of regression analysis show that in most of the cases, the subjectively perceived noise quality can be described by objective parameters with very high accuracy [2].
For some vehicles and operating conditions however, the expected high correlation coefficients could not be reached in our multiple regression analysis due to the fact that the available objective parameters were not appropriate. This is especially true for sensations caused by modulation such as roughness, fluctuation strength and rumble. All analytical desciptions of psychoacoustical roughness available from literature or instrumentation suppliers are based on algorithms which only partly correlate with subjectively perceived roughness. We have observed in numerous tests, concentrating on powertrain related vehicle interior roughness, that perceived roughness could be assessed by available methods only in the case of loudness differences. It seems that loudness correlates quite well with calculated roughness, which is a well known fact from psychoacoustical literature [3,4]. For noises with equal loudness however, the correlation between perceived and calculated roughness vanishes.
In this paper we present a generalized psychoacoustical model of modulation parameters which is based on existing approaches in [5,6,7], but can be particularly adjusted to assess the roughness
perception of vehicle interior noise. The optimized model was successfully tested in predicting roughness assessment as reported in [8].
The model was developed as part of a research program in collaboration with AVL LIST GmbH and Joanneum Research.
STRUCTURE OF THE ROUGHNESS MODEL
Our roughness model is based on the excitation-time pattern of the interior car sound which is recorded using an artificial head system. The excitation-time pattern takes into account the properties of the perpherial auditory system, such as the outer-middle ear filtering, the nonlinear masking properties and absolute threshold. From the excitation-time pattern, a set of specific roughness parameters in overlapping critcal bands is obtained utilizing the effective modulation index in each band. The modulation index is determined by various weighting functions for the envelope spectrum. The specific roughness parameters in critical bands are superimposed in several ways by taking into account the envelope correlation between adjacent bands. This results in a set of modulation parameters for every 100 ms.
THE EXCITATION-TIME PATTERN
The excitation pattern is extracted from a 170ms signal frame for every 100ms. The FFT spectrum of the frame is multiplied by a transmission factor which represents the filtering due to the outer and middle ear. For frequencies above 1kHz, the filter mimicks the inverse absolute threshold. For frequencies below 1kHz, the appropriate filter contour is a matter of discussion. Some authors argue in favor of a flat filter [9] (solid line in fig.1), while newer proposals use the inverse 100 phon curve [9] (broken line in fig.2). Our model offers both possibilities. To calculate the excitation pattern for each frequency component, the spectrum is transformed to the
critical band rate scale z in Bark [11]. The excitation LE(z) within a single frame is obtained
using the pattern slopes:
Bark dB Sl =−27
for the lower slope and
Bark dB dB L f kHz Su + − − = 24 0.23 0.2
for the upper level dependent slope (f and L depicting component frequency and level). The excitation pattern is analysed in a filterbank containing 47 overlapping bandpass filters with bandwidths of 1 Bark. Excitations below the absolute threshold at a filter position do not contribute to the filter output. The calculation scheme of the excitation pattern is depicted in fig.1.
In the model proposed in [5,6,7] the level L of each single spectral component (FFT bin) is used to determine the
inclination of the appropriate upper slope Su and therefore the
spread of excitation over frequency. This method does not take into account the property of the auditory system to integrate spectral energy over a critical band. It is known from psychoacoustical research that narrow band noise causes the same pattern of excitation as a sinusoidal tone of equal level [9]. The difference is explained by the following example. Assume an amplitude-modulated 450 Hz tone with a modulation frequency of 30 Hz and a modulation index m=1. The level of the carrier is 70 dB. The resulting spectrum contains a 64 dB-component at 420 Hz (z=4.2 Bark) , a 70 dB-dB-component at 450 Hz (z=4.5 Bark) and another 64 dB-component at 480 Hz (z=4.8 Bark). Considering each spectral component separately,
the pattern slopes Su are -11.7, -10.5, and -11.7 dB/Bark
respectively resulting in a excitation at the bandpass filter
centered at zi=8 Bark of 19.4, 33.3 and 26.6 dB (fig.2).
If we utilize the summation level of the 3 components (71.8 dB) for calculating the slope after Eq.2, we obtain approximately
Su= -10.1 dB/Bark for every component. The resulting
excitation at zi=8 is 25.3, 34.5, and 31.6 dB (fig.3)
In order to compare the 2 approaches, we included both excitation patterns in our generalized model.
Figure 1: Calculation scheme of the excitation pattern
Figure 2: Excitation pattern for AM, slopes are calculated for each component separately
Figure 3: Excitation pattern for AM, slopes are calculated from the summation level.
CALCULATION OF THE MODULATION INDEX
The sensation of roughness depends strongly on the modulation frequency. To account for this fact, the envelope spectrum in each critical band has to be weighted by using appropriate filters.
The effective modulation index mi for zi is obtained by dividing the RMS-value of the weighted
envelope by the envelope´s DC-value before weighting eDC(zi).
The crucial point is the choice of the weighting filters. As we found in listening tests, applying the popular filter functions proposed in [5] does not lead to the perceived roughness values. These bandpass filter shapes depend on the carrier frequency as can be seen in figure 4.
Figure 4: Bandpass weighting filters as proposed in [5]
Considering the particular characteristics of vehicle interior noises, we developed two weighting filters which are both independent of the carrier frequency. Adopting the proposals in [12,13], one type utilizes a low frequency weighting by accentuating modulation frequencies between 20 Hz and 40 Hz (broken line in fig.5). The broadband variant covers the modulation frequency range from 25 Hz to 90 Hz (solid line in fig.5).
SUPERPOSITION OF SPECIFIC ROUGHNESS
The specific roughness in each band ri is estimated using:
q i DC p i t i i m g z e z r = ⋅ ( ) ⋅ ( )
with exponent t between 1.5 and 2 according to [3,7] and a weighting function g(zi) with
exponent p between 0.5 and 2 which accounts for the dependence of roughness on the carrier frequency (see fig.6).
Figure 6: Weighting function g(zi) for carrier frequency according to [4]
To improve numerical stability and fit the roughness model to the results of our listening tests,
we included the envelope´s DC-value eDC(zi) with exponent q between 0 and 0.15 in the
calculation of specific roughness.
Up to this point, each band is considered independent from the neighbouring bands. A simple superposition of specific roughness would lead to an overestimation of perceived roughness especially for broadband noise. To obtain correct roughness values, one must take into account the correlation of the envelopes of adjacent critical bands. There are several proposals for the
proper consideration of a critical band´s cross correlation with its lower and upper neighbours ki-2
and ki [5,7]. So, we decided to use variants of monotonic transforms T(ki,ki-2) as a additional
parameter of our model. Furthermore, we generalized the linear superposition introducing the superposition parameter s in s T k ki s i i r C Roughness= ⋅ ∑( ⋅ ( 1, −2))
with calibration constant C. A parameter value s > 1 accentuates the more prominent roughness components compared to the average roughness leading to a psychoacoustically reasonable extension of our model.
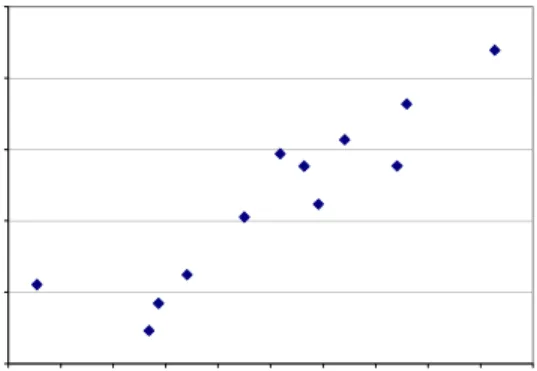
CONCLUSION
In this paper we presented a generalized psychoacoustical model for modulation parameters which can be adjusted for the correct assessment of roughness present in vehicle interior noise. The model is based on two versions of the excitation-time pattern taking into account different psychoacoustical assumptions of the properties of the peripherial auditory system. To gain flexibility in the optimization procedure, the model offers certain degrees of freedom in the calculation of the effective modulation index, the specific roughness, and the superposition. The optimized model was tested with subjective data obtained from direct magnitude estimation
(22 test persons), [8]. The results (fig. 7) show a significant correlation (R ≈ 0.9) between
subjective scores and our new modulation parameter.
Figure 7: Correlation of subjectively perceived roughness with calculated data
ACKNOWLEDGMENTS
The author thanks sincerely Dr. M. Pflueger, Dr. F. Brandl, W. Biermayer and Dr. A. Ronacher of AVL List GmbH and Dr. M. Hussain of Joanneum Research for their contribution to this work.
REFERENCES
[1] M. Pflueger, R. Hoeldrich, F. Brandl, W. Biermayer: Psychoacoustic Measurement of Roughness of Vehicle Interior Noise. - 137th Meeting of the Acoustical Society of America, 2nd Convention of the European Acoustics Association, Berlin, March 14-19, 1999
[2] F.Brandl, W.Biermayer: A New Tool for the Onboard Objective Assessment of Vehicle Interior Noise Quality. - 1999 SAE Noise & Vibration Conference & Exposition, May 17-20,
0 0,05 0,1 0,15 0,2 0,25 00 02 04 06 08 10 12 14 16 18 20
Mean of Subjective Roughness Ranking
Cal c ul ated Modul ati on P a ra mete r
Grand Traverse Resort, Traverse City, Mi.
[3] E. Terhardt: On the Perception of Periodic Sound Fluctuations (Roughness). - Acustica Vol.30 (1974), pp 201-213.
[4] H. Fastl: The Psychoacoustics of Sound-Quality Evaluation. - Acustica Vol.93 (1997), pp 754-764.
[5] W. Aures: Ein Berechnungsverfahren der Rauhigkeit .- Acustica Vol. 58 (1985), pp 268-281. [6] P. Daniel, R. Weber: Calculating Psychoacoustical Roughness. - Proc. Internoise 1993, pp 251-265.
[7] P. Daniel, R. Weber: Psychoacoustical Roughness: Implementation of an optimized Model. - Acustica Vol.83 (1997), pp113-123
[8] M. Pflueger, R. Hoeldrich, F. Brandl, W. Biermayer: Psychoacoustic Measurement of Roughness of Vehicle Interior Noise, Proc. 137th meeting of the Acoustical Society of America, Berlin, March 14-19, 1999
[9] E. Zwicker: Psychoacoustics. - Berlin : Springer Verlag, 1990.
[10] B. Moore, Glasberg: ” A Revision of Zwicker´s Loudness Model”, Acustica Vol.82 (1996), pp335-345.
[11] E.Zwicker, H. Fastl: Psychoacoustics - Facts and Models. - Springer, Berlin 1990.
[12] N. Springer, R. Weber: Existenzbereich der R-Rauhigkeit.- Proc. DAGA 1994, pp 1221-1224
[13] N. Springer, R. Weber: Bewertung von amplitudenmodulierten Schallen im R-Rauhigkeitsbereich.- Proc. DAGA 1995, pp 839 - 842


![Figure 4: Bandpass weighting filters as proposed in [5]](https://thumb-us.123doks.com/thumbv2/123dok_us/1950877.2788546/6.918.222.695.104.406/figure-bandpass-weighting-filters-proposed.webp)
![Figure 6: Weighting function g(z i ) for carrier frequency according to [4]](https://thumb-us.123doks.com/thumbv2/123dok_us/1950877.2788546/7.918.215.702.304.605/figure-weighting-function-g-z-carrier-frequency-according.webp)