LUSTER: Wireless Sensor Network for Environmental Research
L. Selavo, A. Wood, Q. Cao, T. Sookoor, H. Liu, A. Srinivasan, Y. Wu, W. Kang,
J. Stankovic,
D. Young
†,
J. Porter
‡Department of Computer Science †Department of Biology ‡Dept. of Environmental Science University of Virginia Virginia Commonwealth University University of Virginia
{
selavo
|
wood
|
qc9b
|
sookoor
|
hl4d
|
av3b
|
yw5s
|
wk5f
|
stankovic
}
@cs.virginia.edu,
[email protected], [email protected]
Abstract
Environmental wireless sensor network (EWSN) systems are deployed in potentially harsh and remote environments where inevitable node and communication failures must be tolerated. LUSTER—Light Under Shrub Thicket for Envi-ronmental Research—is a system that meets the challenges of EWSNs using a hierarchical architecture that includes dis-tributed reliable storage, delay-tolerant networking, and de-ployment time validation techniques.
In LUSTER, a fleet of sensors coordinate communica-tions using LiteTDMA, a low-power cluster-based MAC protocol. They measure the complex light environment in thickets and are open to additional ecological parameters, such as temperature and CO2.
LUSTER has been deployed and evaluated in laboratory, forested, and barrier island environments. It includes new sensor hardware designs: (a) “SolarDust,” a hybrid multi-channel energy harvesting and sensing device; (b) “Medusa,” a spatially reconfigurable light sensor; (c) a removable SD card storage node; and, (d) in-situ user interface tool for de-ployment time validation.
Categories and Subject Descriptors
C.2.4 [Computer-Communication Networks]: Dis-tributed applications
General Terms
Design, Implementation, Experimentation, Performance
Keywords
Wireless sensor network, architecture, network protocol, LiteTDMA, storage, mote, environmental science, validation
1
Introduction
Perhaps, one of the most beneficial and interesting ap-plications of wireless sensor networks (WSN) is the ability to create a “macroscope”—to take a look at the big picture
Permission to make digital or hard copies of all or part of this work for personal or classroom use is granted without fee provided that copies are not made or distributed for profit or commercial advantage and that copies bear this notice and the full citation on the first page. To copy otherwise, to republish, to post on servers or to redistribute to lists, requires prior specific permission and/or a fee.
SenSys’07, November 6–9, 2007, Sydney, Australia. Copyright 2007 ACM 1-59593-763-6/07/0011 ...$5.00
of the monitored environment. There have been several at-tempts at such macroscopes, for example, a WSN deployed on Redwood trees [19], a wildlife monitoring site on Great Duck Island [10, 17, 18], tracking zebras in their natural habitat [7], and monitoring volcanic eruptions [22, 21].
All of these systems have encountered the challenges of being deployed in remote locations with limited access. Some deployment areas might be accessible only once in several months [11], straining the lifetime of sensors with limited battery power. Many are subject to harsh elements of nature that cause rapid device and sensor malfunction. Net-work links to back-end monitoring and collection systems may be intermittent due to weather or other problems, while in-network data storage is limited, leading to important ob-servations being missed.
The main features of LUSTER, Light Under Shrub Thicket for Environmental Research, are:
• An overlay network architecture — A hierarchical structure for sensing, communication, and storage al-lows replication of the system in clusters for scalability. • Reliable, transparent, distributed storage — Fault-tolerant storage is provided by unobtrusively listening to sensor node communications, thus minimizing power requirements without the need of dedicated queries. • Delay-tolerant networking— Access is provided to the
measured data over an unreliable or intermittent net-work connection.
• Custom hardware — Our designs provide combined sensing and energy harvesting, removable storage, and lightweight in-situ WSN interfaces for deployment time validation.
• Deployment time validation — We developed tech-niques and tools to increase the probability of success-ful deployment and long term operation of the system by looking for problems and fixing them early.
• Customizable web interface— Remote access to the WSN and visualization of sensor data is provided us-ing reconfigurable hypertext templates.
LUSTER targets monitoring the effects of sunlight, but is expandable to other ecological parameters such as tempera-ture, humidity, CO2, and soil moisture. These are important for study by ecologists because shrub thickets tend to over-whelm grasslands in many areas around the world, possibly indicating a global shift of flora from grassy to tree-like
vege-tation. LUSTER helps scientists understand the light dynam-ics of this process and evaluate its ecological consequences.
The main contributions of this work are:
• LiteTDMA, a cluster-based, low-power TDMA MAC protocol that supports reliable communication, dynamic reconfiguration and node addition. The schedule-driven nature and asymmetric data flow of our application al-low LiteTDMA to use up to 73% less power than B-MAC.
• An overlaid, non-intrusive reliable storage layer that provides distributed non-volatile storage of sensor data for online query, or for later manual collection. Stor-age nodes provide a throughput of one kbps, and are compatible with Linux and Windows OSs.
• Delay-tolerant networking (DTN) that supports both re-dundant in-network storage of data to eliminate data losses, and an online query mechanism for recovering data missing in the back-end.
• Hardware designs for spatially dense and reconfig-urable light sensing, an SD/MMC interface to MICAz for in-network storage, and an in-situ visualization and validation tool.
LUSTER has been evaluated in the laboratory, in a nearby forested area, and in a deployment with environmental sci-entists on Hog Island off the Eastern Shore of Virginia. Communication to the island is enabled by a long-distance wireless data link and several solar-powered access points. LUSTER provided remote connection through one such ac-cess point using a Stargate as a wireless bridge between the IEEE 802.11 and 802.15.4 networks.
After a review of related work, we explain the the ecologi-cal and WSN research motivations for LUSTER in Section 3. The system architecture, sensing layer, low-level communi-cations, distributed storage, delay-tolerant networking, and deployment validation components are presented next (Sec-tions 4–9). Our hardware design precedes the performance evaluation and conclusions.
2
Related Work
The WSN deployed on Great Duck Island (GDI) off the coast of Maine was one of the first large scale deployments of sensor networks [10]. Since this was a pioneering effort, there were many unknowns and many lessons learned during the deployment.
The architecture of the network is similar to LUSTER’s, and consists of clusters of motes linked to a base station through a transit network and gateways and eventually to clients on the Internet. The habitat monitoring system has an additional verification network which is used to collect ground truth to compare to the data collected by the sen-sor motes [17]. LUSTER, in contrast, uses a deployment time validation tool, SeeDTV [9], to ensure that the work is functioning correctly. One weakness of the GDI net-work is the single point of failure at the base station, which could lead to a loss of data if the WAN link is disconnected. LUSTER mitigates such data loss by incorporating an over-lay network of storage motes in our deployment and im-plementing delay-tolerant networking techniques. The GDI study also showed that single hop networks have a longer
lifetime than multi-hop networks.
The GDI paper comments on the nature of packet loss and the reasons behind such loss [18]. For instance, data for a relatively large period was lost in the second part of April, which was due to a database crash. The authors also show that packet loss is not independently distributed throughout the network. Therefore, LUSTER uses a storage node over-lay to compensate for the lost messages in certain areas. An-other lesson the authors learned was that the waterproof en-closure did not provide sufficient protection. LUSTER uses completely watertight enclosures with sealed cables that con-nect the main package to the external sensors to avoid prob-lems created by moisture.
A team of Harvard scientists investigated the use of WSNs for monitoring eruptions of active and hazardous volcanoes [22, 21]. They deployed two networks on active volcanoes, including an initial deployment at Tungurahua volcano and a subsequent deployment at Reventador volcano, Ecuador, consisting of 16 nodes deployed over a 3km aperture. It measured both seismic and infrasonic signals with high res-olution (24 bits per channel at 100Hz). A significant differ-ence with LUSTER lies in that their system is event-driven, triggered by activity of the volcano. However, the size of a measurement storage was a limiting factor for their system, which LUSTER addresses with a distributed removable stor-age solution and delay-tolerant networking design.
Researchers from University of California, Berkeley con-ducted a case study of a WSN that recorded 44 days in the life of a 70-meter tall redwood tree in Sonoma California, at a density of every five minutes in time and every two me-ters in space [19]. They measured air temperature, relative humidity, and photosynthetically active solar radiation of the redwood tree(s) present.
One of the biggest problems faced by this system was in-sufficient local memory in the sensor nodes to store the sam-pled data. Whenever the memory of the sensor nodes be-came full, they stopped sensing. This resulted in the death of several motes and affected system performance greatly. LUSTER overcomes this problem by having specific logger motes, which are capable of storing gigabytes of data. Even if the back-end connection fails, these logger motes ensure that sensing remains active and that the back-end can retrieve data when the connection revives. Another problem faced by the researchers from Berkeley was that the TASK architec-ture did not have a network monitoring component that pro-vided real-time information about system performance. For deployment time validation, LUSTER uses the SeeMote de-vice, which acts a network monitoring component and helps detect mote failures.
3
Motivation
The motivation for the LUSTER system is first presented from the ecological research point of view, followed by a discussion of WSN system challenges and requirements.
3.1
Ecological Motivation
Shrub cover is increasing worldwide, most often by replacing herbaceous-dominated communities, especially grasslands [2]. In North America, this phenomenon has been documented in a range of environments from desert
grasslands and arctic tundra to Atlantic coast barrier is-lands. Shrub encroachment has been linked to climate change and anthropogenic factors; however, the causes have not been thoroughly investigated. Perhaps most dramatic is the change in the light environment as community structure shifts from grassland to shrubland.
Little information is available on the link between shoot architecture and light absorption characteristics of dominant canopy trees, much less for shrubs. Additionally, most stud-ies measure light either at a single point in time or over pe-riods of minutes or hours. However, there is a need to quan-tify light at finer temporal scales because photosynthetic re-sponses occur within seconds and courser measurements of-ten underestimate the effects of brief, but inof-tense, direct light. Measuring light at a fine spatial and temporal granularity is the primary purpose of the LUSTER system.
Scientists hypothesize that a high leaf area index (LAI, or leaf area per unit ground area) and the dense and even display of leaves on shrubs reduce the number and size of gaps in the canopy. These changes create a more spatially homogeneous light environment, reducing the occurrence of microsites with a favorable light regime for grasses and other plants.
In moist systems, where transpiration demands of a dense leaf canopy can be supported, the influence of shrubs on the light environment should be pronounced. As precipitation decreases in arid environments, LAI should decline due to the relatively high evaporative demand and light should be less of a limiting factor beneath shrubs. However, only a small increase in LAI may be sufficient to reduce grass den-sity because of a low shade tolerance of species common to grasslands. Future management plans for shrublands and grasslands depend on the ability to predict the impacts of shrub encroachment and will require knowledge of the in-teractions between shrublands and adjacent grasslands, es-pecially where shrubs are expanding.
3.2
Challenges for Environmental WSNs
Wireless sensor networks for ecological research often have to be deployed in harsh environments, where they need to survive the elements of nature and function for extended periods of time with no further access for several months. Imagine a monitoring system deployed in polar regions, where access is available only during certain months of the year. The system must continue to function even when parts of it fail, due to environmental or other reasons. The need for such a reliable, fault-tolerant system is the main motiva-tion for the design of LUSTER. Our system is designed to address the following challenges:
Fast deployment time—deploying large numbers of sen-sor nodes is, in itself, a time consuming task. We simplified it by creating a system that self-organizes without the need of extensive setup tasks from the user.
Deployment assurance—the system must survive for a prolonged time after the deployment, and we desire confi-dence that it will continue to run without expensive and time consuming return visits to the site. Therefore, LUSTER must provide deployment time validation tools that verify the de-ployment status in-situ at the node and the system levels.
Reliability—reliable collection of data is critical. There are several ways in which LUSTER provides reliability:
Delay tolerance—The system must tolerate and com-pensate for intermittent or failed communication channels. LUSTER does so by buffering the on-site data, which can be accessed over the remote communications link or by obtain-ing the removable storage card.
Communication bottlenecks—Given a large number of sensors, the amount of data offered might overwhelm com-munication channels. For example, after the link to the database has failed and the system has captured large amounts of data, it may be best to resend data upon the reestablishment of the link. LUSTER amortizes the data transmission cost by keeping data in redundant storage nodes. The data may be requested and downloaded from a client manually at a desired rate or resolution, thus keeping the system functional under its constraints.
Online data access—LUSTER provides access to real-time sensor readings, as well as to historical data at several levels: the database and web server on the Internet, and the distributed storage on the WSN.
Storage capacity—The storage capacity and redundancy can be increased by adding nodes to the system. LUSTER also supports configuring the storage nodes to capture only subsets of data, thus ensuring long-term functionality, while the other data are captured by other storage nodes.
Redundancy—Increasing the storage nodes and configur-ing them to capture overlappconfigur-ing areas of the sensor nodes ensures that there are multiple copies of the data, thus pro-viding redundancy in case some of the storage nodes fail.
Heterogeneity in sensors and hardware—The LUSTER architecture and query system may include many types of sensors. The query system supports any direct sample and split-phase sensors. An extensible API allows driver devel-opment for custom sensors, where special handling of hard-ware or processing are required.
Environmental challenges—rain and humidity are mostly tolerated through sealed packaging and desiccant in-serts. However, some challenges were most unexpected. For example, we learned that one of the hazards for equipment left on the islands of the Eastern Shore of Virginia is that ex-posed cables are subject to the teeth of small critters. The solution was to cover them with a special jalape˜no pepper-based paint.
4
Multi-Layer Architecture
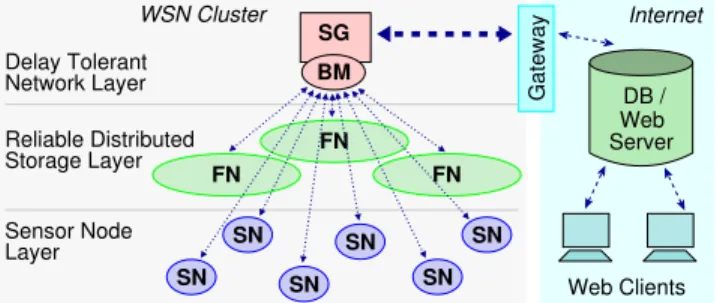
LUSTER’s architecture is composed of several layers, shown in Figure 1. Thesensor node layeris responsible for gathering, aggregating, and transmitting the measurement data. The report rate and sensor selection are configurable remotely using the SenQ sensor network query system [23]. Communication among nodes in the cluster uses LiteTDMA, a novel MAC protocol described in Section 6.
Thestorage layertransparently blankets the sensor layer, collecting and filtering the data reported by sensor nodes without initiating any communication to them. Thus band-width and power consumption are improved. The configu-ration specifies the data filtering and collection policies for each storage node, alleviating congestion internal to the
stor-WSN Cluster FN FN SG FN Network Layer Delay Tolerant Sensor Node Layer Reliable Distributed Storage Layer Web Clients Server Web DB / Internet Gateway SN SN SN SN SN BM SN
Figure 1. LUSTER’s hierarchical architecture.
age hardware due to the flash memory delays. Reliability is provided through redundant coverage: each sensor node is monitored by at least two storage nodes. The configuration and the number of storage nodes are subject to application requirements for the fault tolerance required and cost limita-tions. More details of the storage layer are in Section 7.
Above the storage layer is thedelay-tolerant networking (DTN) component of the system, described in Section 8. This consists of a base mote (denoted BM in Figure 1) at-tached to a stargate (SG) acting as a gateway between the IEEE 802.15.4 and IEEE 802.11 networks. We do not as-sume absolute reliability of this communication link. In-stead, we rely on distributed storage to capture all the data and either serve it in response to queries after the commu-nication link between the WSN and the Internet is reestab-lished, or in a delayed fashion by collecting the removable storage cards during a subsequent visit to the deployment area. The latter is the most energy efficient method for the WSN, especially when many sensors are required.
The data monitored by the WSN is accessible over the Internet by connecting to the LUSTERback-end server. The server stores the incoming WSN data stream to a database and also issues data queries to the WSN as a DTN component detects losses.
Using a web browser, a user can request and view his-torical data as well as the last captured “almost real-time” data from the back-end server. Web pages are generated from HTML templates, in which the WSN data, including the sensor readings, are embedded in the HTML as custom tags. This allows for a user-centric customizable web inter-face that is specific to the chosen application.
An example of an application-neutral display is shown in Figure 2, in which a node’s current sensor readings have been requested. Values from the eight ADC channels are tabulated and graphed. Using custom HTML tags, a user can add se-mantically meaningful labels for the channels and their val-ues. Near real-time display of sensor readings supports on-line diagnostics to determine, for example, that ADC channel one in Figure 2 is faulty and stuck at a low value.
For scalability, the WSN architecture described (and shown on the left side of Figure 1) is replicated into mul-tiple clusters that cover the entire deployment area. Clusters use single-hop communication internally, and are adjoined and managed by the stargate using several techniques.
First, each cluster is assigned a communication chan-nel that avoids or minimizes interference with its neighbors. One challenge with a multiple channel approach is the
like-Figure 2. LUSTER web server generated page reporting ADC levels for a pre-selected remote sensor node.
lihood of the base mote missing communications on one channel while listening to another. This challenge is met by the delay-tolerant design of LUSTER, which operates even when communications from the WSN clusters to the main back-end server are lost. Distributed storage and delay-tolerant networking components allow recovery of data as described above.
A second approach for inter-cluster interference mini-mization is to interleave the LiteTDMA MAC communica-tion schedules so that when one cluster is communicating, the others are asleep. The stargate acts as a super-master to coordinate the schedules.
Finally, the transmission power of nodes can be adjusted to match the cluster’s coverage area. Dynamic adjustment is also possible, and will be investigated in the future.
Next, we describe the major components of the architec-ture, starting at the bottom with the sensor node layer.
5
Sensor Queries and Data Extraction
LUSTER requires time-synchronized periodic sampling of the environmental sensors deployed, for which a number of data management protocols are available. To support de-ployment validation using the SeeDTV, however, we addi-tionally require the capability of issuing queries from devices inside the network.
SenQ is a flexible query system that we developed earlier and have modified to be used in LUSTER. It provides access to streaming sensor data internally via a TinyOS API, and externally via an efficient network protocol. A small mem-ory footprint allows it to coexist with the GUI drivers and validation logic on the SeeDTV.
Sensor devices in LUSTER execute a dedicated applica-tion calledSensorNodethat uses SenQ to query seven con-nected light sensors, voltage bias for calibration, and inter-nal battery voltage once each second. As data values are received, they are are combined into a single message for transmission to the base station and nearest storage nodes. Messages are timestamped for sequencing, and include the address of the originating node.
Report messages also include a bitmapped mask identify-ing the sensor data included in the message. Normally, this mask includes all nine values of light and voltage. However, if an error prevents querying a sensor, or if SenQ reports are not received, stale data is not transmitted, and the mask indi-cates which sensor’s data has been lost.
The sampling period and mask are configurable at deploy-ment time, for example, by the SeeDTV. If a sensor fails
val-Figure 3. LiteTDMA superframe format and timing.
idation, due to poor calibration, transient failures, etc., the operator can configure the SensorNode to omit the offend-ing sensor permanently. Failure and communication statis-tics are maintained by the SensorNode application to aid the operator in diagnosing problems.
Using SenQ allows the deployment validator to have snapshot and streaming access to all available sensors, including light, temperature, internal voltage, and signal strength (RSSI).
6
LiteTDMA MAC Protocol
Wireless communications are the focus of a WSN because they carry data and control signals among the nodes. This process must be as efficient and low-power as possible to facilitate long-term functioning of the system. In the case of LUSTER, communication within each cluster of nodes is one hop. Large networks are composed of multiple clusters. Since LUSTER is schedule-driven rather than event-driven, we decided to use a TDMA MAC rather than a CSMA protocol such as B-MAC [13]. This is in agreement with recent research showing that TDMA is preferred for the last leg in WSN communications [1]. Most communication is directed from sensor nodes toward the stargate gateway, a structure that is well suited for a TDMA MAC.
We did not find an implementation that was efficient and flexible enough for our purposes, or which had source code available that we could easily adapt. For example, we wanted to support dynamic registration of new nodes and online ad-justment of the TDMA timing parameters for optimal perfor-mance and power savings.
Therefore, we designed and implemented a low-power TDMA network protocol, LiteTDMA, as part of LUSTER. The protocol is designed to be flexible and adjustable to the current system requirements. The number and duration of transmission slots in the schedule can be adjusted at runtime depending on the number of slave nodes and the sensing rate. For example, if the rate is low, slots can be short so that nodes spend most of their time sleeping and saving power.
Coordination is managed by one active master node. There can be as many slave nodes as the LiteTDMA con-figuration permits. Dormant master nodes are also allowed that periodically wake up and take over management if the active master node is not functioning properly.
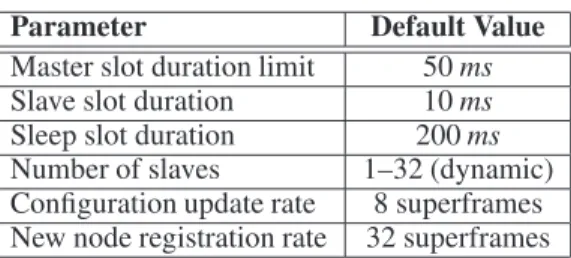
Communication is organized into repeating superframes, shown in Figure 3. Each superframe has a Master slot, a Sleep slot, and a number of Slave slots.
Parameter Default Value
Master slot duration limit 50ms Slave slot duration 10ms Sleep slot duration 200ms Number of slaves 1–32 (dynamic) Configuration update rate 8 superframes New node registration rate 32 superframes
Table 1. LiteTDMA configuration parameters. • TheMaster slot begins every superframe, and slaves
always listen to it. The slot’s duration is dynamic since it includes both mandatory and optional elements, but its length is bounded by a limit, allowing to use only as much of the power as is needed to transmit the sched-uled data. It includes the following elements:
AConfigmessage is sent periodically to set LiteTDMA parameters (shown in Table 1) in the network, including the number and duration of slots.
AControlmessage is sent every superframe to synchro-nize all listening slaves. It contains an acknowledgment mask to indicate whether retransmission is needed, and a listen mask to instruct slaves when to listen for slave broadcasts.
ANewbiemessage is sent periodically to announce that any new nodes may try to join the network in the newbie slot that follows. This process is described below. Data messages from the master to slaves, if any, are transmitted in the remaining time of the Master slot. • During the Sleep slotno communication takes place,
and all nodes (including the master) power down their radios in order to save energy. Nodes are free to perform any application-specific sensing or computation activi-ties during this slot, or power down completely to save even more energy. The duration of the sleep slot directly impacts energy, latency, and throughput, as we quantify in our evaluation (in Section 11.1).
• Slave slots are fixed in duration for synchronization purposes, allowing slaves to sleep after the master slot and wake up only at their predetermined slot start time. During its slot a slave node sends control and data in-formation, if any, to the master. Multiple messages may be sent if they fit within the configured slot duration.
6.1
Time Synchronization
LiteTDMA slaves synchronize on the reception of the control message that begins every superframe. This obvi-ates the need for a separate time synchronization protocol, and enhances reliability in the event of a master failover.
Control messages include a 32-bit global time value (mil-liseconds since a programmable epoch) that updates the slaves’ clocks. When a slave’s local clock has drifted more than a configurable delta from the global time, a software event is signaled to upper layers. In LUSTER, this event is used to re-synchronize sampling in SenQ, to guarantee that light samples can be correlated across all slaves.
6.2
Broadcast Mode
Typically, a slave node only wakes up to listen during the Master slot and to transmit during its slave slot. The rest
of the time the radio is turned off to conserve power. This requires slaves to communicate with other slaves indirectly, through the master acting as a proxy. However, sometimes it is more efficient for the slaves to communicate directly. This is achieved by requesting the Master to activate a broadcast mode (denotedBMin Figure 3), during which all or a subset of nodes (determined by the control message’s listen mask) are awake and receiving during the slots of other slave nodes. One example where this mechanism is used is system de-ployment time validation: the SeeMote node acts as a slave, but communicates directly to the other slaves for diagnostic purposes using the broadcast mode.
6.3
Promiscuous Mode
To support the overhearing storage layer in LUSTER, LiteTDMA provides a promiscuous listening mode. The ap-plication uses a TinyOS API to specify a list of slave slots to be overheard. Similarly to broadcast mode (but uncoordi-nated by the master), the node will turn on the radio in these slots for reception of messages.
6.4
Acknowledgments
By default the slave nodes transmit data during their scheduled slots and assume that the data has reached the des-tination. For reliable communication, acknowledgments can be implemented at the higher application layers as necessary. However, in cases where more effective assurance with less overhead is required, the slave nodes may request acknowl-edgments from the master for the messages they send. The master supports the requests by sending an acknowledgment bitmask during its control phase. Thus, if the acknowledg-ment bit is missing, the slaves automatically retransmit the messages that were missed.
When more than one message has been sent during the slave slot, the master checks the CRC of all the received mes-sages during the slave’s slot, and acknowledges success if they all match. This approach saves communication over-head in comparison with an alternative solution in which each message is assigned an acknowledgment bit. The down-side is that when a CRC mismatch occurs, the slave needs to resend all of the messages from its previous slot. However, in the case of short slot durations this is not a problem, espe-cially because collisions and message failures are less likely in TDMA protocols.
6.5
New Node Registration
LiteTDMA allows for dynamic new node registration with the network as Figure 3 illustrates. A special “new-bie” slot follows the Master slot at a predefined rate. During this slot the new, unregistered nodes are allowed to contend for the registration in a CSMA fashion. They submit a reg-istration request with their unique 64-bit hardware IDs. If the master has free slots available, it acknowledges a request with a slot ID assignment message containing the slave’s hardware ID. This mechanism is useful when we have dor-mant nodes for fault-tolerance purposes. For example, if one sensor node stops functioning, a dormant node can take over its function after obtaining a slot assignment. Also, the en-vironmental scientists may decide they need higher density and want to add more nodes.
6.6
Dynamic Performance Optimization
LiteTDMA has unique features that allow for dynamic performance optimization.
• All of the LiteTDMA parameters can be adjusted at runtime and broadcast to the slaves, which reconfigure themselves with the new parameters immediately. • The number of Slave slots may be adjusted to the
num-ber of registered nodes, and unused superframe time shifted into the Sleep slot to save power.
• The new node admission rate can be adjusted relative to the number of currently registered nodes. If there are very few active nodes and many open slots, there might be a high probability that a new node will want to self-register, and vice versa.
• When there are more slave nodes than slots, the nodes with statistically lower communication rates can be time-multiplexed over a few slots, while the active slaves keep their slots permanently.
• Nodes with much lower communication rates or those that are for redundancy and backup purposes can unreg-ister from the network and power-down for long-term sleeping in order to save energy. When the time comes, they wake up and register themselves again. This allows for multiple redundancy. For example, if some nodes deplete their energy or storage space early, they unreg-ister and yield for the replacement nodes when those wake up. This sort of service is supported by LiteT-DMA but may need supervision from the higher layers of the application.
6.7
Performance Monitoring
LiteTDMA captures internal performance-related events, for example: the number of messages sent and received suc-cessfully, failed sends, internal message buffer overflows and a list of internal variables for debugging purposes. These statistics can be reset or reported on demand, or scheduled to report periodically. This has been very useful for the debug-ging and performance evaluation of LiteTDMA in LUSTER deployments.
7
Reliable Distributed Storage
In many common application scenarios, all the sensor nodes send raw or preprocessed data to the base station over the wireless communication channel. The base sta-tion then transfers the collected informasta-tion to a remote con-trol/redistribution center to be accessed by end users.
In most cases, the communication channel between the base station and the remote center is also a wireless commu-nication link. Especially in harsh environments, this link is often unreliable, making the sensor data prone to loss. The base station also introduces a single point of failure.
For data-critical applications, it is desirable to have a re-dundant and reliable storage capability in-network. After de-ployment in the field, sensor nodes transmit their sampled data to the base station using LiteTDMA, while dedicated storage nodes overhear and store them passively. Flash stor-age cards can be physically retrieved later, or their data can be queried online by users connected to the back-end server. These requirements motivate our design of a distributed storage system for WSN that has the following properties:
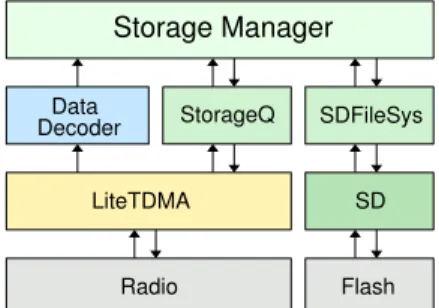
Storage Manager Data SDFileSys LiteTDMA SD Flash Radio StorageQ Decoder
Figure 4. Storage node software architecture. • Reliability: The distributed storage system is tolerant of
up tokstorage node failures. Even if a node fails, data persists in the flash-based storage for later retrieval. • Capacity: It provides flexible storage capacity to meet
application lifetime requirements at minimum cost. • Low Latency: User queries for sensor data lost on an
unreliable back-end link are satisfied quickly.
• Availability: The file system on the removable storage is compatible with other operating systems (Windows and Linux) to ease data recovery and analysis.
• Energy Efficiency: Storage and retrieval of sensor data is optimized to minimize the energy cost of accessing flash memory.
LUSTER’s storage service distinguishes itself from exist-ing approaches developed for motes in two ways. First, it provides easy and non-intrusive access to the data collected. For example, one can leave the storage nodes with the sensor nodes in the field to collect information. Later, a technician can download data using only a small portable device with an SD/MMC card reader, without disturbing or interacting with other elements of the deployed system.
Second, it enables storage of gigabytes of data. FAT16 file systems can easily allocate up to 2 gigabytes of flash with a relative small foot print (3150 bytes of ROM, and 1131 bytes of RAM). Many existing file systems for the on-board flash handle on the order of kilobytes of memory. Larger capacities are desirable for remote data logging.
7.1
Software Architecture
Figure 4 shows the software architecture for a storage node. We explain each component in turn.
TheData Decodercomponent parses the sensor data re-port messages and delivers the sensor data to the storage manager component in <source, sensor type, timestamp,
data value>tuples. Messages from sensor nodes not in the
storage node’s configured coverage zone are dropped. TheStorage Managercomponent receives data from the Data Decoder component and writes the data according to the configured policies to theflash(shown at the bottom of Figure 4). The Storage Manager also retrieves requested data from the flash and presents it to the StorageQ component.
TheSDFileSyscomponent provides a FAT16-compatible file system on the Secure Digital/MMC card, which is driven by theSDcomponent. Data are buffered until a sector (512 bytes) is full, or can be flushed to the flash on demand. Clients are provided with a POSIX stdio-like programming interface to manage files.
FN FN FN FN SN SN SN SN SN SN SN SN SN
(a) Grid topology
FN FN FN SN SN SN SN SN SN SN SN SN (b) Random topology Figure 5. Example sensor (SN) and storage (FN) node deployment topologies.
The StorageQ component receives query requests from the network. It obtains the requested data from the Storage Manager and sends it to the querying device. Most of the time this is the base station (on behalf of a back-end client), but it can also be the deployment validation mote.
7.2
Storage Policies
System storage policies control the behavior of the Stor-age ManStor-ager component, and may be configured by mes-sages received from the back-end server.
Anorganization policydefines the logical layout of data stored in the flash memory. Policies used in LUSTER to organize the sensor data are: (1) all in one, in which all the sensor data are stored a single file; (2) by node identity, in which all the data from the same node are stored in one file; (3) by sensor type, in which all data of the same type are stored in one file; and, (4) by timestamp, in which all data from the same time periodT are stored in one file. These options enable operators to tailor the storage format to match application-specific presentation and analysis needs.
Anoverwrite policydetermines what to do with new data when the storage is full. Options provided are: (1) FIFO, first in first out, in which the oldest data are overwritten first; (2) uploaded, in which the data already transferred to the back-end server is overwritten first; (3) priority, in which less significant data is overwritten first; and, (4) drop new data when the storage is full.
7.3
Coverage and Deployment
The dominant mechanism for achieving reliable storage is redundancy. The number and placement of storage nodes should be determined by optimizing with respect to two cri-teria: (1) overlapping coverage areas increases resilience to missed or corrupted messages, and (2) limiting coverage area maintains manageable flash memory bandwidth require-ments.
Figure 5 shows two examples of storage node deploy-ments, when the system uses a grid topology and when sen-sor nodes are randomly distributed. Sensen-sor nodes should be covered by multiple storage node influence areas, shown as large arcs in Figure 5(b), according to the desired degree of redundancy.
Storage nodes may store data from any overheard sensor reports, or they may restrict their coverage to avoid overbur-dening their energy resources. At deployment time, the base station or validation mote may send a configuration message to the Data Decoder component with a node ID bitmask to determine coverage.
The storage node only needs to listen to those slave slots indicated in the mask, and does so using LiteTDMA’s promiscuous listening mode (see Section 6.3).
8
Delay Tolerant Networking
In LUSTER, we use Delay Tolerant Networking (DTN) techniques to increase reliability, particularly when connec-tions to the gateway or the back-end server are lost. For ex-ample, in the Hog Island deployment, power to the wireless access point is lost at night, and the directional antenna at the gateway is subject to transient unreliability due to wind.
There are two major parts to the DTN solutions in LUSTER. One is an overhearing-based logging technique (described in detail in Section 7), and the other is the delayed transmission of stored data.
8.1
Overhearing-Based Logging
LUSTER addresses the problem of loss of connectivity to the base station/gateway by in-network buffering. Unlike the redwood system [19], which used local memory within the sensor nodes to store the data, LUSTER has dedicated stor-age nodes with sufficient memory (GB) to store all the sensor values. These storage nodes (up tonof them for added reli-ability) are all within one hop of their assigned sensor nodes and can overhear and store all data transmissions.
Since our application is tolerant of time delays, we can store the data values for a long time and retrieve them when normal operation is restored in the system. This flexibility allows our system to cope with inadvertent connection fail-ures, during which the system continues to gather data with-out interruption. Overhearing avoids the cost of explicit ra-dio traffic between sensors and storage nodes.
8.2
Delayed Data Retrieval
A challenge of DTN is the delivery of the stored data af-ter a lost back-end connection is recovered. LUSTER uses areactiveapproach, in which the back-end detects loss once the link is restored. It issues a query for the missing data to the network through its connection to the gateway. Placing responsibility for querying data in the back-end also allows application-specific criteria to be used by operators in deter-mining whether the energy cost of remote retrieval is justi-fied, or whether the lost data should remain in-network for later manual retrieval from flash storage cards.
Upon reception of a query for data that a storage node possesses locally, the node fragments the requested data into message-sized chunks for transmission to the base station. Additional queries received while busy are queued for later processing.
Since data collection continues in parallel and queries may result in large amounts of data to be transmitted, the storage node tracks its progress in satisfying the query as it sends batches of data in its LiteTDMA slave slot. Given suf-ficient bandwidth on the gateway to back-end link, query re-sponses do not cause additional congestion within the WSN since storage nodes are given dedicated LiteTDMA trans-mission slots like all other slaves.
9
Deployment Time Validation
System reliability is improved by lowering the risk of early failures and minimizing the expense of revisiting the site for re-deployment, maintenance, or repairs. Often the
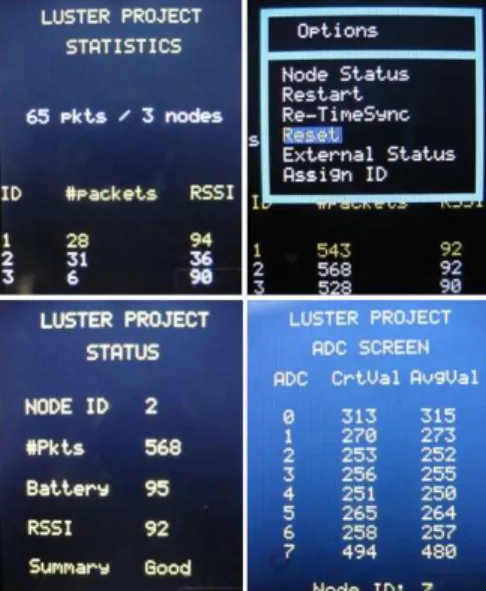
Figure 6. SeeDTV user interface for deployment time val-idation on a SeeMote device.
performance of deployed systems differs significantly from what is theoretically expected or observed during develop-ment [17, 15, 19, 4, 18, 24], thus deploydevelop-ment time validation (DTV) has become an indispensable part of fielding a real system.
The DTV problem in LUSTER is as important as it is challenging. Since this system is deployed on a remote is-land on the Eastern Shore of Virginia and requires consider-able time to drive, boat, and finally hike to reach, it is rather difficult to validate the whole system using testing or debug-ging methods in the field [8, 5]. It is cumbersome to bring conventional electronic test tools or even laptops to the field because of their size, cost, and the difficulty of powering them while they are in the field. What is really needed is a lightweight validation tool with long battery life.
Based on the above motivation, we developed a deploy-ment time validation approach, named SeeDTV [9], that consists of techniques and procedures for WSN verification, and an in-situ user interface device, called SeeMote [14]. SeeDTV has demonstrated the potential for early problem detection in three domains of WSNs: sensor node devices, wireless network physical and logical integrity, and connec-tivity to the back-end data server. For a more detailed de-scription of the application scenario and hierarchical valida-tion structure, please refer to Liu et al. [9].
Now we discuss the implementation of the SeeDTV in the LUSTER system. When the SeeMote enters the deployed region, it periodically broadcasts a Query message during its assigned LiteTDMA time-slot. The query asks the slave nodes (through the master) to return their health status, in-cluding local ID, RSSI value between the base station and the slaves, remaining battery (in percentage), and ADC val-ues (channels 0 to 7 for MICAz motes). SeeMote displays this useful information on the LCD screen in a series of test modes, as shown in Figure 6. These modes are navigated using the buttons on the SeeMote device, and are detailed below.
• Statistics Screen: This screen shows all the nodes re-sponding to queries in the LUSTER network, together with the number of packets received from them and the latest RSSI value. A completely failed node is notice-able here for its absence. Pushing the right button ad-vances the node selection and the left button shows the Options Screenof the selected node.
• Options Screen: In this screen, several operations are available to support DTV, including: “Node Status” to enter the nodeStatus Screen; “Restart” to re-count the number of packets received; “Re-Timesync” to instruct the stargate to synchronize time in LUSTER again; “Reset” to make the network restart; “External Sta-tus” to check whether the connection between the web server and the base station works well by sending a “Ping” message to the back-end through the stargate; and, “Assign ID” to assign an unused local ID to a new sensor node.
• Status Screen: When a node has been selected for fur-ther examination, the Status Screen shows more de-tailed information to help determine whether the node survived deployment. It shows the number of packets received from the node, the RSSI value between the node and the base station, the estimated remaining bat-tery charge in percentage, and a summary evaluation. • ADC Screen: Pushing the right side button switches
from theStatus Screento theADC Screen. It shows the node’s ADC readings, including the latest values and a moving average from the eight channels. The textual or graphic display of the light values can help locate a faulty sensor or confirm sensor localization (described in Section 11).
One of the biggest advantages for this validation process is to easily detect and prevent sensor node failures while they are in-field. For example, we may find that a normally work-ing node has less than 20 percent remainwork-ing battery charge. Rather than wait for communication quality to deteriorate, increased packet loss, and eventual node death, we can pre-emptively replace the battery.
Or, we may find that a node with a known ID is not dis-played on the SeeDTV Statistics screen. Then we can go investigate further to determine whether, for example, it was switched off by mistake or an obstacle is interfering with its communication.
In summary, DTV in LUSTER uses a power, low-cost dedicated in-the-field debugging tool. The code and memory required to support it on sensor and storage nodes is small (ROM: 460B, RAM: 1B). Together, the SeeMote and SeeDTV components minimize deployment time and cost, and improve system reliability.
10
Hardware Design
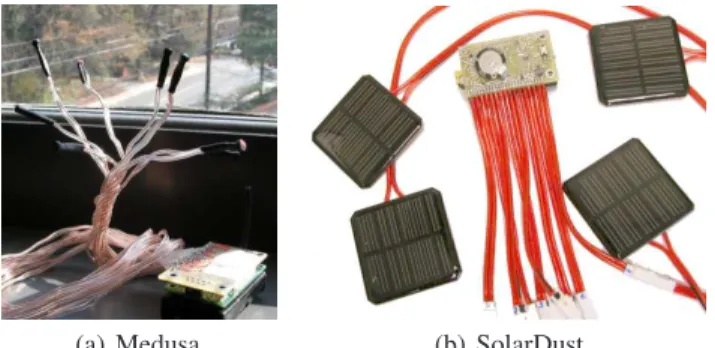
We designed several custom hardware modules to ac-commodate the specific needs of LUSTER. We discuss the seven-channel light sensor, energy harvesting module, stor-age node, and the in-situ user interface node. All these mod-ules were designed to be compatible with MICA2 and MI-CAz motes by Crossbow Technologies [3].
(a) Medusa (b) SolarDust
Figure 7. Spatially reconfigurable light sensor modules designed for LUSTER.
10.1
Sensor Node
Discussions with environmental scientists revealed that LUSTER needs a large number of light sensors deployed in various configurations. The distance between the light sensors varies between a centimeter to half a meter. The straightforward solution of having one sensor per network node eliminates the need for any wires, however it creates the following problems:
• The minimum distance between the nodes is limited by the node size. In some clusters at Hog Island, nodes were placed at logarithmically increasing dis-tances, starting with 1cmseparation.
• The large number of sensors creates large overhead in communications and power consumption. A deploy-ment in a 5 x 5m area at a 0.5m pitch requires 121 nodes.
Therefore, an alternative solution was implemented, hav-ing a self-contained network node with up to eight sensors attached. The sensor attachment is by cable that is up to 0.5mlong. This allows for flexible deployment as well as sensor data aggregation on the network node and less over-head.
Two versions of such a system were implemented: a sim-ple eight-channel sensor node, called “Medusa” (shown in Figure 7(a)), that can have a variety of sensors attached, and a more sophisticated hybrid node, “Solar Dust,” that also has eight channels which can be multiplexed between energy harvesting and sensing (see Figure 7(b)).
The Medusa node can have eight channels, each config-ured by a resistor array in hardware depending on the sen-sor type and requirements. For example, for the Hog Island deployment, the eighth channel measured a bias voltage for light sensor calibration. For light sensors, the simplest im-plementation is a light sensitive resistor, a photo transistor, or diode attached by a cable. The channel is connected to the ADC input of the mote.
The Solar Dust mote uses the attached solar cells to aggre-gate the energy and store it in a super-capacitor and, through a voltage boost converter, to charge a Lithium Polymer bat-tery. Simultaneously, each of the eight solar cells can be sampled for the voltage they generate depending on the in-cident light on them. Thus they double as sensors. A draw-back of such a method for the particular light environment of LUSTER at Hog Island is that the solar cell generates
(a) Storage node
(b) SeeMote
Figure 8. Storage and SeeMote user interface modules.
the most energy when fully illuminated; however, light lev-els under typical shrubs are typically five percent or less of bright sunlight. Another reason we decided to use the Medusa sensors for deployment is because the solar cells are rather large, while the environmental study requests a much smaller area for sampling light.
10.2
Storage Node
A module that interfaces a removable SD/MMC flash storage card to a MICAz mote was implemented for in-network storage (see Figure 8(a)). The card is accessed in SPI mode due to the ease of royalty-free integration with the existing controller on the mote. However, the hardware al-lows for a proprietary SD interface implementation, provid-ing the implementers have obtained the proper license.
10.3
Validation Node
The deployment time validation tool SeeDTV is enabled by the in-situ user interface module SeeMote (see Fig-ure 8(b)). The module has a 128 x 160 pixel color LCD that is 1.8 inches across—sufficiently large to display information and diagnostics about the deployment, yet small and light enough to fit in a shirt pocket. When deploying a WSN in a remote area, a small, lightweight, energy-efficient device that does not require frequent charging is favorable. SeeMote is such a device, and is eight to nine times more energy efficient than an iPAQ PDA [14].
We also developed a lightweight GUI library that allows the display of simple text and graphics primitives. This en-ables SeeMote to be a versatile tool for WSN applications where a user interface is needed with IEEE 802.15.4 com-munications capabilities.
10.4
Packaging
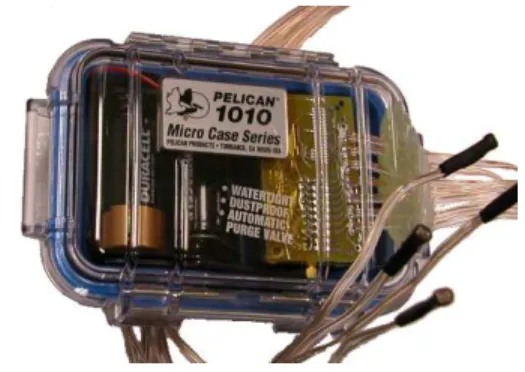
The packaging for the sensor nodes had to be lightweight and compact for easy transportation to the remote site and weather-proof to protect the hardware from damage by cor-rosive sea salt. In addition, the sensors were attached by cable and therefore needed a waterproof passage through the case. We considered waterproof connectors, but found that they would increase the price per sensor considerably. Therefore, we chose to create a hole in the water-tight pack-age and then seal the cables that run through the hole with a silicon sealant compound. The packages stood the test of complete immersion in water.
Each network node can have up to eight sensors attached by cable. Since both the cables and the sensors are suscep-tible to damaging elements such as the teeth of little crit-ters, we took two preventive measures. First, we obtained a
Figure 9. Packaged “Medusa” sensor module.
special anti-rodent paint for cables to discourage the tiny at-tackers [6]. Second, we incorporated less costly in-line con-nectors so that the damaged sensors could be replaced or a different type attached, as in the case of solar cells.
Finally, we chose Pelican cases (shown in Figure 9) [12] for packaging since they are easy to operate, have a good reputation of being water-tight and durable, have transpar-ent acrylic covers so we could visually check them without opening if needed, and come in different sizes appropriate to the various sensors. This solution met our requirements.
11
Evaluation
LUSTER has been deployed in three different outdoor lo-cations, for durations of hours to weeks. Since long-term data is not yet available from the Hog Island deployment, we present a performance evaluation of two key components of LUSTER, LiteTDMA and the storage service, in a labora-tory setting. Then we describe measurements from an out-door test deployment and our experiences from Hog Island.
11.1
LiteTDMA Evaluation
The primary motivation for implementing LiteTDMA in-stead of using one of the many available MAC protocols is the need for a lightweight, low-power protocol. Thus, hav-ing a considerable savhav-ings of power, as compared to other widely used MAC protocols, was essential to justify the time and effort required to implement LiteTDMA.
To illustrate the effectiveness of the LiteTDMA protocol, we compare it with existing MAC protocols S-MAC and B-MAC. S-MAC is a CSMA-based protocol, which we use to show the gains of LiteTDMA over the common choice of uncoordinated, opportunistic MAC protocols in WSNs. Despite their robustness to node failure and a lack of de-pendence on time synchronization, CSMA protocols require nodes’ radios to listen much more often than our solution does.
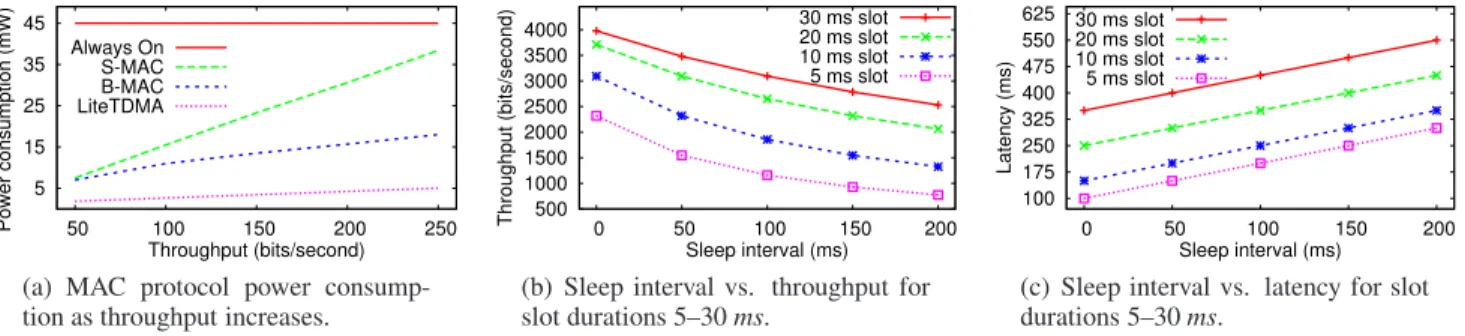
Prior work shows that B-MAC performs better than S-MAC as communication throughput increases. Data from Polastre et al. [13] is replotted in Figure 10(a) for compari-son with LiteTDMA. At a throughput of 200 bits/second, B-MAC consumes about 15mW of power while S-MAC con-sumes about 35mWof power.
By comparison, LiteTDMA consumes just over 4mW of power at the same throughput. In our experiments, we used a single cluster of ten slave nodes and one master, varying the application data rate and measuring the energy consumed by LiteTDMA. The master slot lasted 50ms, and each slave
5 15 25 35 45 50 100 150 200 250 Power consumption (mW) Throughput (bits/second) Always On S-MAC B-MAC LiteTDMA
(a) MAC protocol power consump-tion as throughput increases.
500 1000 1500 2000 2500 3000 3500 4000 0 50 100 150 200 Throughput (bits/second) Sleep interval (ms) 30 ms slot 20 ms slot 10 ms slot 5 ms slot
(b) Sleep interval vs. throughput for slot durations 5–30ms. 100 175 250 325 400 475 550 625 0 50 100 150 200 Latency (ms) Sleep interval (ms) 30 ms slot 20 ms slot 10 ms slot 5 ms slot
(c) Sleep interval vs. latency for slot durations 5–30ms.
Figure 10. Performance of LiteTDMA depends on application trade-offs among energy, throughput, and latency.
slot lasted 10ms, long enough for a node to transmit several packets per superframe if needed.
B-MAC’s power consumption increases only sub-linearly as throughput increases, while LiteTDMA increases more rapidly. Yet, since many sensor networks operate with a throughput of much less than one kbps, LiteTDMA would be more power efficient than B-MAC for applications like LUSTER that can tolerate delay. LiteTDMA’s power con-sumption increases linearly because, in order to gain high throughput, the superframe’s sleep interval is decreased, re-sulting in increased power consumption.
The length of the sleep interval directly affects both throughput and latency, as shown in Figures 10(b) and 10(c). Using the cluster of ten slave nodes and a master, we gradu-ally increased the sleep interval and measured the throughput and latency for different slave slot durations. For a sleep in-terval of 200ms, latency is as high as 550mswhen the slave slot duration is 30ms. In LUSTER, this latency is tolerated well due to the DTN techniques discussed in Section 8, and the low overall data rates.
These results show that LiteTDMA’s performance de-pends on application trade-offs among energy, throughput, and latency.
11.2
Distributed Storage
We evaluate our storage service using the critical perfor-mance metrics of energy, lifetime, and maximum supported bandwidth. For all the experiments, each sensor data item stored to flash is a nine-byte tuple: <node ID, sensor ID,
sensor value, timestamp>. The file system has a 512-byte
(one sector) buffer. The write operation provided by the file system holds the input data in the buffer until it is full, then flushes the data automatically to the SD card, a 1GBcard made by Transcend.
We first study the energy consumption of the entire stor-age process, which includes initializing the SD card, creating a file, writing data to the buffer, flushing the data to the SD card, and closing the file.
Figure 11 plots the energy consumption of a node writing 56 data items (504B) to the SD card. The data was collected with a power meter connected to the storage node via the MICAz’s 51-pin connector. The power meter samples the current drawn by the node at a rate of 200Hz. During the experiments, the supply voltage of the node was 3.09V.
The five phases of the storage process (and one due to the test) are reflected in the energy consumption levels shown in
0 20 40 60 80 2000 2500 3000 3500 4000 4500 5000
Energy Consumed (mA) Time (ms)
A B C D
E F
Figure 11. Energy consumed while writing 56 data items (504B) to storage node’s flash.
Figure 11, and are labeled with lettersA–F. When the stor-age node is off (regionA), no current is drawn. After power is switched on, the SD card begins initialization (regionB). Current varies between 13.4mAand 28.1mAafter an initial ramp-up, and initialization completes in about 600ms.
The storage node waits for 500msafter initialization (re-gionC) before starting any file activity. During this time, the current drawn is stable at 22.3mA. This delay is not nec-essary or typical when using the storage service, and is an artifact of the testing methodology.
When a new file is created and data is written to the in-ternal buffer (regionD), current jumps to 50.4mA. File cre-ation requires I/O (FAT entry and root directory modifica-tion) to the SD card, consuming more power. Buffered data is flushed to the flash in region E, during which the peak current drawn is 84.5mA. After closing the file, the current stabilizes at about 35mA (regionF), the steady-state con-sumption in the absence of activity.
We conclude that flushing to flash memory incurs a sharp current increase up to 84.5mAand consumes the most en-ergy of all operations. Since writing to the file system buffer consumes less energy (51mAvs. 84.5mA), for highest en-ergy efficiency the storage node should only flush data to the flash when necessary.
Next we determine how large the file system buffer should be, by measuring the energy consumed for writing blocks of varying size to the SD card. Naturally, writing larger blocks increases both the energy and time required. We measured the current drawn (as before), time required, and battery volt-age to compute the energy (inµJ) expended per byte. We see from Figure 12 that larger block sizes are much more ef-ficient. Here we are limited by the small amount of RAM available on the MICAz platform—4KB. For LUSTER, we choose a 512-byte buffer as a reasonable trade-off between
0 75 150 225 300 32 64 128 256 512 1024 2048
Energy per Byte (uJ/B) Block size (bytes)
Figure 12. Energy (µJ per byte) consumed for writing increasing block sizes to flash.
15 18 21 24 32 64 128 256 512 1024 2048 Lifetime (days)
Buffer size (bytes) 32 Bps 64 Bps 128 Bps 256 Bps 512 Bps 1024 Bps
Figure 13. Lifetime in days of a storage node for increas-ing buffer sizes and data rates.
memory and energy consumption.
Storage nodes in LUSTER use two D-cell alkaline batter-ies that provide 20500mAHof power. The lifetime of a stor-age node is determined by (1) the rate of data to be written to flash, and (2) size of the buffer, as determined above. In our lifetime measurements, we assume that the writing applica-tion does not explicitly flush the buffer; rather, it is flushed automatically by the file system when the buffer fills.
Figure 13 shows the lifetime in days of a storage node as the data rate and buffer size increase, with sleep modes of LiteTDMA disabled. Small buffers require frequent flush-ing, which consumes power and limits the supportable data rate. Still, with only a 32-byte buffer a storage node can last over 15 days while writing 512 bytes per second. For larger buffers, such as the 512-byte buffer used in LUSTER, the cost of listening to the radio dominates, and lifetime con-verges to 23–24 days. This greatly exceeds the sample time supported by environmental scientists’ current light measur-ing equipment. To achieve longer lifetimes, dormant storage nodes can be added to the system that activate when others are exhausted.
Finally, the system lifetime requirement and buffer size together determine the number of sensor nodes a storage node can cover. However, the storage node’s throughput provides an upper limit. In LUSTER, sensor nodes gener-ate 81 bytes per second to be stored in flash. When each sensor data block is flushed after writing, the operation re-quires about 58ms, giving a maximum throughput of over onekbps, enough for a single storage node to cover 17 sen-sor nodes.
11.3
Deployment Experiences
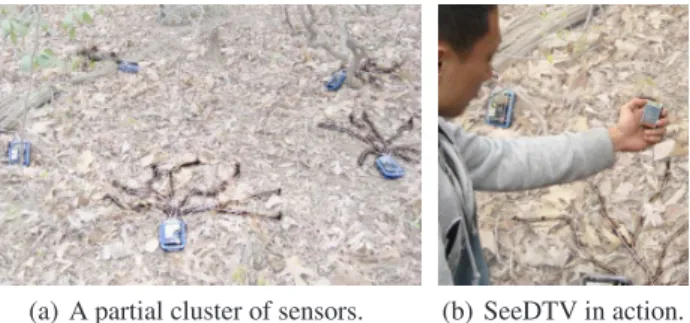
A test deployment of several sensor nodes in a forested environment is shown in Figure 14. A SeeMote with the SeeDTV software is shown in Figure 14(b) being used to monitor WSN communications and to query each individual
(a) A partial cluster of sensors. (b) SeeDTV in action. Figure 14. LUSTER test deployment (background light-ened to show sensor nodes).
0 200 400 600 800 1000 171819 20 21 22 23 0 1 2 3 4 5 6 7 8 9 10 11 12 13 14 15 16 17 Light intensity
Time of day (hour)
(a) Outdoors, a full day’s cycle of light intensity.
600 700 800 900 1000 0 10 20 30 40 50 0 10 Light intensity Time in minutes (b) Outdoors, nightfall with wind dynamics.
Figure 15. Light data for eight light channels, from an outdoor deployment location.
node’s health status. Using this technique we found that one of the nodes was not working as expected and had to replace it with a spare.
The plots in Figure 15 illustrate the data provided by a single node with eight light channels attached to it. In Fig-ure 15(a), a node has captFig-ured a whole day’s light-cycle at a time resolution of four measurements per second. It graphi-cally shows the obvious optimization of entering an extended sleep mode during the night hours.
Figure 15(b) shows detail of nightfall on a windy day. One can observe a rather dynamic light variation as the fo-liage moved in the strong air currents for the first 25 minutes of the plot. Then, as the sun went down, the wind calmed down resulting in smoother lines in the graph, and the light channels indicated rapid decrease in intensity. Notably, some of the sensors observed more rapid decline due to their indi-vidual locations, and fell into deeper shade before the others. Ecologists are interested in these spatial and temporal dy-namics due to their impact on the growth and expansion of grasses and other herbaceous species.
Sensor Localization by Excitation— Since LUSTER sup-ports multiple sensors per node, we must determine the lo-cation of each individual sensor. First, we manually placed
Figure 16. A method of sensor localization by sequential sensor excitation.
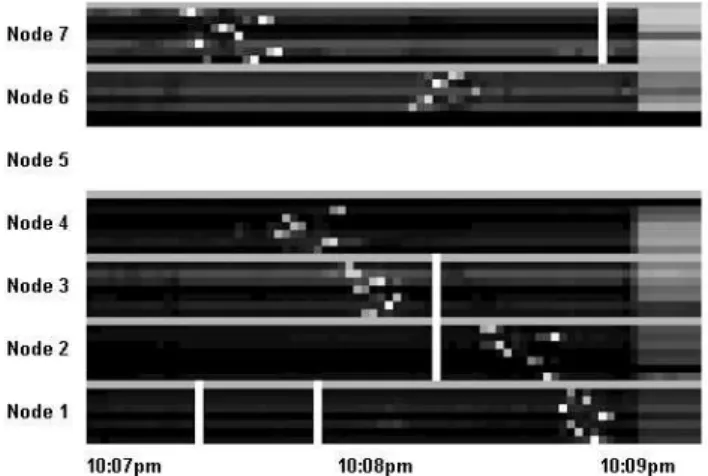
Figure 17. Excerpt of data captured over one day in April, showing 6–8am and 8pm for three nodes.
sensors in consultation with the environmental scientists, and precisely recorded their locations on a deployment map. We still needed to know which sensors were connected to which motes, so we took an approach similar to Spotlight [16]. Fol-lowing an arbitrary pattern determined by their locations on the map, we sequentially excited light sensors using a flash-light.
Figure 16 illustrates the resulting sensor excitations, which appears as clustered light dots against the otherwise dark sensor readings. Vertical white bars show lost packets, and are unrelated to this discussion.
Each light sensor was excited for about two seconds (with a one second sampling rate), and the readings were recorded by the system. Actual mote and sensor IDs were assigned to their locations using the known excitation pattern and the data clusters portrayed in Figure 16.
We noticed that four of the sensors were not excited, or at least not at a sufficient level. The sampling rate could have been increased, or the excitation duration lengthened to ensure that an unambiguous reading is recorded. However, in our case we found the problem to be a bad contact between the sensor and the board. This emphasizes the importance of deployment time validation, since we were able to replace the faulty sensors in the field and avoid data loss.
Deployment Time Validation— Figure 17 shows another deployment result. Data from 6am until 8pm (horizontal axis, excerpted) are plotted from three sensor nodes (vertical axis). Each node samples seven light sensors and the bat-tery level, which appear altogether as eight horizontal lines, as shown in the legend of Figure 17. Battery levels appear
25 24 26 23 22 SG 10 14 20 11 8 19 5 Cross Grid Uplink 15 Power BM 4 Branch 7 16 12 6 13 9 17 1 18 3
Figure 18. Layout and map of Hog Island deployment.
as a horizontal grey line with no temporal variation (since we had no power failures during this particular deployment). The color of the other seven lines shows the light sensors’ intensities.
The plot starts at the left side, at 6am. At 7am when revis-iting the site we detected with the SeeMote that Node 5 was not transmitting. Attempts to revive it did not succeed, as the plot shows. Therefore, we enabled another node, which joined the LiteTDMA network without interruptions and is shown on the plot as Node 7. The SeeDTV techniques en-abled us to detect this failure early in the deployment when we could easily rectify it.
Hog Island Deployment— Hog Island is a research site in the Virginia Coast Reserve (part of the Long Term Ecologi-cal Research Network [20]), located off the Eastern Shore of Virginia. A deployment to the barrier island is ongoing and data are still being collected and analyzed. Figure 18 shows the layout of the deployment area. Sensors are placed on the ground in a cross-shaped area with increasing distance from the center, on a regularly-spaced grid, and along a tree branch half-way to the canopy ceiling.
A Crossbow stargate acts as the gateway between the WSN and a 2km back-haul wifi link, only reachable via a high-gain directional antenna. The remote access point loses power at night, necessitating the use DTN techniques in LUSTER. A solar panel charges a 12V marine battery, which supplies power to the stargate. In total, there are 133 light sensors connected to 19 sensor nodes, with five storage nodes distributed throughout the deployment area.
While on-site, we found that four sensor nodes and one storage node did not respond to queries from the SeeDTV, possibly damaged in the hike to the area. Though we were unable to repair them in the field, the use of LUSTER’s DTV techniques alerted us to the failures early, so that we could deploy other sensors redundantly.
12
Conclusions
We have presented LUSTER—an environmental monitor-ing sensor network system that supports efficient communi-cation, reliable distributed storage, and tolerance of commu-nications delay. The system scales using multiple clusters, and is extensible with new types of sensors. Power sav-ings are achieved by a LiteTDMA MAC protocol and the transparent overlay storage network. Data loss is prevented by distributed and fault-tolerant storage, in which data from overlapping regions is stored in several nodes. Intermittent
and failing links are compensated by a delay-tolerant net-work design that transmits missed data on demand to the back-end server. In addition, data can be collected manually by removing the flash memory storage cards and replacing them with empty units.
In the immediate future we have several items on our agenda, including making the scalable deployment eas-ier through automated frequency assignment to LiteTDMA clusters, and implementing automatic interleaving of LiteT-DMA neighboring clusters. We also anticipate feedback from environmental scientists on directions for future im-provement from an eco-sciences point of view, and process-ing of long-term data from the Hog Island deployment.
Acknowledgments
The authors would like to thank the paper shepherd for his help in improving this manuscript. Work on LUSTER was supported in part by grants NSF 0614870, CNS-0614773, CNS-0626616 and CNS-0626632.
13
References
[1] G.-S. Ahn, S. G. Hong, E. Miluzzo, A. T. Campbell, and F. Cuomo. Funneling-MAC: a localized, sink-oriented MAC for boosting fidelity in sensor networks. InProc. of SenSys, pages 293–306, 2006.
[2] S. T. Brantley and D. R. Young. Leaf-area index and light attenuation in rapidly expanding shrub thickets. Ecology, 88(2):524–530, 2007.
[3] Crossbow Inc., Wireless Sensor Network Hardware, URL: http://www.xbow.com/Products/Wireless Sensor Networks.htm.
[4] P. Dutta, J. Hui, J. Jeong, S. Kim, C. Sharp, J. Taneja, G. Tolle, K. Whitehouse, and D. Culler. Trio: enabling sustainable and scalable outdoor wireless sensor net-work deployments. InProc. of IPSN, pages 407–415, 2006.
[5] M. Dyer, J. Beutel, T. Kalt, P. Oehen, L. Thiele, K. Mar-tin, and P. Blum. Deployment support network—a toolkit for the development of WSNs. In Proc. of EWSN, Delft, The Netherlands, 2007.
[6] Hy-Tech Cable Coat, Multifunctional Cable Coating HT 88, URL: http://hytechsales.com/prod88. html.
[7] P. Juang, H. Oki, Y. Wang, M. Martonosi, L. S. Peh, and D. Rubenstein. Energy-efficient computing for wildlife tracking: design tradeoffs and early experiences with zebranet. InProc. of ASPLOS-X, pages 96–107, 2002. [8] J. Li, Y. Bai, H. Ji, J. Ma, Y. Tian, and D. Qian. Power:
Planning and deployment platform for wireless sensor networks. InProc. of GCCW, pages 432–436, 2006. [9] H. Liu, L. Selavo, and J. A. Stankovic. SeeDTV:
Deployment-time validation for wireless sensor net-works. InProc. of EmNets, 2007.
[10] A. Mainwaring, D. Culler, J. Polastre, R. Szewczyk, and J. Anderson. Wireless sensor networks for habitat monitoring. InProc. of WSNA, pages 88–97, 2002.
[11] K. Martinez, J. K. Hart, and R. Ong. Environmental sensor networks.Computer, 37(8):50–56, 2004. [12] Pelican waterproof cases, URL: http://www.
pelican-case.com.
[13] J. Polastre, J. Hill, and D. Culler. Versatile low power media access for wireless sensor networks. InProc. of SenSys, pages 95–107, 2004.
[14] L. Selavo, G. Zhou, and J. Stankovic. SeeMote: In-situ visualization and logging device for wireless sen-sor networks. InProc. of BASENETS, 2006.
[15] K. Srinivasan, P. Dutta, A. Tavakoli, and P. Levis. Un-derstanding the causes of packet delivery success and failure in dense wireless sensor networks. InProc. of SenSys, pages 419–420, 2006.
[16] R. Stoleru, T. He, J. A. Stankovic, and D. Luebke. A high-accuracy, low-cost localization system for wire-less sensor networks. InProc. of SenSys, pages 13–26, 2005.
[17] R. Szewczyk, A. Mainwaring, J. Polastre, J. Anderson, and D. Culler. An analysis of a large scale habitat mon-itoring application. InProc. of SenSys, pages 214–226, 2004.
[18] R. Szewczyk, J. Polastre, A. M. Mainwaring, and D. E. Culler. Lessons from a sensor network expedition. In H. Karl, A. Willig, and A. Wolisz, editors,EWSN, vol-ume 2920 ofLecture Notes in Computer Science, pages 307–322. Springer, 2004.
[19] G. Tolle, J. Polastre, R. Szewczyk, D. Culler, N. Turner, K. Tu, S. Burgess, T. Dawson, P. Buonadonna, D. Gay, and W. Hong. A macroscope in the redwoods. InProc. of SenSys, pages 51–63, 2005.
[20] Virginia Coast Reserve—Long Term Ecological Re-search Network (LTER-VCR), URL: http://www. lternet.edu/sites/vcr/.
[21] M. Welsh, G. Werner-Allen, K. Lorincz, O. Marcillo, J. Johnson, M. Ruiz, and J. Lees. Sensor networks for high-resolution monitoring of volcanic activity. In Proc. of SOSP, pages 1–13, 2005.
[22] G. Werner-Allen, K. Lorincz, M. Welsh, O. Marcillo, J. Johnson, M. Ruiz, and J. Lees. Deploying a wireless sensor network on an active volcano. IEEE Internet Computing, 10(2):18–25, 2006.
[23] A. Wood, G. Virone, T. Doan, Q. Cao, L. Selavo, Y. Wu, L. Fang, Z. He, S. Lin, and J. Stankovic. ALARM-NET: Wireless sensor networks for assisted-living and residential monitoring. Technical Report CS-2006-11, Department of Computer Science, Uni-versity of Virginia, 2006.
[24] G. Zhou, T. He, S. Krishnamurthy, and J. A. Stankovic. Impact of radio irregularity on wireless sensor net-works. InProc. of MobiSys, pages 125–138, 2004.