Helena Galhardas, Francisco Castro, and Jo˜ao Damasio INESC-ID/Technical University of Lisbon and Link Consulting
Abstract. Nowadays, most companies handle large amounts of elec-tronic data. Those data are commonly assumed as correct. However, the reality has shown that this assumption is rarely true. The activity that aims at detecting data anomalies is calleddata quality audit (also known as data profiling). We propose a Data Quality Audit Methodol-ogy(DQAM) that aims at defining all the steps that must be followed in a data quality audit process as well as the actors involved, so that the expected results are obtained as fast as possible. We applied the DQAM to an excerpt of a database from a maritime entity, using Oracle data profiling tools as the technological support. We report the results obtained.
Key words: Data Quality, Data Problems, Data Quality Audit, Method-ology
1
Introduction
Today, most companies deal with a large amount of electronic data. The in-formation stored in their databases is vital for their business. These data are assumed to be of a very good quality, regardless the way they are obtained and processed. However, in most cases, the existing data are not correct, consistent, complete, nor updated. Recent studies have shown that between 50 to 80% of electronic criminal records in the U.S. were considered inaccurate (e.g., spelling mistakes in the address), incomplete (e.g., incomplete zip code - ‘2765-xxx’) or inconsistent (e.g, a person with a date of birth which does not correspond to the age -‘18/10/84’ and ‘15 years’) [23]. Between 1 and 10% of the tuples in organizations critical databases are estimated to be imprecise [13].
What type of problems can poor data quality cause to companies? In addi-tion to daily problems such as sending the same letter twice to a customer or
∗
making a payment to a wrong account, other problems may arise at the level of business analysis and strategy. Most companies currently use Business In-telligence systems to obtain information useful for business decisions from the data. Therefore, distortions in the data tend to produce conclusions that may be largely inaccurate, invalid or completely useless [24]. Studies show that the economic impact caused by data quality problems ascends to about 600 billion dollars annually only in the United States of America [8].
The activity that aims at detecting data anomalies is calleddata quality audit
(also known asdata profiling). The result of auditing one or more data sources is a set of informations about the data values, data structures, a report of the data quality problems encountered, and recommendations for the correction of these problems.
The diversity of data problems that may arise in data sets is large (e.g., syntax errors, missing values, duplicate records, etc). A data set with a significant size tends to have a large amount of data anomalies. Moreover, the identification of the data problems requires the interaction of domain and business specialists. Some data problems can be automatically determined, using statistical methods for example. Others (e.g., integrity constraints) require that a specialist explicitly specifies data error conditions. All these factors make a data quality audit process a complex task. For this reason, it is imperative to have a strategy for data quality audit that supports the following requirements:(i)identifies the specialists that must be contacted; (ii)understands the data domain and the business context;
(iii)detects the largest number of existing data quality problems; and(iv)avoids detecting the same error several times.
In this paper we propose aData Quality Audit Methodology (DQAM). Its purpose is to define all the steps that must be followed in a data quality audit process as well as the actors involved, so that the expected results are obtained as fast as possible. Up to our knowledge, the only methodology for data profiling has been proposed by [16]. However, it is not comprehensive since it does not indicate the sequence of steps to take, the experts to contact, nor the output it should produce.
The application of the methodology proposed to a given data set requires the use of the adequate technology. This technology is available in the form of the so calleddata profiling tools. According to the report presented by Gartner, the most relevant commercial data profiling tools are the following: Oracle 11g
Warehouse Builder and Data Integrator1, Microsoft SQL Server 2008 Integration
Services2, DataFlux dfPower Studio3, IBM InfoSphere Information Analyzer4, Informatica Data Explorer5, Business Objects Information Management 6, and
Trillium Software Data Profiling7.
We applied the DQAM to an excerpt of a database from a maritime en-tity, using Oracle data profiling tools as the technological support. We report the results obtained with respect to the results obtained with the methodology proposed by [16].
This paper is organized as follows. Section 2 presents the main concepts re-quired to understanding the subsequent sections. Section 3 presents the method-ology developed to overcome problems of the existing methodmethod-ology. Section 4 describes the application of the proposed methodology in the case study of a maritime entity. Section 5 presents the results obtained with the application of the proposed methodology. Finally, Section 6 presents the main conclusions and future work.
2
Concepts
This section aims at summarizing the main concepts related to data qaulity audit.
2.1 Data quality
The activity ofdata quality has been a subject of research in recent years. With the explosion of electronic data, computer science has been working on this issue. In general, when the data quality term is mentioned, the tendency is to refer only to datacorrection oraccuracy. For example, taking into consideration that the name ’Andreia’ is mentioned in a telephone conversation, it may sound like ’Andrea’, which is an accuracy or correction error.
However, more characteristics are needed to consider a certain data as cor-rect. The characteristics that define data quality are known in this area of
1http://www.oracle.com 2 http://www.microsoft.com 3http://www.dataflux.com 4 http://www.ibm.com 5http://www.informatica.com 6 http://www.businessobjects.com 7 http://www.trilliumsoftware.com
study as data quality dimensions. Several dimensions have been proposed [2, 18, 26, 20, 4]. Although several authors have considered different dimensions, four are almost unanimously mentioned, namely accuracy or correction, consis-tency, completeness and currency.Accuracyorcorrectionevaluates the existence of erroneous values. There are two types of accuracy considered: syntactic and
semantic [2]. The syntactic accuracy corresponds to the writing correction or adequacy of the value to the data domain. Semantics accuracy corresponds to the appropriate relationship between the real world and the value in question.
Consistency implies that two or more values are not in conflict with each other [18].Completeness evaluates the existence of all data needed for the use in ques-tion. Assessment of completeness depends mostly on the field and the data that are taken into account. Finally,currency evaluates the age of data, i.e. whether they are regularly updated, if they are updated, etc.
2.2 Data quality metrics
The main metrics used to measure data quality are: simple ratio, min or max operations, and weighted average [18]. The application of a metric to a specific case is known as an indicator. A metric can lead to several indicators. For ex-ample, for the completeness dimension, a distinct indicator can be created for each of the columns: simple ratio of the attribute ’age’ and simple ratio of the attribute ’date of birth’.
Simple ratiois obtained by using the formula:SR= 1−errors
total , whereerrors correspond to the number of errors of the particular case andtotalindicates the total number of data of the particular case. This results in the quantification of the percentage of errors across the existing population. For example, we can assess the completeness of a column by the ratio of the number of nullvalues in that particular column and the total number of tuples, subtracted from 1. This metric allows the definition of different indicators relevant to each of the dimensions.
Themin or max operation is applied when there are several indicators for a given dimension (e.g., existence of an indicator of completeness of the ‘age’ column and another of the ’date of birth’ column). This operation consists in selecting the maximum or minimum value for all indicators leading to the se-lection of the final value to be applied to a given dimension. Weighted average
case, when the importance of each indicator is known, a weight is assigned to each of those indicators and a weighted average is calculated.
2.3 Data quality problems
One of the most important issues in data quality is the classification of problems that can be found in the data. This classification is usually called ataxonomy. A good taxonomy of data quality problems should include all data problems likely to occur in order to effectively support its identification. We have adopted the taxonomy defined in [15] because it was considered as the most complete to tackle the problems in question. Other taxonomies are proposed in [19, 12, 14]. In the taxonomy adopted, data quality problems are grouped in four types according to the granularity in which they arise: the attribute level, the tuple level, the relation level, and the multiple relations/data sources level.
Seven types of errors are considered at the attribute level. Errors related withmissing data correspond to the absence of data in a mandatory attribute.
Syntax errors occur when a data value does not respect the syntax defined for the attribute. Spelling errors are related to the data that contain one or more spelling mistakes. Range errors occur when a data value does not belong to the set of valid values.Existence of synonyms occurs when an attribute can be assigned different values but with the same meaning. Uniqueness errors occur when an attribute that requires unique values is assigned the same value in more than one tuple.Integrity constraint violationoccur when a constraint restriction defined for an attribute is not respected.
The errors that may occur attuple level are related only with theintegrity constraint violation, i.e., when a constraint imposed on the tuple values is not checked. At the relation level, five errors are taken into consideration. Various data representationscorrespond to several ways of representing the same reality.
Functional dependency violation occurs when a functional dependency involving two or more attributes is violated by the data of one or more tuples. Circular-ity between tuples in a self-relationship corresponds to the existence of a cycle between two or more tuples of a relation in which there is a self-relationship (i.e., an entity is related to itself). Duplicate tuples occur when two or more tuples represent the same real world entity. Finally, an integrity constraint vi-olation occurs when an integrity constraint involving multiple attributes is not respected.
Atmultiple relations or data sources level, typical data errors are:referential integrity violation, existence of synonyms or homonyms, duplicate tuples and
integrity constraint violation.
2.4 Techniques used in data quality audit
The detailed study of the steps involved in a data quality audit process requires an understanding of the techniques applied at each stage. This section overviews the most important techniques and algorithms within the data quality audit framework, namely the use of word dictionaries, algorithms for identifying func-tional dependencies, algorithms for duplicate detection, techniques for detecting outliers, and identification of circularities.
The use ofword dictionaries involves the comparison of attribute values with one or more words from a dictionary. With this technique, it is easy to identify if the data values belong to an acceptable domain. It does not, however, guarantee that the data is correct.
The algorithms for identifying functional dependencies discover attributes that determine the value of other attributes (e.g., the zip code defines the area). There are two possible scenarios for the use of these kind of algorithms. The first scenario comprises the identification ofapproximate functional dependencies
which exist in the most part of the tuples. Approximate functional dependen-cies usually occur when there is a natural dependency between some attributes, and errors in some tuples are exceptions to the dependency. When approximate functional dependencies are identified, this usually corresponds to a violation of functional dependencies. The second scenario is the identification of functional dependencies for structure inference. When a set of attributes defines all the others through a functional dependency, this set of attributes is acandidate key. The minimum candidate key (with a smaller number of fields) is theprimary key
of a given table. There are several algorithms for the identification of functional dependencies that can be consulted [21, 3].
Algorithms for duplicate detection help in identifying if the same entity is represented several times in the same relation. There are two distinct strategies for the identification of duplicates. The first one is known asexact or determinis-tic. One or several attributes of the relation are used to identify unambiguously the existing duplicates (e.g., the ID card number). The second strategy to iden-tify duplicate records is known as approximate. It is applied when there is no attribute that can be used in the identification of duplicates or, even if this
attribute exists, its values may be affected by data quality problems [25]. There-fore, it is not possible to detect duplicates through an equality operation, as a
natural join, over the values of a given attribute. In this case, the identification of approximate duplicates should be carried out by techniques that are based on the comparison of various fields, for each pair of records, namely, character-based techniques [9],token-based techniques,phonetic approximation techniques
andnumerical approximation techniques.
Thetechniques for the identification of outliers enable the identification of anomalies in the data. The identification of anomalies is related with the problem of finding data patterns that do not match with the expected behaviour. These non-expected patterns are often referred to as anomalies, outliers, exceptions, etc [6]. These anomalies correspond, up to a certain extent, to data quality problems. Relevant work on data mining techniques for identifying outliers can be found in [6, 10, 1, 17].
Thedetection of circularitiesconcerns the identification of circularities within a relation that models a self-relationship. For example, if product A is part of product B and vice versa, then there is a circularity between two tuples. A circularity can be considered as a strong link in a directed graph. There is a strong link when in a graph, starting from A it is possible to reach B and B can reach A. As it can be inferred by the definition, the concept of circularity corresponds to a strong link. The discovery of strong links in cyclic graphs has been widely studied by several authors as [22] and [7]. Strong link discovery algorithms are based on depth search algorithms.
3
Data quality audit methodology
In order to have a understandable and easily to apply data quality audit method-ology, it must meet certain requirements, such as defining the actions to identify the data quality problems, the players to be contacted at a given time, and the input and output objects of each methodology action. TheData Quality Audit Methodology (DQAM) we propose meets these requirements and tries to over-come the problems encountered in the existing methodology [16]. DQAM is based on the Rational Unified Process methodology [11] because this methodology has the detail level necessary to meet the previously defined requirements.
The primary elements/features to be set out are: actors, inputs, outputs,
workflows, activities and templates of output objects. The actors model the roles to be performed by one or more people. An actor does not play the role of
a specific person, but a particular aspect. Thus, a given person can play multiple roles or multiple people can play the same role. Inputs are the objects (data, metadata or documents) that provide information to a particular activity and may be changed or consumed by the latter. Thus, an activity can modify or even remove the object. The outputs are objects that receive information from a particular activity or are created by them. The workflows are diagrams that define the sequence of activities to be performed. It is also possible to observe the inputs, outputs and actors of each activity. Activities are tasks that must be carried out. Each activity can have inputs and outputs and be simple or compound. In the latter case, it should be described by a workflow. Thetemplates
of outputs define formats of a given document produced by an activity. These pre-formatted documents enable whoever applies the methodology, to be guided and to know exactly what should be included in the document.
3.1 Actors
There are four key actors in the data quality audit process: data quality analyst, database administrator, business specialist and end user. Thedata quality analyst
is responsible for performing the data quality audit. He/she should have database and data quality skills and be able to identify and report any problems related with data quality. The database administrator is responsible for maintaining the database to be audited and must be familiar with the data structure. The
business specialistis an expert of the business supported by the database. He/she should be acquainted with the business procedures and the standards followed. The end user uses applications that interact with the data, in particular data entry, which is the main activity responsible for creating data quality problems.
3.2 Inputs and outputs
The following three types of input of a data quality audit process are defined:
– Database(s) to be audited- known asdata repositories. Only relational databases have been considered so far;
– Metadata repository (ies)-Metadatais the set of data (structure or content) about the data.The sources of metadata belong to the two following kinds. First, the database catalog that stores information about the data structure. Second, external documents such as text documents, graphic documents with data models, or documents produced as the result of data quality audits;
– Dictionaries - A dictionary is a comprehensive set of words or synonyms. A dictionary of words is a compilation of words, proper terms or words of a language, almost always arranged in alphabetical order. A dictionary of synonyms is similar to the dictionary of words. However, it defines the meaning of words through equivalences or affinities with other words. The following three kinds of output documents produced by a data quality audit process are defined:
– The interim relation report is the first quality assessment of a database relation. It is used to inform those interested about the audit evolution. This interim report includes metadata about the relation attributes, the structure of each relation under analysis, and the data quality problems identified at the level of each relation.
– Thefinal technical reportincludes metadata about all the database relations, the data quality problems identified in each one, and information about the consistency between several relations (e.g., integrity constraints involving more than one relation and referential integrity). This report is supposed to be analyzed by thedatabase administrator. Therefore, it should contain all the technical information necessary for the identification of data quality problems and recommendations for corrections. This document includes the information present in the interim relation reports of the evaluated tables.
– Thefinal qualitative report is to be analyzed by decision-makers, thus it will contain less technical detail. The results are presented in an aggregated way, focusing on overall metrics (see Section 2.2) about the data quality (e.g.: simple correction ratio). This report also includes a qualitative assessment of the impact of data quality problems on the business.
3.3 Workflows, activities, and templates of output documents
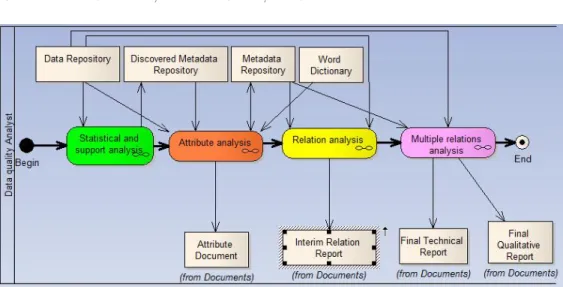
The data quality audit process is divided into several activities, which in their turn, are divided into other sub-activities. In this paper, we only discuss the second level activities represented in Figure 1. The description of all the levels of the DQAM can be found in [5]. The data quality audit process comprises one activity for metadata identification that serves as the basis to the remaining activities.
The first activity -Statistical and support analysis- is the activity responsible for the creation of the metadata serving as the basis of the attributes analysis
Fig. 1.DQAM second level activities
activity. The input of this activity is the data repository. The data repository (or database) serves as input for the remaining activities since it has to be consulted to detect any data quality problem. The information generated in the statistical and support analysis activity is stored in an object called discovered metadata repository.
The second activity -attribute analysis - is the activity that evaluates each of the attributes of each database relation. It identifies the existing data quality problems at attribute level and checks the types of data used. The inputs of this activity are: thedata repository, themetadata repository, thediscovered metadata repositoryand aword dictionary. This activity updates one output,the metadata repository and creates another one, the attribute document. The information generated in this activity can produce new metadata or update the existing metadata. All the information generated in this activity, including metadata and identified data quality problems, should be mentioned in theattribute document. Although this document is not one of the MAQD outputs, its contents is included in theinterim relation report.
It is important to distinguish between themetadata repository and the dis-covered metadata repository. The metadata repository is the set of information about data existing in the database catalog or development documentation. The
discovered metadata repository comprises a set of statistics and facts about data discovered during the data quality audit process. For example, if for a given at-tribute of numerical value, the max and min values are determined , then these
two facts belong to the discovered metadata repository. Often, the discovered metadata repository leads to the discovery of facts that were not represented in the metadata repository.
The third activity - relation analysis - is the activity that evaluates each of the assessed database relations. It identifies possible data quality problems at the relation level. The inputs of this activity are: the data repository and the metadata repository. All the information produced in this activity, namely the data quality problems detected, should be included in the interim relation report.
The last activity -multiple relations analysis - is responsible for identifying data quality problems at the level of multiple relations. It is also responsible for generating the final qualitative report and the final technical report. The inputs of this activity are: the data repository and the metadata repository. All the information generated in this activity, namely the identified data quality prob-lems, should be included in thefinal technical report and in thefinal qualitative report.
4
Implementation
This section presents the tools adopted or developed for the implementation of the Data Quality Audit Methodology (DQAM), proposed in Section 3. The DQAM activities were materialized by the following software packages: Oracle Warehouse Builder, Oracle Data Integrator and Oracle Developer. These tools were selected because of the well placed classification in the evaluation of these tools. Since some of the existing data quality problems are not identified by these tools, the following applications had to be written with the Java language: identification of circularities, spelling mistakes and synonyms.
The identification of spelling mistakes was developed using theJazzy library1
that enables the comparison between a word dictionary and a string. The dictio-nary used comprises a listing of Portuguese words, made available by the Univer-sity of Minho2. The package that performs the identification of synonyms uses the open source synonym dictionary calledOpenThesaurusPT3. The package for
1
Jazzy. The Java Open Source Spell Checker, http://jazzy.sourceforge.net
2Wordlist. March 9th 2009, http://natura.di.uminho.pt/download/sources/Dictionaries/misc/wordlist/ 3
OpenThesaurusPT is an open source project to build a synonym dictionary for Portuguese, http://openthesaurus.caixamagica.pt/
identifying circularities uses the JgraphT4 library that enables the creation of
graphs and the identification of strong links in directed graphs.
5
Experimental results
We applied the DQAM to assess the data quality of an excerpt of a real-world database. The database stores information about a Portuguese maritime entity. The excerpt analyzed consists of the four main tables, according to the business experts. The purpose of this experiment was two-fold. First, we wanted to apply it to a database and then validate the results obtained with business experts. Second, we wanted to compare the number of data quality problems detected with the DQAM with the number of data quality problems identified by the data profiling methodology proposed by [16]. This experimentation aims at showing a proof-of-concept for the proposed methodology. Further applications of the methodology to different and larger databases are required.
The values of the quality dimensions computed by the application of the methodology are presented in Figure 2 . These values show that the complete-ness dimension is the most affected. Indeed, only 41,33 % of the relation at-tributes have a value assigned. The correction and currency dimensions have almost 100%. Consistency problems affect around 4% of the data.
Fig. 2.. Data Quality Audit Final Results
DQAM (Olsen2003) Errors 252332 234831
Table 1. Comparison of the number of errors identified in the methodologies
Table 1 shows the comparison of overall results, e.g the sum of all types of errors detected by both methodologies. By analysing the table, we conclude
4
that the DQAM has identified a larger number of data quality problems, cor-responding to an increase of about 7.5%. The extra errors identified by DQAM correspond to the data quality problems that are not considered by the existing methodology, namely synonym errors (117 errors), spelling (15738 errors), and duplicate tuples (1646 errors) . This result shows that the DQAM promises to increase the effectiveness of a data quality audit. In fact, it considers the identfi-cation of additional data quality problems, whose occurrence rate is significative.
6
Conclusions
Data quality is often inaccurate, incomplete, inconsistent or outdated. However, the extent of these problems and the way they affect the use of data is very often unknown. The proposed data quality audit methodology can measure the extent to which these problems occur in a particular database and the impact resulting from the identified errors.
We applied the proposed data quality methodology to a case study. The methodology presented is able to identify a bigger number of data quality prob-lems than the existing methodology [16]. The identification of a bigger number of data quality problems results in an increase by 7,5%, corresponding to data errors that were not considered by the existing methodology, namely spelling mistakes, synonyms, circularities in a self-relationship and duplicate tuples.
Further work involves a better validation of the DQAM. First, the method-ology must be applied to a larger number of tables and to different databases. Second, the advantage that this methodology brings in terms of the time required to perform the data quality audit must be measured. In order to achieve this, the time taken for assessing the quality of a database using the two methodologies should be measured. Furthermore, we plan to measure how easy it is to perform the activities that constitute the auditing process, in both methodologies.
References
[1] Malik Agyemang, Ken Barker, and Rada Alhajj. A comprehensive survey of numeric and symbolic outlier mining techniques.Intelligent Data Analysis, 10:521–538, 2006.
[2] Paola Bertolazzi, Maria Grazia Fugini, Massimo Mecella, Barbara Pernici, Pierluigi Plebani, and Monica Scannapieco. Supporting trusted data
ex-changes in cooperative information systems. Technical report, Universit`a di Roma, 2001.
[3] Dina Bitton, Jeffrey Millman, and Solveig Torgersen. A feasibility and performance study of dependency inference. In Proceedings of the Fifth International Conference on Data Engineering, 1989.
[4] Matthew Bovee, Rajendra P. Srivastava, and Brenda Mak. A conceptual framework and belief-function approach to assessing overall information quality. International Journal of Intelligent Systems, 18:51–74, 2003. [5] Francisco Castro. Auditoria da qualidade de dados da base de dados de
uma entidade maritima (in portuguese). Master’s thesis, Instituto Superior T´ecnico, Technical Unversity of Lisbon, 2009.
[6] Varun Chandola, Arindam Banerjee, and Vipin Kumar. Anomaly detection: A survey. Technical report, University of Minnesota, 2007.
[7] Thomas H. Cormen, Charles E. Leiserson, Ronald L. Rivest, and Clifford Stein. Introduction to Algorithms. The MIT Press, 2001.
[8] Wayne Eckerson. Data quality and the bottom line: Achieving business sucess through a commitment to high quality data. Technical report, TDWI, 2002.
[9] A.K. Elmagarmid, P.G. Ipeirotis, and V.S. Verykios. Duplicate record de-tection: A survey.IEEE Transactions on Knowledge and Data Engineering, 19:1–16, 2007.
[10] Victoria Hodge and Jim Austin. A survey of outlier detection methodolo-gies. Artificial Intelligence Review, 22:85–126, 2004.
[11] IBM. Rational unified process - best practices for software development teams. White papper, November 2001.
[12] Won Kim, Byoung-Ju Choi, Eui-Kyeong Hong, Soo-Kyung Kim, and Do-heon Lee. A taxonomy of dirty data.Data Mining and Knowledge Discovery, 7:81–99, 2003.
[13] Barbara D. Klein. Data quality in the practice of consumer product man-agement: Evidence from the field. InData Quality Journal, volume 4, 1998. [14] Heiko M¨uller and Johann-Christoph Freytag. Problems, methods, and challenges in comprehensive data cleansing. Technical report, Humboldt-Universit¨at zu Berlin zu Berlin, 2003.
[15] Paulo Oliveira. Detec¸c˜ao e correc¸c˜ao de problemas de qualidade de dados: Modelo, Sintaxe e Semˆantica (in portuguese). PhD thesis, Universidade do Minho, 2009.
[16] Jack E. Olsen. Data Quality: The accuracy dimension. Morgan Kaufmann Publishers, 2003.
[17] Animesh Patcha and Jung-Min Park. An overview of anomaly detection techniques: Existing solutions and latest technological trends.The Interna-tional Journal of Computer and Telecommunications Networking, 51:3448– 3470, 2007.
[18] Leo L. Pipino, Yang W. Lee, and Richard Y. Wang. Data quality assessment.
Communications of the ACM, 45(4):211–218, Abril 2002.
[19] Erhard Rahm and Hong Hai Do. Data cleaning: Problems and current ap-proaches. Bulletin of the Technical Committe on Data Engineering, Special Issue on Data Cleaning, 23:3–13, 2000.
[20] Thomas C. Redman. Data Quality for the Information Age. Artech House, Inc, 1997.
[21] Iztok Savnik and Peter A. Flach. Bottom-up induction of functional de-pendencies from relations. In Proceedings of the AAAI’93 Workshop on Knowledge Discovery in Databases, 1993.
[22] Robert Sedgewick. Algorithms in C. Addison-Wesley Professional, 2001. [23] Diane M. Strong, Yang W. Lee, and Richard Y. Wang. Data quality in
context. Communications of the ACM, 40:103–110, 1997.
[24] Richard D. De Veaux and David J. Hand. How to lie with bad data. Sta-tistical Science, 20:231–238, 2005.
[25] V. S. Verykios, G. V. Moustakides, and M. G. Elfeky. A bayesian decision model for cost optimal record matching. The VLDB Journal, The Interna-tional Journal on Very Large Data Bases, 12:28–40, 2003.
[26] Yair Wand and Richard Y. Wang. Anchoring data quality dimensions in ontological foundations. Communications of the ACM, 39:86–95, 1996.