RESEARCH PAPER SERIES, 2014–15 8 SEPTEMBER 2014
Federal election 2013
Stephen Barber
Statistics and Mapping Section
Executive summary
•
this paper provides a comprehensive set of statistical tables regarding the 2013 Federal election held on
Saturday 7 September 2013 and the half-Senate re-election in Western Australia held on Saturday 5 April
2014
•
the tables contain: national, state and regional summaries; electoral division details; two-party preferred
figures; and party strengths in the respective houses of the Parliament
•
there are also three appendices which summarise: the classifications of each electoral division that are used
in the paper; figures for House of Representatives and Senate elections held from 1901; and summary results
for the 2013 voided half-Senate election in Western Australia.
Contents
Executive summary ... 1
Introduction ... 3
Symbols and abbreviations ... 4
Table 1: House of Representatives: National summary ... 6
Table 2: House of Representatives: State summary ... 7
Table 3: House of Representatives: Regional summary ... 13
Table 4: House of Representatives: Party status summary ... 15
Table 5: House of Representatives: Socio-economic status summary ... 21
Table 6a: House of Representatives: Electoral division summary (number) ... 23
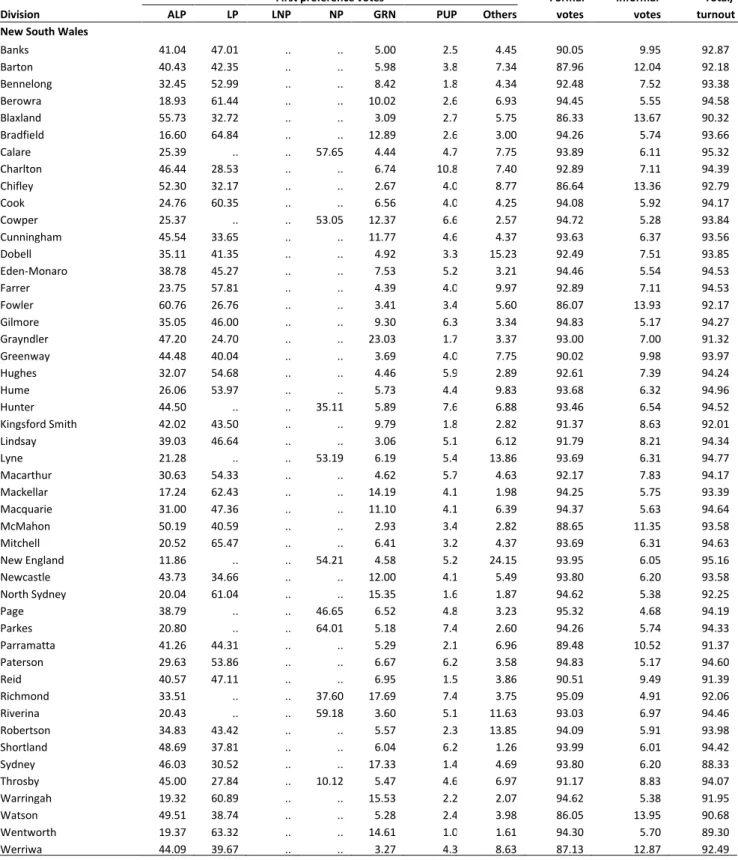
Table 6b: House of Representatives: Electoral division summary (per cent) ... 27
Table 7: House of Representatives: Electoral division detail ... 31
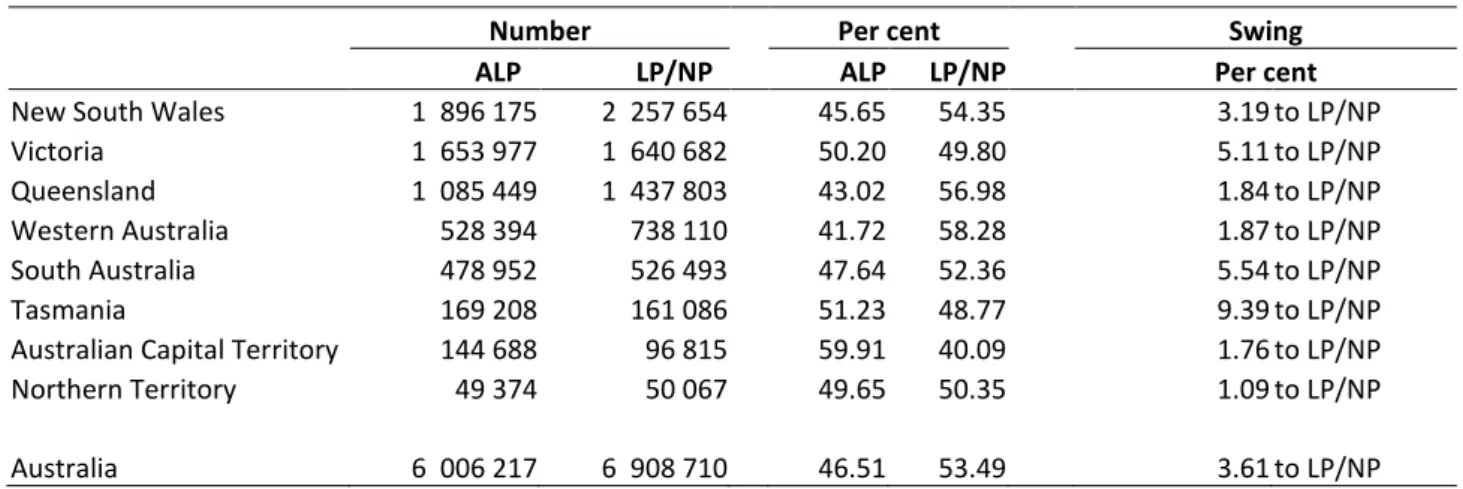
Table 8: House of Representatives: Two-party preferred vote: State summary ... 69
Table 9: House of Representatives: Two-party preferred vote: Regional summary ... 69
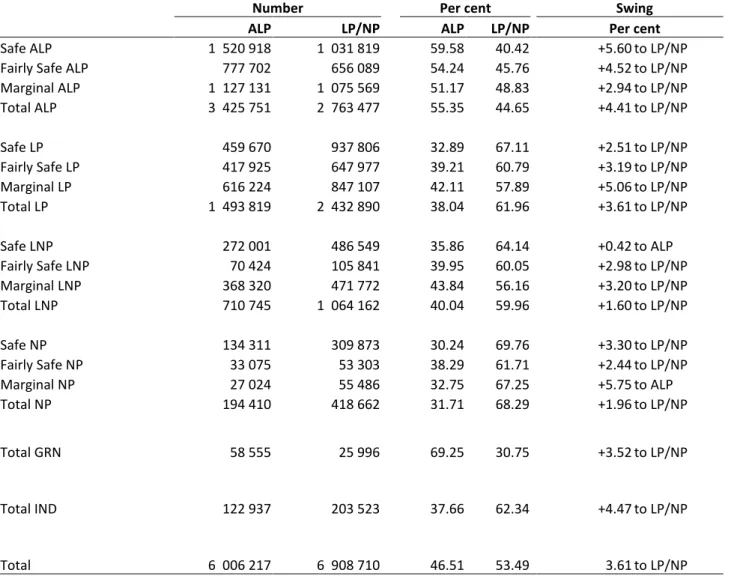
Table 10: House of Representatives: Two-party preferred vote: Party status summary ... 70
Table 11: House of Representatives: Two-party preferred vote: Socio-economic status
summary ... 70
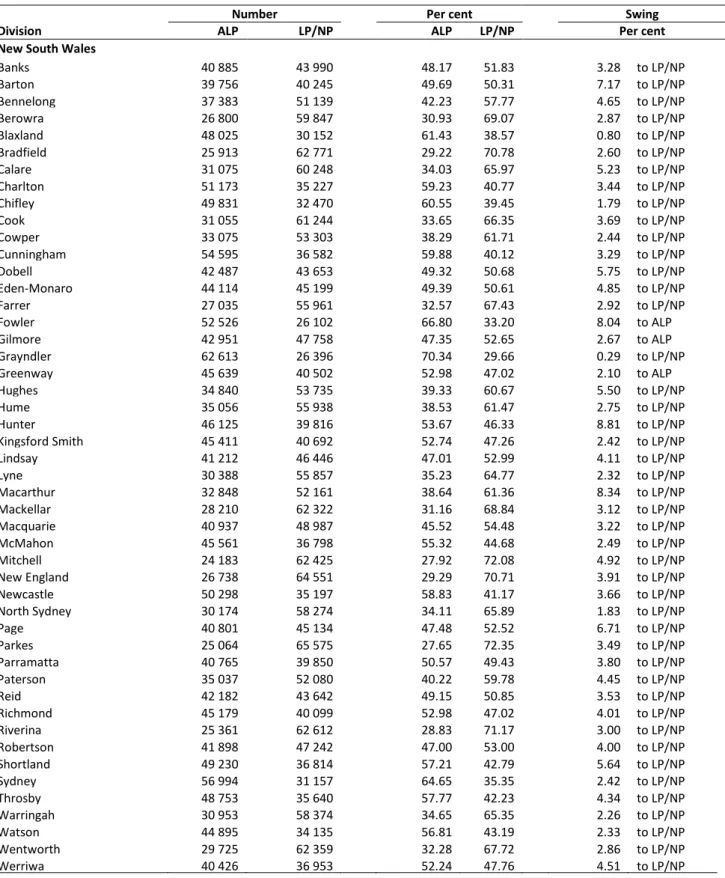
Table 14: House of Representatives: Electoral divisions ranked by two-party preferred
swing to LP/NP ... 76
Table 15: Senate: National summary ... 77
Table 16: Senate: State summary ... 78
Table 17: Senate: Composition from 1 July 2014 ... 85
Table 18: Senate: Candidate details ... 86
Table 19: Comparison of House of Representatives and Senate votes by division ... 117
Appendix 1: Electoral division classification ... 122
Appendix 2a: House of Representatives: Elections 1901–2013 ... 127
Appendix 2b: Senate: Elections 1901–2013 ... 129
Appendix 3a: Western Australia: Voided Senate Election 2013: Summary ... 131
Introduction
This paper contains the results of the House of Representatives election held on 7 September 2013 and the
half-Senate elections held on 7 September 2013 (all states and territories except Western Australia) and 5 April 2014
(Western Australia).
1There are summary tables for both the House of Representatives (Table 1) and the Senate
(Table 15) together with details for each House of Representatives electoral division (Table 7).
The regional and party status classifications used in the paper are the same as those used by the Australian
Electoral Commission.
2Party status and safeness of seats are determined by the two-party preferred vote at the
2010 election adjusted for the effects of the 2010 redistribution in Victoria and the 2011 redistribution in South
Australia.
3The ‘safeness’ of an electoral division (see Appendix 1) is determined by the size of the swing required for the
division to be lost by the party holding the division. A
marginal
division requires a swing of less than six per cent,
a
fairly safe
division requires a swing of six per cent to ten per cent and a
safe
division requires a swing of over
ten per cent.
In all tables, first preference votes are expressed as a percentage of formal votes, formal and informal votes are
expressed as a percentage of total votes, and total votes are expressed as a percentage of electors enrolled. In
the detailed electoral division tables the swing percentages for the candidates will not necessarily sum to zero
because of the different range of candidates at the 2013 election compared with the 2010 election.
To complete the 2013 election, party and candidate results for the voided half-Senate election in Western
Australia have been included at the end of the paper in Appendices 3(a) and 3(b).
Summary results of all Federal elections from 1901 are shown in Appendices 2(a) and 2(b) but more detailed
information can be found in S Barber and S Johnson,
Federal election results 1901–2014
,
Research paper
, 17 July
2014, Parliamentary Library, Canberra, 2014–15.
The numbers in this paper are derived from Australian Electoral Commission (AEC) data which have been
provided to the Parliamentary Library by the AEC.
1. Due to the closeness of the 2013 results for the final two seats in the WA Senate election a recount was carried out. However, prior to the recount, 1370 votes were lost and the recount produced a different result for the final two seats. The Court of Disputed Returns voided the WA outcome and a new Senate election was held in WA in 2014.
Symbols and abbreviations
AFLP
Australian Fishing and Lifestyle Party
AFN
Australia First Party
AIN
Australian Independents
AJP
Animal Justice Party
ALP
Australian Labor Party
AMEP
Australian Motoring Enthusiast Party
APP
Australian Protectionist Party
ASP
Shooters and Fishers Party
ASXP
Australian Sex Party
AUC
Australian Christians
BAP
Building Australia Party
BRP
Bank Reform Party (changed name to Mutual Party in 2014 Senate re-election in WA)
BTA
Bullet Train For Australia
CA
Carers Alliance
CDP
Christian Democratic Party (Fred Nile Group)
CEC
Citizens Electoral Council of Australia
CLP
Country Liberals (NT)
CYA
Country Alliance
DEM
Australian Democrats
DLP
Democratic Labour Party (DLP)
DRF
Drug Law Reform Australia
FFP
Family First Party
FNPP
Australia's First Nations Political Party
FUT
Future Party
GRN
Australian Greens
HMP
Help End Marijuana Prohibition (HEMP) Party
IND
Independent
KAP
Katter's Australian Party
LDP
Liberal Democratic Party
LNP
Liberal National Party of Queensland
LP
Liberal Party
LP/NP
LP/LNP/NP/CLP Coalition
NCP
Non-Custodial Parents Party (Equal Parenting)
NP
The Nationals
ODR
Outdoor Recreation Party (Stop The Greens)
ON
One Nation
PIR
Pirate Party Australia
PUP
Palmer United Party
RPA
Republican Party of Australia
RUA
Rise Up Australia Party
SAL
Socialist Alliance
SCSG
Stop CSG Party
SEP
Socialist Equality Party
SMK
Smokers Rights Party
SOL
Senator Online (Internet Voting Bills/Issues)
SPA
Secular Party of Australia
Symbols and abbreviations
continued
SPRT
Australian Sports Party
TCS
No Carbon Tax Climate Sceptics (changed name to Freedom and Prosperity Party in
2014 Senate re-election in WA)
UNP
Uniting Australia Party
VCE
Australian Voice Party
VEP
Voluntary Euthanasia Party
WKP
The Wikileaks Party
XEN
Nick Xenophon Group
Also (from Appendix 2)
A-S
Anti-Socialist
CP
Country Party
FT
Free Trade
NAT
Nationalist Party
ON
One Nation (Pauline Hanson's One Nation before 2007 election)
PROT
Protectionists
UAP
United Australia Party
..
nil or rounded to zero
*
sitting member for division
#
party holding division (where sitting member did not stand) or notionally holding
division (where redistribution of division notionally changed previous election
outcome)
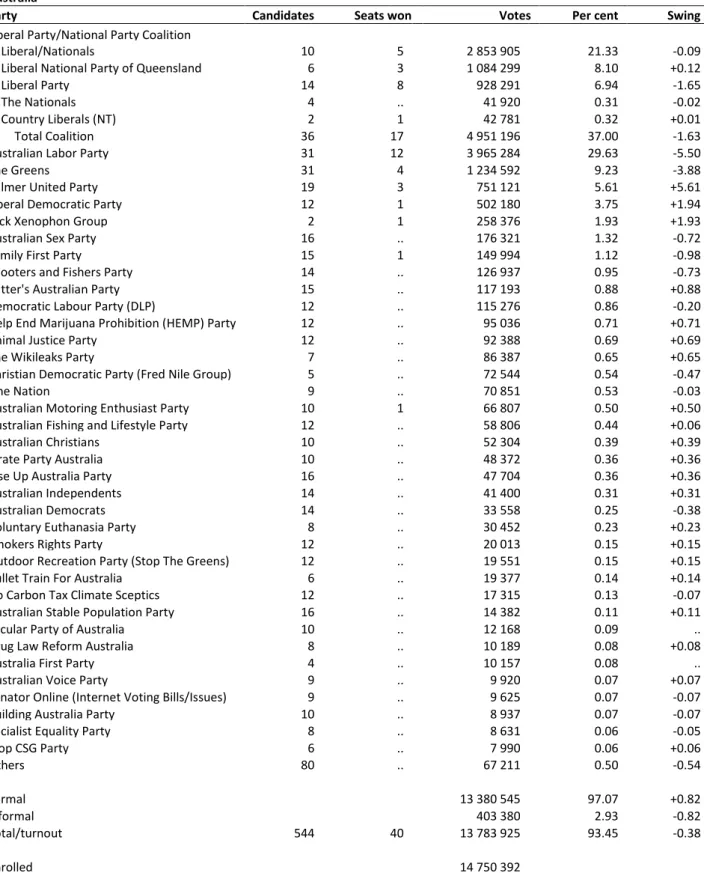
Table 1: House of Representatives: National summary
Australia
Party Candidates Seats won Votes Per cent Swing
Liberal Party/National Party Coalition
Liberal Party 108 58 4 134 865 32.02 +1.56
Liberal National Party of Queensland 30 22 1 152 217 8.92 -0.20
The Nationals 20 9 554 268 4.29 +0.56
Country Liberals (NT) 2 1 41 468 0.32 +0.01
Total Coalition 160 90 5 882 818 45.55 +1.94
Australian Labor Party 150 55 4 311 365 33.38 -4.61
The Greens 150 1 1 116 918 8.65 -3.11
Palmer United Party 150 1 709 035 5.49 +5.49
Family First Party 93 .. 181 820 1.41 -0.84
Katter's Australian Party 63 1 134 226 1.04 +0.73
Independents 68 2 177 217 1.37 -0.84
Christian Democratic Party (Fred Nile Group) 48 .. 88 576 0.69 +0.02
Australian Sex Party 36 .. 78 571 0.61 +0.52
Rise Up Australia Party 77 .. 48 582 0.38 +0.38
Australian Christians 31 .. 42 498 0.33 +0.33
Democratic Labour Party (DLP) 33 .. 36 086 0.28 +0.24
One Nation 15 .. 22 046 0.17 -0.05
Bullet Train For Australia 12 .. 19 801 0.15 +0.15
Citizens Electoral Council of Australia 24 .. 10 400 0.08 +0.02
Australia First Party 10 .. 7 412 0.06 +0.03
Socialist Alliance 7 .. 5 032 0.04 -0.04
Secular Party of Australia 9 .. 4 834 0.04 -0.06
Liberal Democratic Party 1 .. 4 716 0.04 -0.16
Country Alliance 8 .. 4 708 0.04 +0.04
Australian Independents 6 .. 4 163 0.03 +0.03
Australian Stable Population Party 10 .. 3 954 0.03 +0.03
Australian Democrats 3 .. 3 614 0.03 -0.15
Animal Justice Party 2 .. 1 878 0.02 +0.01
Australia's First Nations Political Party 2 .. 1 810 0.01 +0.01
Australian Voice Party 4 .. 1 681 0.01 +0.01
Non-Custodial Parents Party (Equal Parenting) 3 .. 1 547 0.01 -0.01
Australian Sports Party 1 .. 1 324 0.01 +0.01
Future Party 2 .. 1 174 0.01 +0.01
Australian Protectionist Party 3 .. 1 079 0.01 +0.01
Voluntary Euthanasia Party 1 .. 597 .. ..
Uniting Australia Party 1 .. 386 .. ..
Senator Online (Internet Voting Bills/Issues) 1 .. 209 .. ..
Others 4 .. 4 850 0.04 +0.02 Formal 12 914 927 94.09 -0.36 Informal 811 143 5.91 +0.36 Total/Turnout 1 188 150 13 726 070 93.23 +0.01 Enrolled 14 723 385
Table 2: House of Representatives: State summary
New South Wales
Party Candidates Seats won Votes Per cent Swing
Liberal Party/National Party Coalition
Liberal Party 39 23 1 551 436 37.35 +0.68
The Nationals 10 7 414 772 9.99 +2.06
Total Coalition 49 30 1 966 208 47.34 +2.74
Australian Labor Party 48 18 1 433 842 34.52 -2.76
The Greens 48 .. 330 050 7.95 -2.29
Palmer United Party 48 .. 174 551 4.20 +4.20
Christian Democratic Party (Fred Nile Group) 48 .. 88 576 2.13 +0.77
Independents 23 .. 71 848 1.73 -2.58
One Nation 11 .. 19 517 0.47 -0.01
Democratic Labour Party (DLP) 17 .. 16 909 0.41 +0.41
Katter's Australian Party 15 .. 16 534 0.40 +0.40
Bullet Train For Australia 7 .. 8 174 0.20 +0.20
Australia First Party 8 .. 6 084 0.15 +0.07
Rise Up Australia Party 7 .. 5 449 0.13 +0.13
Citizens Electoral Council of Australia 7 .. 4 057 0.10 +0.07
Australian Sex Party 2 .. 3 292 0.08 ..
Australian Stable Population Party 4 .. 2 245 0.05 +0.05
Australian Independents 3 .. 2 092 0.05 +0.05
Non-Custodial Parents Party (Equal Parenting) 2 .. 1 332 0.03 -0.04
Socialist Alliance 2 .. 1 229 0.03 -0.06
Future Party 1 .. 693 0.02 +0.02
Secular Party of Australia 1 .. 602 0.01 -0.08
Australian Voice Party 1 .. 545 0.01 +0.01
Formal 4 153 829 92.41 -0.76
Informal 341 006 7.59 +0.76
Total/Turnout 352 48 4 494 835 93.30 -0.03
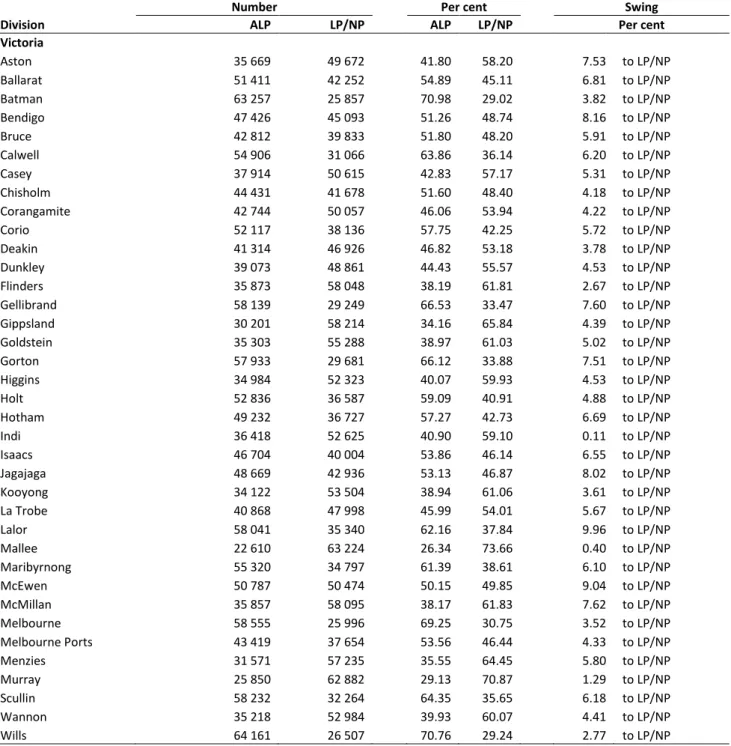
Table 2: House of Representatives: State summary
continued
Victoria
Party Candidates Seats won Votes Per cent Swing
Liberal Party/National Party Coalition
Liberal Party 36 14 1 320 417 40.08 +3.63
The Nationals 4 2 86 045 2.61 -0.58
Total Coalition 40 16 1 406 462 42.69 +3.05
Australian Labor Party 37 19 1 146 894 34.81 -8.00
The Greens 37 1 355 698 10.80 -1.86
Palmer United Party 37 .. 119 623 3.63 +3.63
Australian Sex Party 29 .. 67 460 2.05 +1.86
Family First Party 37 .. 59 288 1.80 -1.34
Independents 26 1 53 307 1.62 +0.79
Rise Up Australia Party 31 .. 18 124 0.55 +0.55
Democratic Labour Party (DLP) 13 .. 16 714 0.51 +0.51
Australian Christians 15 .. 15 886 0.48 +0.48
Katter's Australian Party 11 .. 15 409 0.47 +0.47
Liberal Democratic Party 1 .. 4 716 0.14 -0.11
Country Alliance 8 .. 4 708 0.14 +0.14
Animal Justice Party 2 .. 1 878 0.06 +0.06
Bullet Train For Australia 3 .. 1 772 0.05 +0.05
Socialist Alliance 2 .. 1 703 0.05 -0.02
Australian Stable Population Party 3 .. 856 0.03 +0.03
Secular Party of Australia 3 .. 776 0.02 -0.14
Citizens Electoral Council of Australia 2 .. 557 0.02 -0.01
Non-Custodial Parents Party (Equal Parenting) 1 .. 215 0.01 +0.01
Australia First Party 1 .. 212 0.01 ..
Senator Online (Internet Voting Bills/Issues) 1 .. 209 0.01 +0.01
Australian Independents 1 .. 170 0.01 +0.01
Australian Protectionist Party 1 .. 156 .. ..
Others 2 .. 1 866 0.06 +0.04 Formal 3 294 659 94.81 -0.69 Informal 180 267 5.19 +0.69 Total/Turnout 344 37 3 474 926 93.40 -0.09 Enrolled 3 720 640
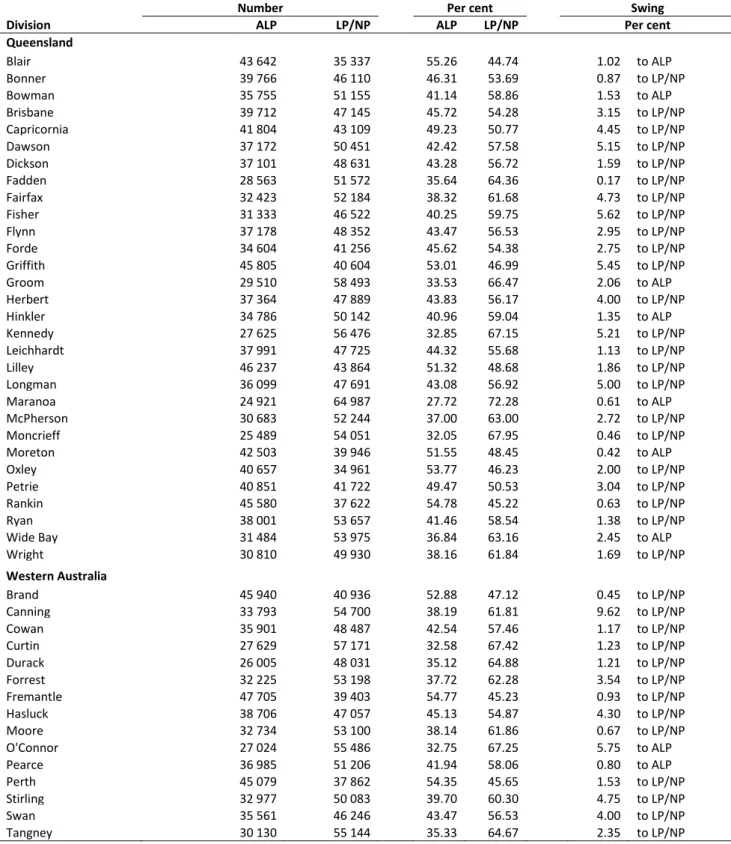
Table 2: House of Representatives: State summary
continued
Queensland
Party Candidates Seats won Votes Per cent Swing
Liberal National Party of Queensland 30 22 1 152 217 45.66 -1.76
Australian Labor Party 30 6 751 230 29.77 -3.81
Palmer United Party 30 1 278 125 11.02 +11.02
The Greens 30 .. 156 884 6.22 -4.70
Katter's Australian Party 26 1 94 540 3.75 +2.15
Family First Party 30 .. 51 375 2.04 -1.85
Independents 11 .. 10 435 0.41 -1.48
Rise Up Australia Party 17 .. 9 889 0.39 +0.39
Australian Sex Party 2 .. 2 859 0.11 +0.11
One Nation 4 .. 2 529 0.10 -0.06
Citizens Electoral Council of Australia 7 .. 2 292 0.09 +0.03
Australian Independents 2 .. 1 901 0.08 +0.08
Secular Party of Australia 3 .. 1 808 0.07 +0.05
Australian Voice Party 3 .. 1 136 0.05 +0.05
Democratic Labour Party (DLP) 1 .. 1 075 0.04 -0.15
Australian Stable Population Party 2 .. 729 0.03 +0.03
Future Party 1 .. 481 0.02 +0.02
Uniting Australia Party 1 .. 386 0.02 +0.02
Socialist Alliance 1 .. 377 0.01 -0.02 Others 2 .. 2 984 0.12 +0.09 Formal 2 523 252 94.87 +0.32 Informal 136 403 5.13 -0.32 Total/Turnout 233 30 2 659 655 93.55 +0.82 Enrolled 2 843 100
Table 2: House of Representatives: State summary
continued
Western Australia
Party Candidates Seats won Votes Per cent Swing
Liberal Party/National Party Coalition
Liberal Party 15 12 599 153 47.31 +0.29
The Nationals 5 .. 49 430 3.90 +0.32
Total Coalition 20 12 648 583 51.21 +0.61
Australian Labor Party 15 3 364 252 28.76 -2.42
The Greens 15 .. 123 370 9.74 -3.39
Palmer United Party 15 .. 67 332 5.32 +5.32
Australian Christians 15 .. 25 649 2.03 +2.03
Family First Party 11 .. 11 777 0.93 -0.79
Rise Up Australia Party 14 .. 9 153 0.72 +0.72
Katter's Australian Party 7 .. 4 997 0.39 +0.39
Independents 3 .. 3 357 0.27 -0.15
Australian Sex Party 1 .. 2 236 0.18 +0.01
Citizens Electoral Council of Australia 6 .. 1 638 0.13 +0.02
Australian Sports Party 1 .. 1 324 0.10 +0.10
Australian Democrats 2 .. 1 170 0.09 +0.09
Australian Protectionist Party 2 .. 923 0.07 +0.07
Socialist Alliance 1 .. 743 0.06 -0.05 Formal 1 266 504 94.62 -0.56 Informal 72 032 5.38 +0.56 Total/Turnout 128 15 1 338 536 92.07 -0.77 Enrolled 1 453 813 South Australia
Party Candidates Seats won Votes Per cent Swing
Liberal Party/National Party Coalition
Liberal Party 11 6 447 286 44.49 +4.28
The Nationals 1 .. 4 021 0.40 +0.40
Total Coalition 12 6 451 307 44.89 +4.68
Australian Labor Party 11 5 359 273 35.73 -5.01
The Greens 11 .. 83 252 8.28 -3.70
Family First Party 11 .. 54 409 5.41 +0.45
Palmer United Party 11 .. 37 981 3.78 +3.78
Independents 3 .. 12 834 1.28 +0.76
Katter's Australian Party 3 .. 2 268 0.23 +0.23
Rise Up Australia Party 1 .. 1 191 0.12 +0.12
Australia First Party 1 .. 1 116 0.11 +0.11
Socialist Alliance 1 .. 980 0.10 +0.02
Democratic Labour Party (DLP) 1 .. 834 0.08 +0.08
Formal 1 005 445 95.15 +0.61
Informal 51 239 4.85 -0.61
Total/Turnout 66 11 1 056 684 93.46 -0.37
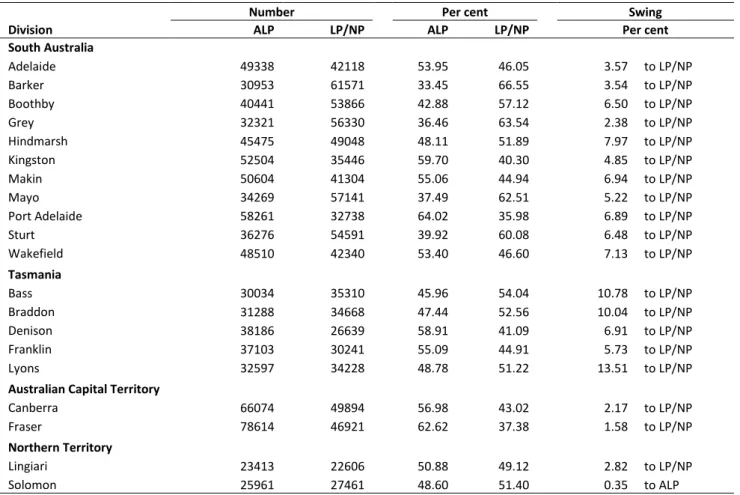
Table 2: House of Representatives: State summary
continued
Tasmania
Party Candidates Seats won Votes Per cent Swing
Liberal Party 5 3 132 961 40.26 +6.66
Australian Labor Party 5 1 114 977 34.81 -9.14
The Greens 5 .. 27 467 8.32 -8.50
Independents 1 1 24 688 7.47 +2.69
Palmer United Party 5 .. 20 026 6.06 +6.06
Family First Party 4 .. 4 971 1.51 +1.51
Rise Up Australia Party 4 .. 1 824 0.55 +0.55
Australian Christians 1 .. 963 0.29 +0.29
Australian Sex Party 1 .. 877 0.27 +0.27
Democratic Labour Party (DLP) 1 .. 554 0.17 +0.17
Katter's Australian Party 1 .. 478 0.14 +0.14
Secular Party of Australia 1 .. 384 0.12 -0.21
Australian Stable Population Party 1 .. 124 0.04 +0.04
Formal 330 294 95.96 ..
Informal 13 892 4.04 ..
Total/Turnout 35 5 344 186 94.73 -0.34
Enrolled 363 331
Australian Capital Territory
Party Candidates Seats won Votes Per cent Swing
Australian Labor Party 2 2 103 676 42.93 -2.09
Liberal Party 2 .. 83 612 34.62 -0.19
The Greens 2 .. 32 356 13.40 -5.80
Bullet Train For Australia 2 .. 9 855 4.08 +4.08
Palmer United Party 2 .. 6 788 2.81 +2.81
Australian Democrats 1 .. 2 444 1.01 +1.01
Rise Up Australia Party 1 .. 1 508 0.62 +0.62
Secular Party of Australia 1 .. 1 264 0.52 -0.45
Formal 241 503 96.17 +0.83
Informal 9 617 3.83 -0.83
Total/Turnout 13 2 251 120 94.64 +0.01
Table 2: House of Representatives: State summary
continued
Northern Territory
Party Candidates Seats won Votes Per cent Swing
Country Liberals (NT) 2 1 41 468 41.70 +0.87
Australian Labor Party 2 1 37 221 37.43 -0.48
The Greens 2 .. 7 841 7.89 -5.08
Palmer United Party 2 .. 4 609 4.63 +4.63
Citizens Electoral Council of Australia 2 .. 1 856 1.87 -0.61
Australian Sex Party 1 .. 1 847 1.86 +1.86
Australia's First Nations Political Party 2 .. 1 810 1.82 +1.82
Rise Up Australia Party 2 .. 1 444 1.45 +1.45
Independents 1 .. 748 0.75 -3.46
Voluntary Euthanasia Party 1 .. 597 0.60 +0.60
Formal 99 441 93.70 -0.11
Informal 6 687 6.30 +0.11
Total/Turnout 17 2 106 128 82.22 -0.45
Table 3: House of Representatives: Regional summary
Inner metropolitan
Party Candidates Seats won Votes Per cent Swing
Australian Labor Party 44 22 1 370 794 35.74 -3.64
Liberal Party (a) 41 19 1 550 148 40.42 +2.28
Liberal National Party of Queensland 3 1 113 737 2.97 +0.04
The Greens 44 1 489 958 12.78 -2.67
Palmer United Party 44 .. 109 202 2.85 +2.85
Family First Party 24 .. 35 503 0.93 -0.42
Others 136 1 165 907 4.33 +1.85 Formal 3 835 249 94.01 -0.42 Informal 244 452 5.99 +0.42 Total/turnout 336 44 4 079 701 92.22 -0.01 Enrolled 4 423 881
(a) Includes Country Liberals (NT). Outer metropolitan
Party Candidates Seats won Votes Per cent Swing
Australian Labor Party 43 19 1 352 868 36.74 -4.47
Liberal Party 33 17 1 250 447 33.96 +1.92
Liberal National Party of Queensland 10 7 376 151 10.22 +0.11
The Nationals 2 .. 6 033 0.16 +0.10
The Greens 43 .. 261 194 7.09 -3.80
Palmer United Party 43 .. 213 015 5.78 +5.78
Family First Party 30 .. 63 511 1.72 -1.08
Others 126 .. 159 071 4.32 +1.86 Formal 3 682 290 93.66 -0.29 Informal 249 225 6.34 +0.29 Total/turnout 330 43 3 931 515 93.40 +0.02 Enrolled 4 209 139 Total metropolitan
Party Candidates Seats won Votes Per cent Swing
Australian Labor Party 87 41 2 723 662 36.23 -4.04
Liberal Party (a) 74 36 2 800 595 37.26 +2.09
Liberal National Party of Queensland 13 8 489 888 6.52 +0.10
The Nationals 2 .. 6 033 0.08 +0.05
The Greens 87 1 751 152 9.99 -3.24
Palmer United Party 87 .. 322 217 4.29 +4.29
Family First Party 54 .. 99 014 1.32 -0.73
Others 262 1 324 978 4.32 +1.86
Formal 7 517 539 93.84 -0.35
Informal 493 677 6.16 +0.35
Total/turnout 666 87 8 011 216 92.80 -0.04
Enrolled 8 633 020
Table 3: House of Representatives: Regional summary
continued
ProvincialParty Candidates Seats won Votes Per cent Swing
Australian Labor Party 21 9 646 117 35.86 -6.16
Liberal Party 13 5 438 010 24.31 +1.16
Liberal National Party of Queensland 8 7 307 724 17.08 -1.12
The Nationals 3 .. 13 781 0.76 +0.50
Palmer United Party 21 .. 133 681 7.42 +7.42
The Greens 21 .. 127 063 7.05 -3.84
Family First Party 13 .. 23 325 1.29 -1.15
Others 80 .. 111 925 6.21 +3.55 Formal 1 801 626 94.29 -0.21 Informal 109 160 5.71 +0.21 Total/turnout 180 21 1 910 786 94.11 +0.18 Enrolled 2 030 375 Rural
Party Candidates Seats won Votes Per cent Swing
Australian Labor Party 42 5 941 586 26.19 -5.05
Liberal Party (a) 23 18 937 728 26.08 +0.67
Liberal National Party of Queensland 9 7 354 605 9.86 -0.32
The Nationals 15 9 534 454 14.86 +1.72
Palmer United Party 42 1 253 137 7.04 +7.04
The Greens 42 .. 238 703 6.64 -2.52
Family First Party 26 .. 59 481 1.65 -0.92
Others 143 2 276 068 7.68 -0.36
Formal 3 595 762 94.52 -0.43
Informal 208 306 5.48 +0.43
Total/turnout 342 42 3 804 068 93.70 +0.02
Enrolled 4 059 990
(a) Includes Country Liberals (NT). Total non-metropolitan
Party Candidates Seats won Votes Per cent Swing
Australian Labor Party 63 14 1 587 703 29.42 -5.40
Liberal Party (a) 36 23 1 375 738 25.49 +0.83
Liberal National Party of Queensland 17 14 662 329 12.27 -0.58
The Nationals 18 9 548 235 10.16 +1.30
Palmer United Party 63 1 386 818 7.17 +7.17
The Greens 63 .. 365 766 6.78 -2.95
Family First Party 39 .. 82 806 1.53 -1.00
Others 223 2 387 993 7.19 +0.86
Formal 5 397 388 94.44 -0.36
Informal 317 466 5.56 +0.36
Total/turnout 522 63 5 714 854 93.83 +0.07
Enrolled 6 090 365
Table 4: House of Representatives: Party status summary
Safe ALP held seats
Party Candidates Seats won Votes Per cent Swing
Australian Labor Party 29 28 1 172 894 45.95 -6.29
Liberal Party 28 1 812 525 31.83 +3.13
The Nationals 2 .. 38 709 1.52 +0.30
The Greens 29 .. 227 616 8.92 -3.86
Palmer United Party 29 .. 118 356 4.64 +4.64
Family First Party 19 .. 51 207 2.01 -0.46
Others 92 .. 131 430 5.15 +3.14
Formal 2 552 737 93.70 -0.26
Informal 171 694 6.30 +0.26
Total/turnout 228 29 2 724 431 92.97 +0.69
Enrolled 2 930 331
Fairly safe ALP held seats
Party Candidates Seats won Votes Per cent Swing
Australian Labor Party 17 13 592 664 41.34 -5.05
Liberal Party 15 4 501 343 34.97 +1.32
Liberal National Party of Queensland 1 .. 36 481 2.54 +0.48
The Nationals 2 .. 36 710 2.56 +1.33
The Greens 17 .. 143 438 10.00 -3.70
Palmer United Party 17 .. 50 227 3.50 +3.50
Family First Party 9 .. 12 889 0.90 -0.43
Others 52 .. 60 039 4.19 +3.24
Formal 1 433 791 92.95 -0.50
Informal 108 729 7.05 +0.50
Total/turnout 130 17 1 542 520 92.86 -0.38
Enrolled 1 661 144
Marginal ALP held seats
Party Candidates Seats won Votes Per cent Swing
Australian Labor Party 26 14 863 987 39.22 -3.25
Liberal Party (a) 18 9 650 116 29.52 +1.38
Liberal National Party of Queensland 7 2 225 292 10.23 -0.24
The Nationals 2 1 40 686 1.85 +0.11
The Greens 26 .. 170 130 7.72 -3.74
Palmer United Party 26 .. 110 113 5.00 +5.00
Family First Party 14 .. 24 170 1.10 -1.08
Others 98 .. 118 206 5.37 +2.36
Formal 2 202 700 93.49 -0.29
Informal 153 485 6.51 +0.29
Total/turnout 217 26 2 356 185 92.96 -0.56
Enrolled 2 534 744
Table 4: House of Representatives: Party status summary
continued
Total ALP held seatsParty Candidates Seats won Votes Per cent Swing
Australian Labor Party 72 55 2 629 545 42.49 -4.93
Liberal Party (a) 61 14 1 963 984 31.73 +2.06
Liberal National Party of Queensland 8 2 261 773 4.23 +0.05
The Nationals 6 1 116 105 1.88 +0.48
The Greens 72 .. 541 184 8.74 -3.79
Palmer United Party 72 .. 278 696 4.50 +4.50
Family First Party 42 .. 88 266 1.43 -0.49
Others 242 .. 309 675 5.00 +2.69
Formal 6 189 228 93.45 -0.33
Informal 433 908 6.55 +0.33
Total/turnout 575 72 6 623 136 92.94 +0.02
Enrolled 7 126 219
(a) Includes Country Liberals (NT).
Safe LP held seats
Party Candidates Seats won Votes Per cent Swing
Australian Labor Party 16 .. 292 763 20.95 -3.21
Liberal Party 16 16 821 920 58.81 +0.68
The Nationals 2 .. 21 166 1.51 +0.57
The Greens 16 .. 136 749 9.79 -2.22
Palmer United Party 16 .. 50 624 3.62 +3.62
Family First Party 4 .. 14 598 1.04 -0.49
Others 42 .. 59 656 4.27 +1.72
Formal 1 397 476 94.48 -0.66
Informal 81 680 5.52 +0.66
Total/turnout 112 16 1 479 156 92.94 -0.26
Enrolled 1 591 572
Fairly safe LP held seats
Party Candidates Seats won Votes Per cent Swing
Australian Labor Party 12 .. 259 836 24.38 -5.43
Liberal Party 12 11 561 965 52.72 +1.87
The Nationals 2 .. 9 664 0.91 +0.25
The Greens 12 .. 111 986 10.51 -2.33
Palmer United Party 12 .. 41 601 3.90 +3.90
Family First Party 10 .. 17 850 1.67 -0.88
Others 36 1 63 000 5.91 +2.83
Formal 1 065 902 95.37 -0.38
Informal 51 760 4.63 +0.38
Total/turnout 96 12 1 117 662 93.81 +0.27
Table 4: House of Representatives: Party status summary
continued
Marginal LP held seatsParty Candidates Seats won Votes Per cent Swing
Australian Labor Party 17 .. 446 268 30.50 -6.07
Liberal Party (a) 17 17 738 458 50.46 +3.19
The Nationals 1 .. 1 707 0.12 +0.12
The Greens 17 .. 125 937 8.61 -1.66
Palmer United Party 17 .. 69 360 4.74 +4.74
Family First Party 10 .. 19 600 1.34 -0.79
Others 51 .. 62 001 4.24 +1.76
Formal 1 463 331 94.43 -0.26
Informal 86 325 5.57 +0.26
Total/turnout 130 17 1 549 656 93.42 -0.21
Enrolled 1 658 874
(a) Includes Country Liberals (NT).
Total LP held seats
Party Candidates Seats won Votes Per cent Swing
Australian Labor Party 45 .. 998 867 25.44 -4.85
Liberal Party (a) 45 44 2 122 343 54.05 +1.92
The Nationals 5 .. 32 537 0.83 +0.31
The Greens 45 .. 374 672 9.54 -2.05
Palmer United Party 45 .. 161 585 4.12 +4.12
Family First Party 24 .. 52 048 1.33 -0.70
Others 129 1 184 657 12.62 +1.62
Formal 3 926 709 94.70 -0.44
Informal 219 765 5.30 +0.44
Total/turnout 338 45 4 146 474 93.35 -0.17
Enrolled 4 441 817
(a) Includes Country Liberals (NT).
Safe LNP held seats
Party Candidates Seats won Votes Per cent Swing
Australian Labor Party 9 .. 171 705 22.64 -3.59
Liberal National Party of Queensland 9 9 390 669 51.50 -6.76
The Greens 9 .. 38 856 5.12 -4.16
Palmer United Party 9 .. 107 879 14.22 +14.22
Family First Party 9 .. 17 787 2.34 -1.45
Katter's Australian Party 6 .. 22 599 2.98 +2.98
Others 12 .. 9 055 1.19 -1.13
Formal 758 550 95.10 +0.53
Informal 39 079 4.90 -0.53
Total/turnout 63 9 797 629 93.69 +0.67
Table 4: House of Representatives: Party status summary
continued
Fairly safe LNP held seatsParty Candidates Seats won Votes Per cent Swing
Australian Labor Party 2 .. 38 814 22.02 -4.07
Liberal National Party of Queensland 2 1 82 325 46.71 -0.77
The Greens 2 .. 20 281 11.51 -7.00
Palmer United Party 2 1 26 967 15.30 +15.30
Family First Party 2 .. 2 629 1.49 -1.93
Katter's Australian Party 2 .. 2 763 1.57 +1.57
Others 3 .. 2 486 1.41 -3.09
Formal 176 265 95.84 -0.26
Informal 7 647 4.16 +0.26
Total/turnout 15 2 183 912 93.77 +0.71
Enrolled 196 140
Marginal LNP held seats
Party Candidates Seats won Votes Per cent Swing
Australian Labor Party 10 .. 259 311 30.87 -5.15
Liberal National Party of Queensland 10 10 383 106 45.60 -0.58
The Greens 10 .. 52 604 6.26 -4.72
Palmer United Party 10 .. 84 047 10.00 +10.00
Family First Party 10 .. 15 335 1.83 -2.29
Katter's Australian Party 9 .. 29 192 3.47 +3.47
Others 23 .. 16 497 1.96 -0.21
Formal 840 092 94.81 +0.40
Informal 45 948 5.19 -0.40
Total/turnout 82 10 886 040 93.47 +0.83
Enrolled 947 970
Total LNP held seats
Party Candidates Seats won Votes Per cent Swing
Australian Labor Party 21 .. 469 830 26.47 -4.35
Liberal National Party of Queensland 21 20 856 100 48.23 -3.27
The Greens 21 .. 111 741 6.30 -4.71
Palmer United Party 21 1 218 893 12.33 +12.33
Family First Party 21 .. 35 751 2.01 -1.90
Katter's Australian Party 17 .. 54 554 3.07 +3.07
Others 38 .. 28 038 1.58 -0.90
Formal 1 774 907 95.04 +0.39
Informal 92 674 4.96 -0.39
Total/turnout 160 21 1 867 581 93.59 +0.74
Table 4: House of Representatives: Party status summary
continued
Safe NP held seatsParty Candidates Seats won Votes Per cent Swing
Australian Labor Party 5 .. 95 492 21.50 -3.51
Liberal Party 1 .. 23 363 5.26 +1.37
The Nationals 5 5 243 535 54.83 +0.44
The Greens 5 .. 19 590 4.41 -1.67
Palmer United Party 5 .. 22 293 5.02 +5.02
Family First Party 2 .. 2 947 0.66 -1.28
Others 24 .. 36 964 8.32 -0.03
Formal 444 184 93.66 -1.56
Informal 30 055 6.34 +1.56
Total/turnout 47 5 474 239 94.65 +0.32
Enrolled 501 062
Fairly safe NP held seats
Party Candidates Seats won Votes Per cent Swing
Australian Labor Party 1 .. 21 910 25.37 -2.45
The Nationals 1 1 45 820 53.05 +2.28
The Greens 1 .. 10 685 12.37 +3.28
Palmer United Party 1 .. 5 739 6.64 +6.64
Others 1 .. 2 224 2.57 +0.18
Formal 86 378 94.72 -0.95
Informal 4 813 5.28 +0.95
Total/turnout 5 1 91 191 93.84 -0.30
Enrolled 97 180
Marginal NP held seats
Party Candidates Seats won Votes Per cent Swing
Australian Labor Party 1 .. 14 234 17.25 +0.14
Liberal Party 1 1 32 284 39.13 +0.77
The Nationals 1 .. 20 914 25.35 -3.50
The Greens 1 .. 5 627 6.82 -2.04
Palmer United Party 1 .. 3 581 4.34 +4.34
Family First Party 1 .. 698 0.85 -0.58
Others 5 .. 5 172 6.27 +3.60
Formal 82 510 94.06 -0.57
Informal 5 206 5.94 +0.57
Total/turnout 11 1 87 716 92.27 -2.13
Table 4: House of Representatives: Party status summary
continued
Total NP held seatsParty Candidates Seats won Votes Per cent Swing
Australian Labor Party 7 .. 131 636 21.47 -2.87
Liberal Party 2 1 55 647 9.08 +1.12
The Nationals 7 6 310 269 50.61 +0.14
Palmer United Party 7 .. 31 613 5.16 +5.16
The Greens 7 .. 35 902 5.86 -1.01
Family First Party 3 .. 3 645 0.59 -1.01
Others 30 .. 44 360 7.24 -1.29 Formal 613 072 93.86 -1.34 Informal 40 074 6.14 +1.34 Total/turnout 63 7 653 146 94.21 -0.11 Enrolled 693 311 GRN held seats
Party Candidates Seats won Votes Per cent Swing
Australian Labor Party 1 .. 22 490 26.60 -11.54
Liberal Party 1 .. 19 301 22.83 +1.37
The Greens 1 1 36 035 42.62 +7.03
Palmer United Party 1 .. 780 0.92 +0.92
Family First Party 1 .. 453 0.54 -1.03
Others 11 .. 5 492 6.50 +3.93
Formal 84 551 94.05 -2.28
Informal 5 348 5.95 +2.28
Total/turnout 16 1 89 899 90.69 +0.60
Enrolled 99 130
Independent held seats
Party Candidates Seats won Votes Per cent Swing
Australian Labor Party 4 .. 58 997 18.07 -0.09
Liberal Party 1 .. 15 058 4.61 +0.06
Liberal National Party of Queensland 1 .. 34 344 10.52 +3.78
The Nationals 2 2 95 357 29.21 +13.03
The Greens 4 .. 17 384 5.33 -1.76
Palmer United Party 4 .. 17 468 5.35 +5.35
Family First Party 2 .. 1 657 0.51 ..
Others 18 2 86 195 26.40 -20.11
Formal 326 460 94.40 -1.52
Informal 19 374 5.60 +1.52
Total/turnout 36 4 345 834 94.12 +0.90
Table 5: House of Representatives: Socio-economic status summary
Low
Party Candidates Seats won Votes Per cent Swing
Australian Labor Party 38 15 1 060 516 33.37 -3.38
Liberal Party (a) 22 9 731 358 23.02 +0.95
Liberal National Party of Queensland 6 4 231 267 7.28 -0.35
The Nationals 13 9 499 596 15.72 +2.19
The Greens 38 .. 181 069 5.70 -3.04
Palmer United Party 38 .. 197 432 6.21 +6.21
Family First Party 19 .. 53 490 1.68 -0.42
Others 116 1 222 891 7.01 -1.71
Formal 3 177 619 93.26 -0.49
Informal 229 582 6.74 +0.49
Total/turnout 290 38 3 407 201 93.36 -0.32
Enrolled 3 649 518
(a) Includes Country Liberals (NT). Lower middle
Party Candidates Seats won Votes Per cent Swing
Australian Labor Party 37 16 1 142 127 36.18 -6.78
Liberal Party 28 12 967 930 30.66 +1.27
Liberal National Party of Queensland 9 7 321 623 10.19 -0.07
The Nationals 4 .. 44 410 1.41 +0.21
The Greens 37 .. 212 923 6.74 -3.47
Palmer United Party 37 .. 186 006 5.89 +5.89
Family First Party 26 .. 43 973 1.39 -1.43
Others 143 2 238 149 7.54 +4.94 Formal 3 157 141 93.86 -0.42 Informal 206 647 6.14 +0.42 Total/turnout 321 37 3 363 788 93.39 +0.19 Enrolled 3 601 695 Upper middle
Party Candidates Seats won Votes Per cent Swing
Australian Labor Party 38 13 1 099 974 33.66 -5.46
Liberal Party (a) 29 16 1 061 024 32.47 +1.99
Liberal National Party of Queensland 9 7 357 626 10.95 -0.81
The Nationals 3 .. 10 262 0.31 +0.09
The Greens 38 1 325 567 9.96 -3.11
Palmer United Party 38 1 213 436 6.53 +6.53
Family First Party 29 .. 58 777 1.80 -0.91
Others 126 .. 140 753 4.31 +2.07
Formal 3 267 419 94.15 -0.21
Informal 202 918 5.85 +0.21
Total/turnout 310 38 3 470 337 93.00 -0.09
Enrolled 3 731 696
Table 5: House of Representatives: Socio-economic status summary
continued
HighParty Candidates Seats won Votes Per cent Swing
Australian Labor Party 37 11 1 008 748 30.45 -2.93
Liberal Party 31 22 1 416 021 42.74 +1.92
Liberal National Party of Queensland 6 4 241 701 7.30 +0.40
The Greens 37 .. 397 359 11.99 -2.92
Palmer United Party 37 .. 112 161 3.39 +3.39
Family First Party 19 .. 25 580 0.77 -0.66
Others 100 .. 111 178 3.36 +1.26
Formal 3 312 748 95.06 -0.32
Informal 171 996 4.94 +0.32
Total/turnout 267 37 3 484 744 93.16 +0.25
Enrolled 3 740 476
Note: For an explanation of the socio-economic status classifications see:P Nelson, Socio-economic indexes for 2009 electoral divisions: 2006 Census, Research paper 1, 28 July 2010, Parliamentary Library, Canberra, 2010–11.
Table 6a: House of Representatives: Electoral division summary (number)
Number
First preference votes Formal Informal Total Electors
Division ALP LP LNP NP GRN PUP Others votes votes votes enrolled
New South Wales
Banks 34 835 39 899 .. .. 4 242 2 125 3 774 84 875 9 374 94 249 101 490 Barton 32 345 33 881 .. .. 4 788 3 114 5 873 80 001 10 948 90 949 98 663 Bennelong 28 726 46 907 .. .. 7 454 1 589 3 846 88 522 7 200 95 722 102 508 Berowra 16 402 53 236 .. .. 8 684 2 324 6 001 86 647 5 096 91 743 97 000 Blaxland 43 568 25 579 .. .. 2 416 2 119 4 495 78 177 12 380 90 557 100 261 Bradfield 14 720 57 506 .. .. 11 429 2 366 2 663 88 684 5 401 94 085 100 458 Calare 23 185 .. .. 52 650 4 054 4 356 7 078 91 323 5 942 97 265 102 038 Charlton 40 125 24 646 .. .. 5 820 9 412 6 397 86 400 6 618 93 018 98 551 Chifley 43 044 26 479 .. .. 2 198 3 361 7 219 82 301 12 690 94 991 102 369 Cook 22 850 55 707 .. .. 6 058 3 765 3 919 92 299 5 813 98 112 104 183 Cowper 21 910 .. .. 45 820 10 685 5 739 2 224 86 378 4 813 91 191 97 180 Cunningham 41 522 30 685 .. .. 10 730 4 253 3 987 91 177 6 208 97 385 104 092 Dobell 30 248 35 617 .. .. 4 238 2 920 13 117 86 140 6 994 93 134 99 239 Eden-Monaro 34 638 40 431 .. .. 6 725 4 655 2 864 89 313 5 240 94 553 100 021 Farrer 19 708 47 977 .. .. 3 643 3 392 8 276 82 996 6 357 89 353 94 524 Fowler 47 772 21 043 .. .. 2 684 2 722 4 407 78 628 12 728 91 356 99 122 Gilmore 31 789 41 726 .. .. 8 438 5 726 3 030 90 709 4 946 95 655 101 469 Grayndler 42 009 21 981 .. .. 20 498 1 522 2 999 89 009 6 699 95 708 104 808 Greenway 38 319 34 488 .. .. 3 175 3 483 6 676 86 141 9 549 95 690 101 829 Hughes 28 406 48 436 .. .. 3 948 5 224 2 561 88 575 7 071 95 646 101 488 Hume 23 711 49 105 .. .. 5 218 4 015 8 945 90 994 6 142 97 136 102 291 Hunter 38 241 .. .. 30 170 5 066 6 552 5 912 85 941 6 014 91 955 97 291 Kingsford Smith 36 177 37 455 .. .. 8 431 1 611 2 429 86 103 8 130 94 233 102 418 Lindsay 34 212 40 882 .. .. 2 679 4 517 5 368 87 658 7 837 95 495 101 229 Lyne 18 352 .. .. 45 871 5 340 4 727 11 955 86 245 5 809 92 054 97 138 Macarthur 26 039 46 185 .. .. 3 929 4 916 3 940 85 009 7 225 92 234 97 941 Mackellar 15 606 56 521 .. .. 12 843 3 771 1 791 90 532 5 525 96 057 102 861 Macquarie 27 872 42 590 .. .. 9 986 3 731 5 745 89 924 5 362 95 286 100 681 McMahon 41 334 33 430 .. .. 2 410 2 862 2 323 82 359 10 542 92 901 99 279 Mitchell 17 775 56 706 .. .. 5 554 2 792 3 781 86 608 5 833 92 441 97 682 New England 10 825 .. .. 49 486 4 184 4 746 22 048 91 289 5 881 97 170 102 116 Newcastle 37 391 29 632 .. .. 10 258 3 518 4 696 85 495 5 653 91 148 97 397 North Sydney 17 727 53 991 .. .. 13 579 1 493 1 658 88 448 5 031 93 479 101 333 Page 33 336 .. .. 40 088 5 601 4 135 2 775 85 935 4 223 90 158 95 724 Parkes 18 850 .. .. 58 020 4 691 6 724 2 354 90 639 5 519 96 158 101 936 Parramatta 33 261 35 724 .. .. 4 261 1 760 5 609 80 615 9 474 90 089 98 602 Paterson 25 811 46 922 .. .. 5 812 5 451 3 121 87 117 4 746 91 863 97 107 Reid 34 817 40 430 .. .. 5 968 1 298 3 311 85 824 9 003 94 827 103 761 Richmond 28 575 .. .. 32 066 15 083 6 359 3 195 85 278 4 403 89 681 97 421 Riverina 17 970 .. .. 52 062 3 169 4 545 10 227 87 973 6 592 94 565 100 115 Robertson 31 046 38 704 .. .. 4 966 2 082 12 342 89 140 5 604 94 744 100 815 Shortland 41 892 32 532 .. .. 5 198 5 341 1 081 86 044 5 498 91 542 96 947 Sydney 40 579 26 901 .. .. 15 273 1 261 4 137 88 151 5 830 93 981 106 401 Throsby 37 980 23 498 .. 8 539 4 613 3 885 5 878 84 393 8 174 92 567 98 401 Warringah 17 259 54 388 .. .. 13 873 1 961 1 846 89 327 5 078 94 405 102 672 Watson 39 126 30 617 .. .. 4 171 1 970 3 146 79 030 12 814 91 844 101 285 Wentworth 17 840 58 306 .. .. 13 455 998 1 485 92 084 5 564 97 648 109 347 Werriwa 34 117 30 693 .. .. 2 532 3 363 6 674 77 379 11 433 88 812 96 020
Table 6a: House of Representatives: Electoral division summary (number)
continued
Number
First preference votes Formal Informal Total Electors
Division ALP LP LNP NP GRN PUP Others votes votes votes enrolled
Victoria Aston 27 850 44 030 .. .. 5 017 3 206 5 238 85 341 4 047 89 388 94 357 Ballarat 39 251 35 592 .. .. 8 911 3 396 6 513 93 663 4 578 98 241 103 500 Batman 36 798 20 017 .. .. 23 522 2 253 6 524 89 114 5 450 94 564 103 239 Bendigo 33 829 36 701 .. 4 644 8 600 2 336 6 409 92 519 5 600 98 119 102 928 Bruce 34 626 35 501 .. .. 5 491 2 173 4 854 82 645 4 810 87 455 94 772 Calwell 42 819 24 490 .. .. 4 632 3 728 10 303 85 972 7 398 93 370 102 682 Casey 24 651 43 538 .. .. 9 641 4 413 6 286 88 529 4 291 92 820 97 761 Chisholm 34 015 37 990 .. .. 8 133 1 405 4 566 86 109 3 802 89 911 96 315 Corangamite 29 728 44 778 .. 598 11 007 2 026 4 664 92 801 4 304 97 105 101 640 Corio 39 267 31 768 .. .. 6 593 5 122 7 503 90 253 5 049 95 302 101 210 Deakin 28 883 40 482 .. .. 9 560 1 949 7 366 88 240 3 989 92 229 97 381 Dunkley 27 155 42 869 .. .. 8 199 3 707 6 004 87 934 4 424 92 358 99 004 Flinders 23 666 51 972 .. .. 9 148 5 639 3 496 93 921 4 916 98 837 105 435 Gellibrand 40 236 23 343 .. .. 14 623 3 413 5 773 87 388 5 202 92 590 102 190 Gippsland 20 467 .. .. 47 533 5 039 3 785 11 591 88 415 5 629 94 044 99 573 Goldstein 21 591 51 193 .. .. 14 408 2 044 1 355 90 591 3 121 93 712 100 583 Gorton 44 449 22 328 .. .. 5 597 5 238 10 002 87 614 6 706 94 320 102 293 Higgins 21 027 47 467 .. .. 14 669 1 385 2 759 87 307 3 239 90 546 98 404 Holt 43 096 29 181 .. .. 3 469 4 931 8 746 89 423 5 789 95 212 102 585 Hotham 40 512 31 929 .. .. 7 327 2 981 3 210 85 959 4 365 90 324 97 618 Indi 10 375 39 785 .. .. 3 041 2 417 33 425 89 043 4 774 93 817 98 637 Isaacs 35 837 34 864 .. .. 6 120 2 846 7 041 86 708 4 375 91 083 97 897 Jagajaga 34 813 38 422 .. .. 11 863 2 452 4 055 91 605 3 549 95 154 101 205 Kooyong 19 655 48 802 .. .. 14 526 1 406 3 237 87 626 3 073 90 699 97 044 La Trobe 28 488 40 925 .. .. 8 905 4 514 6 034 88 866 4 083 92 949 98 006 Lalor 42 184 27 321 .. .. 5 615 5 416 12 845 93 381 6 630 100 011 107 392 Mallee 15 020 23 363 .. 33 270 2 637 2 883 8 661 85 834 6 373 92 207 97 400 Maribyrnong 43 162 29 767 .. .. 8 920 2 470 5 798 90 117 5 940 96 057 104 938 McEwen 38 091 40 853 .. .. 7 187 6 822 8 308 101 261 4 910 106 171 112 012 McMillan 23 537 47 316 .. .. 7 157 4 380 11 562 93 952 6 118 100 070 105 739 Melbourne 22 490 19 301 .. .. 36 035 780 5 945 84 551 5 348 89 899 99 130 Melbourne Ports 25 676 33 278 .. .. 16 353 1 122 4 644 81 073 3 223 84 296 93 616 Menzies 22 788 52 290 .. .. 7 663 2 353 3 712 88 806 3 987 92 793 98 647 Murray 18 403 54 490 .. .. 3 485 2 964 9 390 88 732 5 992 94 724 100 185 Scullin 45 484 26 369 .. .. 6 780 5 991 5 872 90 496 6 214 96 710 103 691 Wannon 26 044 47 392 .. .. 5 668 3 519 5 579 88 202 3 665 91 867 96 084 Wills 40 931 20 710 .. .. 20 157 2 158 6 712 90 668 5 304 95 972 105 547
Table 6a: House of Representatives: Electoral division summary (number)
continued
Number
First preference votes Formal Informal Total Electors
Division ALP LP LNP NP GRN PUP Others votes votes votes enrolled
Queensland Blair 32 818 .. 26 734 .. 3 359 9 805 6 263 78 979 4 749 83 728 88 656 Bonner 30 927 .. 40 186 .. 5 876 6 712 2 175 85 876 3 895 89 771 95 475 Bowman 25 967 .. 42 828 .. 5 198 11 049 1 868 86 910 4 102 91 012 95 879 Brisbane 26 163 .. 41 681 .. 12 452 3 643 2 918 86 857 3 504 90 361 97 446 Capricornia 31 450 .. 33 608 .. 2 910 6 747 10 198 84 913 4 614 89 527 94 409 Dawson 26 030 .. 40 507 .. 4 396 8 777 7 913 87 623 4 463 92 086 98 152 Dickson 26 848 .. 41 163 .. 5 507 8 390 3 824 85 732 3 819 89 551 94 375 Fadden 17 804 .. 42 962 .. 3 995 11 759 3 615 80 135 4 925 85 060 91 759 Fairfax 15 429 .. 34 959 .. 7 046 22 409 4 764 84 607 4 569 89 176 95 488 Fisher 16 297 .. 34 619 .. 5 908 13 559 7 472 77 855 4 803 82 658 88 383 Flynn 28 598 .. 39 362 .. 1 890 7 908 7 772 85 530 4 725 90 255 95 357 Forde 25 794 .. 32 271 .. 3 162 9 445 5 188 75 860 5 948 81 808 88 345 Griffith 34 878 .. 36 481 .. 8 799 2 903 3 348 86 409 4 323 90 732 97 413 Groom 19 451 .. 48 966 .. 3 823 8 225 7 538 88 003 3 656 91 659 96 926 Herbert 25 051 .. 36 952 .. 4 463 7 573 11 214 85 253 5 379 90 632 97 076 Hinkler 23 442 .. 38 005 .. 2 308 14 990 6 183 84 928 4 399 89 327 94 495 Kennedy 13 777 .. 34 344 .. 2 727 6 419 26 834 84 101 4 828 88 929 96 393 Leichhardt 27 920 .. 38 795 .. 5 646 7 326 6 029 85 716 4 939 90 655 99 312 Lilley 36 228 .. 37 232 .. 6 908 6 193 3 540 90 101 4 314 94 415 100 171 Longman 25 683 .. 37 570 .. 3 304 10 714 6 519 83 790 4 473 88 263 94 049 Maranoa 14 649 .. 51 622 .. 2 762 12 506 8 369 89 908 4 124 94 032 99 608 McPherson 18 866 .. 41 594 .. 5 689 13 203 3 575 82 927 4 559 87 486 94 463 Moncrieff 16 562 .. 44 295 .. 5 127 10 882 2 674 79 540 4 839 84 379 92 674 Moreton 31 932 .. 34 824 .. 8 234 4 147 3 312 82 449 4 912 87 361 94 271 Oxley 32 589 .. 29 064 .. 4 072 5 368 4 525 75 618 5 619 81 237 86 841 Petrie 32 630 .. 33 570 .. 3 729 8 422 4 222 82 573 4 530 87 103 92 973 Rankin 35 098 .. 30 260 .. 4 405 9 228 4 211 83 202 5 840 89 042 96 516 Ryan 23 385 .. 47 366 .. 13 235 4 558 3 114 91 658 3 078 94 736 100 652 Wide Bay 17 697 .. 41 767 .. 5 596 13 574 6 825 85 459 4 199 89 658 95 172 Wright 17 267 .. 38 630 .. 4 358 11 691 8 794 80 740 4 276 85 016 90 371
Table 6a: House of Representatives: Electoral division summary (number)
continued
Number
First preference votes Formal Informal Total Electors
Division ALP LP LNP NP GRN PUP Others votes votes votes Enrolled
Western Australia Brand 35 093 33 634 .. .. 6 343 6 518 5 288 86 876 5 257 92 133 99 867 Canning 23 578 45 189 .. 1 707 6 547 6 088 5 384 88 493 5 173 93 666 101 804 Cowan 27 248 41 849 .. .. 6 677 4 501 4 113 84 388 4 536 88 924 95 477 Curtin 15 189 52 623 .. .. 12 985 2 237 1 766 84 800 2 850 87 650 94 323 Durack 15 018 28 143 .. 17 145 5 227 4 998 3 505 74 036 5 056 79 092 90 852 Forrest 21 579 42 640 .. 5 338 8 136 4 301 3 429 85 423 5 095 90 518 96 933 Fremantle 35 554 33 219 .. .. 10 354 3 451 4 530 87 108 5 916 93 024 100 902 Hasluck 28 081 38 951 .. .. 6 546 5 885 6 300 85 763 5 163 90 926 98 464 Moore 22 324 45 562 .. .. 8 539 5 745 3 664 85 834 4 055 89 889 97 238 O'Connor 14 234 32 284 .. 20 914 5 627 3 581 5 870 82 510 5 206 87 716 95 069 Pearce 22 827 40 275 .. 4 326 9 901 6 587 4 275 88 191 5 528 93 719 101 317 Perth 34 215 33 021 .. .. 8 801 2 897 4 007 82 941 4 625 87 566 95 247 Stirling 23 531 43 039 .. .. 9 359 3 342 3 789 83 060 4 986 88 046 96 277 Swan 25 037 39 972 .. .. 9 446 3 463 3 889 81 807 4 879 86 686 95 234 Tangney 20 744 48 752 .. .. 8 882 3 738 3 158 85 274 3 707 88 981 94 809 South Australia Adelaide 38 650 38 463 .. .. 9 251 1 943 3 149 91 456 3 770 95 226 102 976 Barker 16 993 48 678 .. 4 021 5 224 3 623 13 985 92 524 5 259 97 783 103 347 Boothby 29 018 47 484 .. .. 11 287 2 835 3 683 94 307 3 400 97 707 104 032 Grey 24 205 49 334 .. .. 3 289 4 457 7 366 88 651 5 063 93 714 100 758 Hindmarsh 35 876 43 639 .. .. 8 360 2 332 4 316 94 523 4 847 99 370 106 792 Kingston 43 328 28 492 .. .. 6 062 3 709 6 359 87 950 4 697 92 647 98 775 Makin 41 873 34 192 .. .. 5 429 3 818 6 596 91 908 4 717 96 625 102 817 Mayo 19 325 49 195 .. .. 12 931 3 434 6 525 91 410 3 684 95 094 100 519 Port Adelaide 46 024 23 955 .. .. 7 834 5 227 7 959 90 999 6 020 97 019 105 256 Sturt 26 258 49 429 .. .. 8 902 2 713 3 565 90 867 4 303 95 170 101 845 Wakefield 37 723 34 425 .. .. 4 683 3 890 10 129 90 850 5 479 96 329 103 455 Tasmania Bass 22 643 31 267 .. .. 5 160 3 520 2 754 65 344 2 850 68 194 72 226 Braddon 24 791 30 904 .. .. 3 410 6 125 726 65 956 2 428 68 384 71 718 Denison 16 043 15 058 .. .. 5 133 1 576 27 015 64 825 2 856 67 681 71 804 Franklin 26 893 26 070 .. .. 8 201 4 108 2 072 67 344 2 639 69 983 73 593 Lyons 24 607 29 662 .. .. 5 563 4 697 2 296 66 825 3 119 69 944 73 990
Australian Capital Territory
Canberra 47 613 43 919 .. .. 14 691 3 725 6 020 115 968 4 758 120 726 127 359 Fraser 56 063 39 693 .. .. 17 665 3 063 9 051 125 535 4 859 130 394 137 987 Northern Territory (a)
Lingiari 18 292 17 593 .. .. 3 572 1 918 4 644 46 019 3 696 49 715 65 916
Solomon 18 929 23 875 .. .. 4 269 2 691 3 658 53 422 2 991 56 413 63 163
Table 6b: House of Representatives: Electoral division summary (per cent)
Per cent
First preference votes Formal Informal Total/
Division ALP LP LNP NP GRN PUP Others votes votes turnout
New South Wales
Banks 41.04 47.01 .. .. 5.00 2.50 4.45 90.05 9.95 92.87 Barton 40.43 42.35 .. .. 5.98 3.89 7.34 87.96 12.04 92.18 Bennelong 32.45 52.99 .. .. 8.42 1.80 4.34 92.48 7.52 93.38 Berowra 18.93 61.44 .. .. 10.02 2.68 6.93 94.45 5.55 94.58 Blaxland 55.73 32.72 .. .. 3.09 2.71 5.75 86.33 13.67 90.32 Bradfield 16.60 64.84 .. .. 12.89 2.67 3.00 94.26 5.74 93.66 Calare 25.39 .. .. 57.65 4.44 4.77 7.75 93.89 6.11 95.32 Charlton 46.44 28.53 .. .. 6.74 10.89 7.40 92.89 7.11 94.39 Chifley 52.30 32.17 .. .. 2.67 4.08 8.77 86.64 13.36 92.79 Cook 24.76 60.35 .. .. 6.56 4.08 4.25 94.08 5.92 94.17 Cowper 25.37 .. .. 53.05 12.37 6.64 2.57 94.72 5.28 93.84 Cunningham 45.54 33.65 .. .. 11.77 4.66 4.37 93.63 6.37 93.56 Dobell 35.11 41.35 .. .. 4.92 3.39 15.23 92.49 7.51 93.85 Eden-Monaro 38.78 45.27 .. .. 7.53 5.21 3.21 94.46 5.54 94.53 Farrer 23.75 57.81 .. .. 4.39 4.09 9.97 92.89 7.11 94.53 Fowler 60.76 26.76 .. .. 3.41 3.46 5.60 86.07 13.93 92.17 Gilmore 35.05 46.00 .. .. 9.30 6.31 3.34 94.83 5.17 94.27 Grayndler 47.20 24.70 .. .. 23.03 1.71 3.37 93.00 7.00 91.32 Greenway 44.48 40.04 .. .. 3.69 4.04 7.75 90.02 9.98 93.97 Hughes 32.07 54.68 .. .. 4.46 5.90 2.89 92.61 7.39 94.24 Hume 26.06 53.97 .. .. 5.73 4.41 9.83 93.68 6.32 94.96 Hunter 44.50 .. .. 35.11 5.89 7.62 6.88 93.46 6.54 94.52 Kingsford Smith 42.02 43.50 .. .. 9.79 1.87 2.82 91.37 8.63 92.01 Lindsay 39.03 46.64 .. .. 3.06 5.15 6.12 91.79 8.21 94.34 Lyne 21.28 .. .. 53.19 6.19 5.48 13.86 93.69 6.31 94.77 Macarthur 30.63 54.33 .. .. 4.62 5.78 4.63 92.17 7.83 94.17 Mackellar 17.24 62.43 .. .. 14.19 4.17 1.98 94.25 5.75 93.39 Macquarie 31.00 47.36 .. .. 11.10 4.15 6.39 94.37 5.63 94.64 McMahon 50.19 40.59 .. .. 2.93 3.48 2.82 88.65 11.35 93.58 Mitchell 20.52 65.47 .. .. 6.41 3.22 4.37 93.69 6.31 94.63 New England 11.86 .. .. 54.21 4.58 5.20 24.15 93.95 6.05 95.16 Newcastle 43.73 34.66 .. .. 12.00 4.11 5.49 93.80 6.20 93.58 North Sydney 20.04 61.04 .. .. 15.35 1.69 1.87 94.62 5.38 92.25 Page 38.79 .. .. 46.65 6.52 4.81 3.23 95.32 4.68 94.19 Parkes 20.80 .. .. 64.01 5.18 7.42 2.60 94.26 5.74 94.33 Parramatta 41.26 44.31 .. .. 5.29 2.18 6.96 89.48 10.52 91.37 Paterson 29.63 53.86 .. .. 6.67 6.26 3.58 94.83 5.17 94.60 Reid 40.57 47.11 .. .. 6.95 1.51 3.86 90.51 9.49 91.39 Richmond 33.51 .. .. 37.60 17.69 7.46 3.75 95.09 4.91 92.06 Riverina 20.43 .. .. 59.18 3.60 5.17 11.63 93.03 6.97 94.46 Robertson 34.83 43.42 .. .. 5.57 2.34 13.85 94.09 5.91 93.98 Shortland 48.69 37.81 .. .. 6.04 6.21 1.26 93.99 6.01 94.42 Sydney 46.03 30.52 .. .. 17.33 1.43 4.69 93.80 6.20 88.33 Throsby 45.00 27.84 .. 10.12 5.47 4.60 6.97 91.17 8.83 94.07 Warringah 19.32 60.89 .. .. 15.53 2.20 2.07 94.62 5.38 91.95 Watson 49.51 38.74 .. .. 5.28 2.49 3.98 86.05 13.95 90.68 Wentworth 19.37 63.32 .. .. 14.61 1.08 1.61 94.30 5.70 89.30 Werriwa 44.09 39.67 .. .. 3.27 4.35 8.63 87.13 12.87 92.49
Table 6b: House of Representatives: Electoral division summary (per cent)
continued
Per cent
First preference votes Formal Informal Total/
Division ALP LP LNP NP GRN PUP Others votes votes turnout
Victoria Aston 32.63 51.59 .. .. 5.88 3.76 6.14 95.47 4.53 94.73 Ballarat 41.91 38.00 .. .. 9.51 3.63 6.95 95.34 4.66 94.92 Batman 41.29 22.46 .. .. 26.40 2.53 7.32 94.24 5.76 91.60 Bendigo 36.56 39.67 .. 5.02 9.30 2.52 6.93 94.29 5.71 95.33 Bruce 41.90 42.96 .. .. 6.64 2.63 5.87 94.50 5.50 92.28 Calwell 49.81 28.49 .. .. 5.39 4.34 11.98 92.08 7.92 90.93 Casey 27.85 49.18 .. .. 10.89 4.98 7.10 95.38 4.62 94.95 Chisholm 39.50 44.12 .. .. 9.45 1.63 5.30 95.77 4.23 93.35 Corangamite 32.03 48.25 .. 0.64 11.86 2.18 5.03 95.57 4.43 95.54 Corio 43.51 35.20 .. .. 7.31 5.68 8.31 94.70 5.30 94.16 Deakin 32.73 45.88 .. .. 10.83 2.21 8.35 95.67 4.33 94.71 Dunkley 30.88 48.75 .. .. 9.32 4.22 6.83 95.21 4.79 93.29 Flinders 25.20 55.34 .. .. 9.74 6.00 3.72 95.03 4.97 93.74 Gellibrand 46.04 26.71 .. .. 16.73 3.91 6.61 94.38 5.62 90.61 Gippsland 23.15 .. .. 53.76 5.70 4.28 13.11 94.01 5.99 94.45 Goldstein 23.83 56.51 .. .. 15.90 2.26 1.50 96.67 3.33 93.17 Gorton 50.73 25.48 .. .. 6.39 5.98 11.42 92.89 7.11 92.21 Higgins 24.08 54.37 .. .. 16.80 1.59 3.16 96.42 3.58 92.01 Holt 48.19 32.63 .. .. 3.88 5.51 9.78 93.92 6.08 92.81 Hotham 47.13 37.14 .. .. 8.52 3.47 3.73 95.17 4.83 92.53 Indi 11.65 44.68 .. .. 3.42 2.71 37.54 94.91 5.09 95.11 Isaacs 41.33 40.21 .. .. 7.06 3.28 8.12 95.20 4.80 93.04 Jagajaga 38.00 41.94 .. .. 12.95 2.68 4.43 96.27 3.73 94.02 Kooyong 22.43 55.69 .. .. 16.58 1.60 3.69 96.61 3.39 93.46 La Trobe 32.06 46.05 .. .. 10.02 5.08 6.79 95.61 4.39 94.84 Lalor 45.17 29.26 .. .. 6.01 5.80 13.76 93.37 6.63 93.13 Mallee 17.50 27.22 .. 38.76 3.07 3.36 10.09 93.09 6.91 94.67 Maribyrnong 47.90 33.03 .. .. 9.90 2.74 6.43 93.82 6.18 91.54 McEwen 37.62 40.34 .. .. 7.10 6.74 8.20 95.38 4.62 94.79 McMillan 25.05 50.36 .. .. 7.62 4.66 12.31 93.89 6.11 94.64 Melbourne 26.60 22.83 .. .. 42.62 0.92 7.03 94.05 5.95 90.69 Melbourne Ports 31.67 41.05 .. .. 20.17 1.38 5.73 96.18 3.82 90.04 Menzies 25.66 58.88 .. .. 8.63 2.65 4.18 95.70 4.30 94.07 Murray 20.74 61.41 .. .. 3.93 3.34 10.58 93.67 6.33 94.55 Scullin 50.26 29.14 .. .. 7.49 6.62 6.49 93.57 6.43 93.27 Wannon 29.53 53.73 .. .. 6.43 3.99 6.33 96.01 3.99 95.61 Wills 45.14 22.84 .. .. 22.23 2.38 7.40 94.47 5.53 90.93
Table 6b: House of Representatives: Electoral division summary (per cent)
continued
Per cent
First preference votes Formal Informal Total/
Division ALP LP LNP NP GRN PUP Others votes votes turnout
Queensland Blair 41.55 .. 33.85 .. 4.25 12.41 7.93 94.33 5.67 94.44 Bonner 36.01 .. 46.80 .. 6.84 7.82 2.53 95.66 4.34 94.03 Bowman 29.88 .. 49.28 .. 5.98 12.71 2.15 95.49 4.51 94.92 Brisbane 30.12 .. 47.99 .. 14.34 4.19 3.36 96.12 3.88 92.73 Capricornia 37.04 .. 39.58 .. 3.43 7.95 12.01 94.85 5.15 94.83 Dawson 29.71 .. 46.23 .. 5.02 10.02 9.03 95.15 4.85 93.82 Dickson 31.32 .. 48.01 .. 6.42 9.79 4.46 95.74 4.26 94.89 Fadden 22.22 .. 53.61 .. 4.99 14.67 4.51 94.21 5.79 92.70 Fairfax 18.24 .. 41.32 .. 8.33 26.49 5.63 94.88 5.12 93.39 Fisher 20.93 .. 44.47 .. 7.59 17.42 9.60 94.19 5.81 93.52 Flynn 33.44 .. 46.02 .. 2.21 9.25 9.09 94.76 5.24 94.65 Forde 34.00 .. 42.54 .. 4.17 12.45 6.84 92.73 7.27 92.60 Griffith 40.36 .. 42.22 .. 10.18 3.36 3.87 95.24 4.76 93.14 Groom 22.10 .. 55.64 .. 4.34 9.35 8.57 96.01 3.99 94.57 Herbert 29.38 .. 43.34 .. 5.24 8.88 13.15 94.07 5.93 93.36 Hinkler 27.60 .. 44.75 .. 2.72 17.65 7.28 95.08 4.92 94.53 Kennedy 16.38 .. 40.84 .. 3.24 7.63 31.91 94.57 5.43 92.26 Leichhardt 32.57 .. 45.26 .. 6.59 8.55 7.03 94.55 5.45 91.28 Lilley 40.21 .. 41.32 .. 7.67 6.87 3.93 95.43 4.57 94.25 Longman 30.65 .. 44.84 .. 3.94 12.79 7.78 94.93 5.07 93.85 Maranoa 16.29 .. 57.42 .. 3.07 13.91 9.31 95.61 4.39 94.40 McPherson 22.75 .. 50.16 .. 6.86 15.92 4.31 94.79 5.21 92.61 Moncrieff 20.82 .. 55.69 .. 6.45 13.68 3.36 94.27 5.73 91.05 Moreton 38.73 .. 42.24 .. 9.99 5.03 4.02 94.38 5.62 92.67 Oxley 43.10 .. 38.44 .. 5.38 7.10 5.98 93.08 6.92 93.55 Petrie 39.52 .. 40.65 .. 4.52 10.20 5.11 94.80 5.20 93.69 Rankin 42.18 .. 36.37 .. 5.29 11.09 5.06 93.44 6.56 92.26 Ryan 25.51 .. 51.68 .. 14.44 4.97 3.40 96.75 3.25 94.12 Wide Bay 20.71 .. 48.87 .. 6.55 15.88 7.99 95.32 4.68 94.21 Wright 21.39 .. 47.84 .. 5.40 14.48 10.89 94.97 5.03 94.07
Table 6b: House of Representatives: Electoral division summary (per cent)
continued
Per cent
First preference votes Formal Informal Total/
Division ALP LP LNP NP GRN PUP Others votes votes Turnout
Western Australia Brand 40.39 38.71 .. .. 7.30 7.50 6.09 94.29 5.71 92.26 Canning 26.64 51.07 .. 1.93 7.40 6.88 6.08 94.48 5.52 92.01 Cowan 32.29 49.59 .. .. 7.91 5.33 4.87 94.90 5.10 93.14 Curtin 17.91 62.06 .. .. 15.31 2.64 2.08 96.75 3.25 92.93 Durack 20.28 38.01 .. 23.16 7.06 6.75 4.73 93.61 6.39 87.06 Forrest 25.26 49.92 .. 6.25 9.52 5.03 4.01 94.37 5.63 93.38 Fremantle 40.82 38.14 .. .. 11.89 3.96 5.20 93.64 6.36 92.19 Hasluck 32.74 45.42 .. .. 7.63 6.86 7.35 94.32 5.68 92.34 Moore 26.01 53.08 .. .. 9.95 6.69 4.27 95.49 4.51 92.44 O'Connor 17.25 39.13 .. 25.35 6.82 4.34 7.11 94.06 5.94 92.27 Pearce 25.88 45.67 .. 4.91 11.23 7.47 4.85 94.10 5.90 92.50 Perth 41.25 39.81 .. .. 10.61 3.49 4.83 94.72 5.28 91.94 Stirling 28.33 51.82 .. .. 11.27 4.02 4.56 94.34 5.66 91.45 Swan 30.60 48.86 .. .. 11.55 4.23 4.75 94.37 5.63 91.02 Tangney 24.33 57.17 .. .. 10.42 4.38 3.70 95.83 4.17 93.85 South Australia Adelaide 42.26 42.06 .. .. 10.12 2.12 3.44 96.04 3.96 92.47 Barker 18.37 52.61 .. 4.35 5.65 3.92 15.11 94.62 5.38 94.62 Boothby 30.77 50.35 .. .. 11.97 3.01 3.91 96.52 3.48 93.92 Grey 27.30 55.65 .. .. 3.71 5.03 8.31 94.60 5.40 93.01 Hindmarsh 37.95 46.17 .. .. 8.84 2.47 4.57 95.12 4.88 93.05 Kingston 49.26 32.40 .. .. 6.89 4.22 7.23 94.93 5.07 93.80 Makin 45.56 37.20 .. .. 5.91 4.15 7.18 95.12 4.88 93.98 Mayo 21.14 53.82 .. .. 14.15 3.76 7.14 96.13 3.87 94.60 Port Adelaide 50.58 26.32 .. .. 8.61 5.74 8.75 93.80 6.20 92.17 Sturt 28.90 54.40 .. .. 9.80 2.99 3.92 95.48 4.52 93.45 Wakefield 41.52 37.89 .. .. 5.15 4.28 11.15 94.31 5.69 93.11 Tasmania Bass 34.65 47.85 .. .. 7.90 5.39 4.21 95.82 4.18 94.42 Braddon 37.59 46.86 .. .. 5.17 9.29 1.10 96.45 3.55 95.35 Denison 24.75 23.23 .. .. 7.92 2.43 41.67 95.78 4.22 94.26 Franklin 39.93 38.71 .. .. 12.18 6.10 3.08 96.23 3.77 95.09 Lyons 36.82 44.39 .. .. 8.32 7.03 3.44 95.54 4.46 94.53
Australian Capital Territory
Canberra 41.06 37.87 .. .. 12.67 3.21 5.19 96.06 3.94 94.79
Fraser 44.66 31.62 .. .. 14.07 2.44 7.21 96.27 3.73 94.50
Northern Territory (a)
Lingiari 39.75 38.23 .. .. 7.76 4.17 10.09 92.57 7.43 75.42
Solomon 35.43 44.69 .. .. 7.99 5.04 6.85 94.70 5.30 89.31
Table 7: House of Representatives: Electoral division detail
Adelaide (SA)
Candidate Party Votes % Swing
First count LAZAROU, L SAL 980 1.07 +0.18 ELLIS, K * ALP 38 650 42.26 -1.52 SCALI, V PUP 1 943 2.12 +2.12 GARCIA, C LP 38 463 42.06 +4.31 LEE, P FFP 2 169 2.37 +0.18 BEACH, R GRN 9 251 10.12 -3.50 Final count ELLIS, K * ALP 49 338 53.95 -3.57 GARCIA, C LP 42 118 46.05 +3.57 Formal 91 456 96.04 +0.86 Informal 3 770 3.96 -0.86 Total/turnout 95 226 92.47 -0.61 Enrolled 102 976 Aston (Vic)
Candidate Party Votes % Swing
First count EVANS, R ALP 27 850 32.63 -6.71 SPEER, J RUA 581 0.68 +0.68 RAYMOND, S GRN 5 017 5.88 -3.89 TUDGE, A * LP 44 030 51.59 +6.04 WATT, B PUP 3 206 3.76 +3.76 FOSTER, T FFP 2 362 2.77 -1.89 JENKINS, C ASXP 2 295 2.69 +2.15 Final count EVANS, R ALP 35 669 41.80 -7.53 TUDGE, A * LP 49 672 58.20 +7.53 Formal 85 341 95.47 +0.04 Informal 4 047 4.53 -0.04 Total/turnout 89 388 94.73 -0.22 Enrolled 94 357 Ballarat (Vic)
Candidate Party Votes % Swing
First count FOSTER, A AUC 1 139 1.22 +1.22 ROJAS, A RUA 229 0.24 +0.24 DUNNE, S KAP 849 0.91 +0.91 MATHIESON, J ASXP 2 135 2.28 +2.28 HODGINS-MAY, S GRN 8 911 9.51 -1.83 FITZGIBBON, J LP 35 592 38.00 +4.05 VEREKER, S DLP 1 022 1.09 +1.09 MURPHY, G PUP 3 396 3.63 +3.63 CLARK, S FFP 1 139 1.22 -1.74 KING, C * ALP 39 251 41.91 -9.84 Final count FITZGIBBON, J LP 42 252 45.11 +6.81 KING, C * ALP 51 411 54.89 -6.81 Formal 93 663 95.34 -0.94 Informal 4 578 4.66 +0.94 Total/turnout 98 241 94.92 +0.12 Enrolled 103 500 Banks (NSW)
Candidate Party Votes % Swing
First count MELHAM, D * ALP 34 835 41.04 -1.92 WELLHAM, J PUP 2 125 2.50 +2.50 KHEDR, S IND 768 0.90 +0.90 RICHARDSON, R KAP 553 0.65 +0.65 SPIGHT, P GRN 4 242 5.00 -4.61 FALANGA, M CDP 1 983 2.34 +2.34 HADDAD, R DLP 470 0.55 +0.55 COLEMAN, D LP 39 899 47.01 +1.49 Final count MELHAM, D * ALP 40 885 48.17 -3.28 COLEMAN, D LP 43 990 51.83 +3.28 Formal 84 875 90.05 -1.58 Informal 9 374 9.95 +1.58 Total/turnout 94 249 92.87 +0.17 Enrolled 101 490