PAC: Pattern-driven Application Consolidation for
Efficient Cloud Computing
Zhenhuan Gong, Xiaohui Gu
Department of Computer ScienceNorth Carolina State University {zgong}@ ncsu.edu,{gu}@ csc.ncsu.edu
Abstract—To reduce cloud system resource cost, application consolidation is a must. In this paper, we present a novel pattern-driven application consolidation (PAC) system to achieve efficient resource sharing in virtualized cloud computing infrastructures. PAC employs signal processing techniques to dynamically dis-cover significant patterns called signatures of different applica-tions and hosts. PAC then performs dynamic application consol-idation based on the extracted signatures. We have implemented a prototype of the PAC system on top of the Xen virtual machine platform and tested it on the NCSU Virtual Computing Lab. We have tested our system using RUBiS benchmarks, Hadoop data processing systems, and IBM System S stream processing system. Our experiments show that 1) PAC can efficiently discover repeating resource usage patterns in the tested applications; 2) Signatures can reduce resource prediction errors by 50-90% compared to traditional coarse-grained schemes; 3) PAC can improve application performance by up to 50% when running a large number of applications on a shared cluster.
I. INTRODUCTION
Cloud computing [1], [5] allows users to lease comput-ing resources in a pay-as-you-go fashion without maintaincomput-ing complex infrastructures themselves. Different from traditional distributed resource provisioning infrastructures, cloud sys-tems grant users with direct but shared accesses to system resources and charge users for the exact resources and services they use (e.g., in terms of resource usage time).
To reduce the resource cost of the cloud system, application consolidation is a must in order to host a large number of applications on a common physical computing infrastructure. However, without considering fine-grained resource usage pat-terns of different applications, cloud systems are forced to either over-provision or under-provision resources. Resource over-provisoning will incur resource waste to the cloud system while resource under-provisioning will cause service level ob-jective (SLO) violations to cloud applications. Thus, we need to provide more efficient resource control to minimize both resource over-provisioning and under-provisioning in cloud systems.
In this paper, we present the design and implementation of a novel Pattern-driven Application Consolidation (PAC) system for virtualized cloud computing infrastructures. PAC performs continuous monitoring of all running virtual machines (VMs) hosting different applications to capture fine-grained resource usage information using time series. PAC dynamically extracts significant patterns called signatures of different VMs. PAC then performs dynamic pattern-driven VM placement based on the extracted resource usage signatures. PAC provides both
periodical global application consolidation to achieve load balancing in the cloud system and on-demand application relocation using live VM migration [12] to alleviate overloaded hosts.
However, pattern-driven resource management is challeng-ing for two major reasons. First, we should not make prior as-sumptions about the signatures of different cloud applications (e.g., signature length) in order to achieve general applicability. Moreover, signatures of dynamic applications may evolve over time. Second, signature discovery and matching algorithms must be light-weight in order to avoid imposing significant overhead to the cloud system.
To address the challenge, PAC employs signal processing techniques to perform signature extraction and matching. First, PAC uses Fast Fourier Transform (FFT) to extract repeating signature patterns from raw time series measurements. Second, PAC achieves robust signature matching using the dynamic time warping (DTW) algorithm [31]. PAC can find good matching between two signature patterns even if one of them is shifted in the time dimension. This is particularly important for matching time series patterns in asynchronous distributed systems. For scalability, PAC applies time series indexing scheme to achieve fast signature matching.
We have implemented the PAC system on top of the Xen platform [6] and conducted experiments on the Virtual Com-puting Lab (VCL) [5], a production virtualized comCom-puting en-vironment. We conducted extensive experiments using RUBiS benchmarks [3], Hadoop data processing systems [2], and IBM System S stream processing system [23], [15]. Our experi-ments reveal several interesting findings. First, we observe that real applications do exhibit repeating resource usage patterns. PAC can efficiently discover and extract those patterns. PAC can achieve much higher signature detection rate than static signature extraction schemes. Second, using signatures, PAC can predict future resource demands with 50-90% less errors than conventional approaches (e.g., mean, max, histogram). Third, PAC can greatly improve application performance (e.g., response time) when running a large number of applications on a shared cluster than other alternative placement schemes (e.g., mean value, histogram, correlation based placement al-gorithms). Our prototype implementation shows that PAC is feasible for production cluster systems, which imposes little overhead and requires short execution time.
The rest of the paper is organized as follows. Section II presents the system model. Section III presents the design and
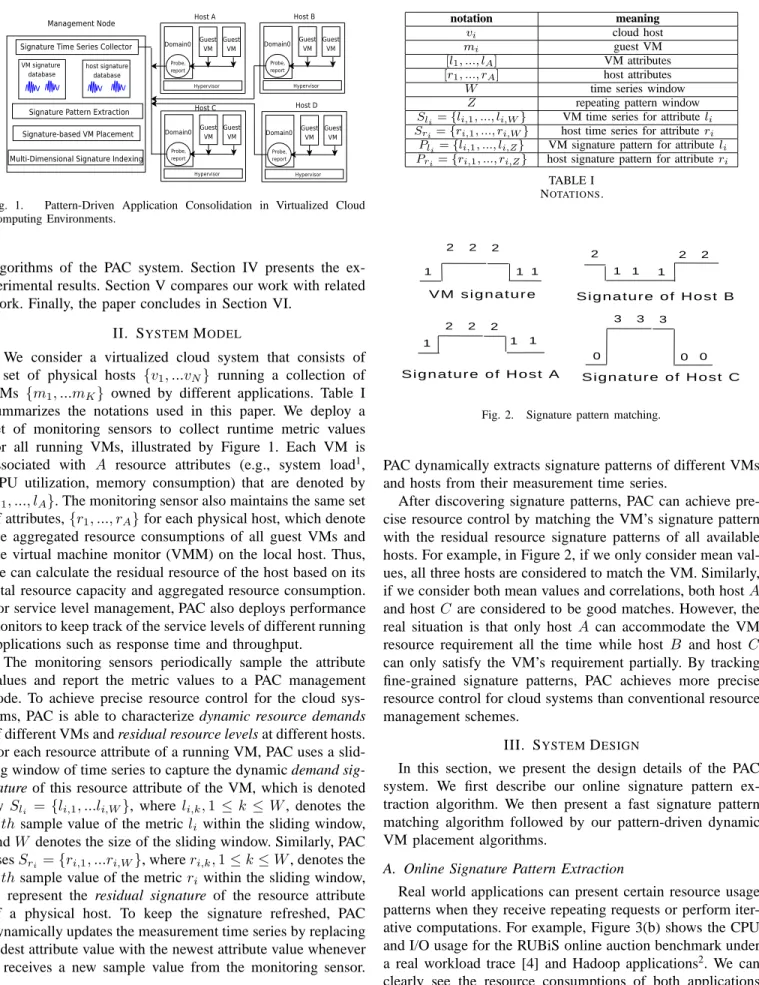
Fig. 1. Pattern-Driven Application Consolidation in Virtualized Cloud Computing Environments.
algorithms of the PAC system. Section IV presents the ex-perimental results. Section V compares our work with related work. Finally, the paper concludes in Section VI.
II. SYSTEMMODEL
We consider a virtualized cloud system that consists of a set of physical hosts {v1, ...vN} running a collection of VMs {m1, ...mK} owned by different applications. Table I summarizes the notations used in this paper. We deploy a set of monitoring sensors to collect runtime metric values for all running VMs, illustrated by Figure 1. Each VM is associated with A resource attributes (e.g., system load1, CPU utilization, memory consumption) that are denoted by {l1, ..., lA}. The monitoring sensor also maintains the same set of attributes,{r1, ..., rA}for each physical host, which denote the aggregated resource consumptions of all guest VMs and the virtual machine monitor (VMM) on the local host. Thus, we can calculate the residual resource of the host based on its total resource capacity and aggregated resource consumption. For service level management, PAC also deploys performance monitors to keep track of the service levels of different running applications such as response time and throughput.
The monitoring sensors periodically sample the attribute values and report the metric values to a PAC management node. To achieve precise resource control for the cloud sys-tems, PAC is able to characterize dynamic resource demands of different VMs and residual resource levels at different hosts. For each resource attribute of a running VM, PAC uses a slid-ing window of time series to capture the dynamic demand sig-nature of this resource attribute of the VM, which is denoted by Sli = {li,1, ...li,W}, where li,k,1 ≤k ≤W, denotes the
k′thsample value of the metricl
iwithin the sliding window, andW denotes the size of the sliding window. Similarly, PAC usesSri={ri,1, ...ri,W}, whereri,k,1≤k≤W, denotes the
k′thsample value of the metricr
i within the sliding window, to represent the residual signature of the resource attribute of a physical host. To keep the signature refreshed, PAC dynamically updates the measurement time series by replacing oldest attribute value with the newest attribute value whenever it receives a new sample value from the monitoring sensor.
1Standard Linux OS loadavg is used which denotes the number of jobs in
the run queue or waiting for disk I/O in the guest VM.
notation meaning
vi cloud host
mi guest VM
[l1, ..., lA] VM attributes [r1, ..., rA] host attributes
W time series window
Z repeating pattern window
Sli={li,1, ..., li,W} VM time series for attributeli
Sri={ri,1, ..., ri,W} host time series for attributeri
Pli={li,1, ..., li,Z} VM signature pattern for attributeli
Pri={ri,1, ..., ri,Z} host signature pattern for attributeri
TABLE I NOTATIONS. V M s i g n a t u r e 1 2 2 2 1 1 S i g n a t u r e o f H o s t A 1 2 2 2 1 1 S i g n a t u r e o f H o s t B 2 2 1 1 1 2 S i g n a t u r e o f H o s t C 0 3 3 3 0 0
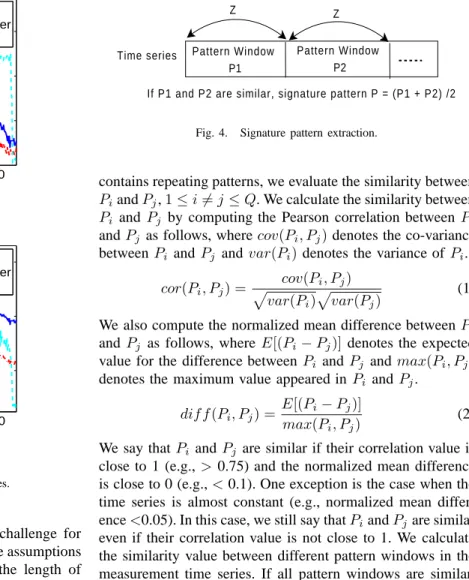
Fig. 2. Signature pattern matching.
PAC dynamically extracts signature patterns of different VMs and hosts from their measurement time series.
After discovering signature patterns, PAC can achieve pre-cise resource control by matching the VM’s signature pattern with the residual resource signature patterns of all available hosts. For example, in Figure 2, if we only consider mean val-ues, all three hosts are considered to match the VM. Similarly, if we consider both mean values and correlations, both hostA and hostC are considered to be good matches. However, the real situation is that only host A can accommodate the VM resource requirement all the time while host B and host C can only satisfy the VM’s requirement partially. By tracking fine-grained signature patterns, PAC achieves more precise resource control for cloud systems than conventional resource management schemes.
III. SYSTEMDESIGN
In this section, we present the design details of the PAC system. We first describe our online signature pattern ex-traction algorithm. We then present a fast signature pattern matching algorithm followed by our pattern-driven dynamic VM placement algorithms.
A. Online Signature Pattern Extraction
Real world applications can present certain resource usage patterns when they receive repeating requests or perform iter-ative computations. For example, Figure 3(b) shows the CPU and I/O usage for the RUBiS online auction benchmark under a real workload trace [4] and Hadoop applications2. We can clearly see the resource consumptions of both applications
800 1600 2400 3200 0 20 40 60 Time (seconds) CPU Usage (%)
RUBiS Web Server RUBiS Database Server Hadoop
(a) CPU trace
800 1600 2400 3200 102 104 106 Time (seconds) Network I/O (Kbps)
RUBiS Web Server RUBiS Database Server Hadoop
(b) Network I/O trace
Fig. 3. Real application resource usage traces.
present significant patterns. However, the real challenge for online signature extraction is that we cannot make assumptions about the properties of the signature such as the length of the repeating pattern. Moreover, dynamic workload signatures may vary over time, which makes signature discovery a non-trivial task.
We develop automatic signature pattern extraction tech-niques using signal processing techtech-niques, illustrated by Fig-ure 4. PAC can discover i) whether a workload presents repeating patterns; and ii) what is the dominating patterns if repeating patterns exist. PAC employs Fast Fourier Trans-form (FFT) to calculate dominating variation frequencies in the collected measurement time series. Given a measurement time series, FFT transforms the time series into a vector of frequency components. The Fourier coefficients represent the amplitude of each frequency. PAC can then identify the dominant frequencies by calculating the signal power at each frequency. If there are multiple dominating frequencies that have similar amplitude, PAC selects the lowest dominating frequencyfd to discover the longest signature pattern.
After we discover the dominating frequency fd, we derive the pattern window size (Z) using the inverse offd, that isZ= 1/fd×riwhereridenotes the resource sampling rate. We then split the original time seriesL={l1, ..., lW}intoQ= [W/Z] pattern windows: P1 ={l1, ..., lZ}, P2 ={lZ+1, ..., l2Z}, ..., PQ = {l(Q−1)Z, ..., li,W}. To detect whether the time series
Time series Pattern Window P1
Z = 1/ dominating frequency*sampling rate
Z Z
Pattern Window P2
If P1 and P2 are similar, signature pattern P = (P1 + P2) /2
Fig. 4. Signature pattern extraction.
contains repeating patterns, we evaluate the similarity between PiandPj,1≤i6=j≤Q. We calculate the similarity between Pi and Pj by computing the Pearson correlation betweenPi andPj as follows, wherecov(Pi, Pj)denotes the co-variance betweenPi andPj andvar(Pi)denotes the variance ofPi.
cor(Pi, Pj) = cov(Pi, Pj) p var(Pi) p var(Pj) (1) We also compute the normalized mean difference betweenPi andPj as follows, whereE[(Pi−Pj)] denotes the expected value for the difference betweenPi andPj andmax(Pi, Pj) denotes the maximum value appeared inPi andPj.
dif f(Pi, Pj) =
E[(Pi−Pj)] max(Pi, Pj)
(2) We say thatPi andPj are similar if their correlation value is close to 1 (e.g.,>0.75) and the normalized mean difference is close to 0 (e.g.,<0.1). One exception is the case when the time series is almost constant (e.g., normalized mean differ-ence<0.05). In this case, we still say thatPiandPjare similar even if their correlation value is not close to 1. We calculate the similarity value between different pattern windows in the measurement time series. If all pattern windows are similar, we say that the application’s resource usage presents repeating patterns. In this case, we derive the signature pattern using the average value of all repeating windows. Otherwise, we say that the application’s resource usage does not present significant patterns. PAC then degenerates to conventional schemes that use simple statistics such as mean to represent the signature of a VM. We can apply the similar signature extraction process on the host’s residual resource time series.
In dynamic computing environments, we cannot assume signature patterns do not change over time. To maintain sus-tained accuracy of extracted signatures, PAC performs adaptive signature pattern extraction to adapt to evolving signature patterns. If the current signature is still valid, we should be able to predict future resource values using the signature. Thus, we can infer that the signature becomes obsolete if the system makes several consecutive mis-predictions. Under those circumstances, PAC triggers the signature extraction process to extract a new signature.
B. Fast Signature Pattern Matching
After extracting signature patterns, PAC needs to perform similarity matching between the signatures of VM resource usages and the signatures of residual resources on different
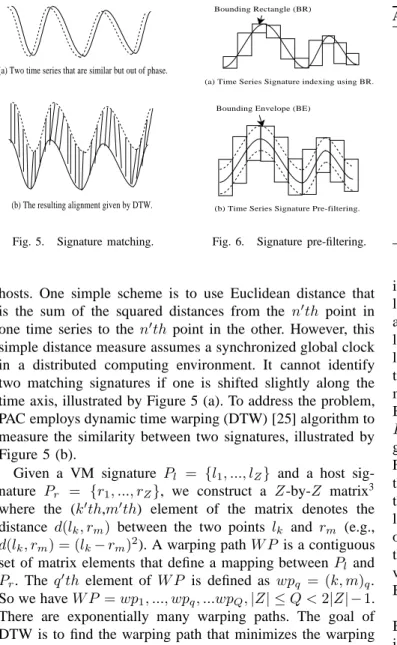
(a) Two time series that are similar but out of phase.
(b) The resulting alignment given by DTW.
Fig. 5. Signature matching.
(b) Time Series Signature Pre-filtering. (a) Time Series Signature indexing using BR.
Bounding Rectangle (BR)
Bounding Envelope (BE)
Fig. 6. Signature pre-filtering.
hosts. One simple scheme is to use Euclidean distance that is the sum of the squared distances from the n′th point in
one time series to the n′th point in the other. However, this
simple distance measure assumes a synchronized global clock in a distributed computing environment. It cannot identify two matching signatures if one is shifted slightly along the time axis, illustrated by Figure 5 (a). To address the problem, PAC employs dynamic time warping (DTW) [25] algorithm to measure the similarity between two signatures, illustrated by Figure 5 (b).
Given a VM signature Pl = {l1, ..., lZ} and a host sig-nature Pr = {r1, ..., rZ}, we construct a Z-by-Z matrix3 where the (k′th,m′th) element of the matrix denotes the
distance d(lk, rm) between the two points lk and rm (e.g., d(lk, rm) = (lk−rm)2). A warping pathW P is a contiguous set of matrix elements that define a mapping betweenPland Pr. The q′th element of W P is defined as wpq = (k, m)q. So we haveW P =wp1, ..., wpq, ...wpQ,|Z| ≤Q <2|Z| −1. There are exponentially many warping paths. The goal of DTW is to find the warping path that minimizes the warping cost. Dynamic programming is used to find the minimum cost warping path. We say that two signatures are similar if DTW returns a small warping cost. More details about the DTW algorithm can be found in [25]. DTW has time and space complexity of O(Z2), whereZ is the number of points included in the signature pattern.
Although DTW provides excellent time series similarity matching performance, it is computation-intensive. To sup-port large-scale cloud systems, PAC adapts an existing multi-dimensional time series indexing scheme [34] to speedup the signature pattern matching process and support multi-attribute signature pattern matching. The basic idea is to employ a fast pre-filtering step to eliminate the majority of dissimilar signa-tures and execute costly DTW algorithm only on potentially matching signatures. PAC constructs the index for a multi-attribute signature patternPas follows, which is illustrated by Figure 6 (a). For clarity, Figure 6 only gives a one-dimensional signature pattern example. First, PAC splits the time series
3If two signatures have different lengths, we extend the shorter signature
based on its pattern to become the same length with the longer signature.
Algorithm 1 Periodical global VM consolidation in PAC Extract resource demand signatures for all VMs
Sort all VMs using weighed average of resource demands for each VM in decreasing order do
Select qualified hosts using qualifying functions if qualified hosts exist then
Choose the best fit host using DTW Place the VM on that host
Update the residual resource signature of the host else
Place the VM on the least loaded host end if
end for
into a sequence of segments based on a pre-defined segment length (e.g., 10 measurement points). PAC then constructs a small Bounding Rectangles (BRs) for each segment. The lowest and highest values within the segment are taken as the lower bound and upper bound of the BR respectively. If the time series is multi-dimensional, the corresponding BR is also multi-dimensional. The coordinates of those multi-dimensional BRs are stored into a R-tree4. Given a VM signature pattern
Pl, PAC first constructs a Bounding Envelop (BE) aroundPl given a pre-defined range of possible matching, illustrated by Figure 6 (b). Suppose the matching range is set as 2%. PAC then scales up the time series by 2% to get the upper-bound of the BE and then scales down the time series by 2% to get the lower-bound of the BE. PAC then splits the BE into a sequence of segments and constructs a set of BRs for all segments. In this case, the BR is formed by taking the lowest and highest values in the BE as the lower bound and upper bound of the BR, respectively.
The system then performs pre-filtering by calculating the BR intersections with the BRs of those host signatures stored in the R-trees. We say that a BR of the VM signature can be matched by the BR of a host signature if the lower-bound of the VM BR is lower than the upper-lower-bound of the host BR. A qualifying function is defined in which a host signature is considered to be qualified if the BR matching is larger than a certain threshold (e.g., 80% BRs of the host signature matches the BRs of the VM signature). Qualifying functions for different attributes (e.g., CPU, memory, disk) can be defined separately. We say that a multi-dimensional host signature is qualified for a multi-dimensional VM signature if the qualifying functions for all dimensions return positive results. Only on those qualified host signatures, the DTW algorithm is performed to find the best match. Note that the pre-filtering algorithm is much faster than DTW, which has linear time and space complexity ofO(Z).
C. Pattern-driven Dynamic VM Placement
PAC performs pattern-driven dynamic VM placement, which consists of two parts: 1) periodical global VM
consoli-4R-trees are tree data structures that are similar to B-trees, but are used for
dation for global system load balancing; and 2) on-demand VM relocation that employs live VM migration [12] to dynamically relocate a VM to a different host when PAC detects overloaded hosts or discovers a better host for the VM due to signature pattern changes.
The goal of periodical global VM consolidation is to pro-duce an optimal (or near optimal) VM placement plan based on current signature patterns of all running VMs. Similar to previous work, we formulate the VM placement problem into a bin-packing problem. However, different from previous approaches, PAC uses signature patterns to assign VMs to different hosts. Since bin-packing is a well-known NP-hard problem, we develop a greedy heuristic algorithm to solve the problem. PAC first sorts all VMs by their average resource demands in decreasing order. In the case of multiple resource attributes, the normalized average of all attributes is used as aggregated resource demands of a single VM [21]. Note that the normalized average is only used in the stage of sorting to estimate the total resource demand of a VM. After all VMs have been sorted, PAC starts from the VM with the largest resource demand and places VMs one by one5 until we place all VMs. The residual resource of a host will be updated accordingly when a new VM is assigned to the host. In each step, PAC considers CPU, memory and network resources respectively to find the host whose residual resource signatures best match the VM resource demand signatures using Algorithm 1 and places the VM on that host. If two signature patterns have different length, we first extend the shorter signature by repeating it or part of it to match the length of the longer signature.
In addition to periodical global VM consolidation, PAC may dynamically relocate a VM when it detects overloaded hosts or discovers a better host for running the VM because of the VM’s signature pattern changes. We define a host to be overloaded when the total resource consumption of the host exceeds a certain threshold (e.g., >90%). In this case, PAC relocates the VM with the largest resource consumption from the overloaded host to a more suitable host. Since VMs running on the overloaded host will not get enough resources, the resource usage information we record on the overloaded host may not accurately reflect the real resource demand of the VM. Thus, PAC first places the VM on a lightly loaded host to get its accurate signature. Then, PAC performs a similarity match between the VM’s signature and the signatures of all available hosts to find a suitable host for the VM. If PAC finds a better hostvj to run the VMmk than the current host vi, a VM relocation action will be triggered. PAC sends a relocation request to the hypervisor on vi to perform a live migration ofmk fromvi tovj. During the live migration, the signature patterns of bothvi andvj are marked as “unstable” since both hosts’ signature patterns will be perturbed by the on-going VM relocation action. PAC will update the signature patterns of vi andvj after the live migration is done.
5When we consider an empty host, the residual resource signature for the
host will be a constant time series. PAC can handle this case since the signature pattern matching algorithm can handle constant time series.
IV. EXPERIMENTALEVALUATION
We have implemented the PAC system on top of the Xen VM platform [6] and conducted extensive experiments on the NCSU Virtual Computing Lab (VCL) [5] using real server applications. In this section, we first describe our experiment setup. We then present our experimental results.
A. Experiment Setup
Our experiments are conducted on the VCL, a production virtualized computing infrastructure consisting of about 600 blade servers. VCL operates in a similar way as Amazon EC2 [1]. Our experiments used a cluster of 20 VCL hosts running 40 to 100 VMs. Each VCL host runs CentOS 5.2 64-bit with Xen 3.0.3. The VMs deployed on those hosts also run CentOS 5.2 64-bit. Each VCL host has Intel Dual Core Xeon CPU 3GHz, 4GB memory, and 30GB disk. We deploy the management node on one server host with Intel Quad Core Xeon CPU 2GHz, 16GB memory, 50GB disk, running RedHat Enterprise Linux. The management node runs the major signature extraction and matching algorithms to dynamically choose suitable hosts to run different VMs. It periodically scans the signature database to perform match-making between different VMs and hosts.
To achieve live migration of Xen VMs [12], we setup an NFS server to hold all VM disk images. The overhead of live VM migration is kept low. For example, it only takes about 12 to 20 seconds for a VM with 512MB memory space to be migrated from one host to another. Since PAC applies live migration, the application service downtime is less than one second regardless of the size of the VM memory.
PAC considers three resource metrics including CPU, mem-ory, and I/O throughput to make the dynamic VM placement decision. Each host continuously measures CPU, memory, and I/O consumptions for all VMs using the libxenstat libraries. The resource information is sampled and reported to the management node every 10 seconds. As all VM images are held in the NFS server, all disk I/O accesses will be transferred into network I/O accesses. VMs are assigned with fixed size of memory. Each VM running the RUBiS Web server is assigned with 800MB memory. Each VM running the RUBiS database server is assigned with 400MB memory. Each VM running the Hadoop system is assigned with 800MB memory.
Our experiments use three real server applications: 1) RU-BiS (PHP version), an online auction benchmark [3], 2) Hadoop, an open source implementation of MapReduce data processing system [2], and 3) IBM System S, a commercial high performance data stream processing system [23], [15]. Realistic input workloads are used to drive those applications: 1) For RUBiS, we used the workload intensity observed in a real-world workload trace to modulate the request rate of our synthetic workload. To do this, we started with the two week period beginning at 1995-08-28:00.00 from the ClarkeNet web server available at the IRCache Internet traffic archive [4]. We calculated the number of requests produced every hour to form a time-varying series of request rates, and scaled the RUBiS workload to match the time series. To speed up the
800 1600 2400 3200 0 50 100 Real Value Signature (2.5%) 800 1600 2400 3200 0 50 100 CPU Usage (%) Real Value Mean Value (9%) 800 1600 2400 3200 0 50 100 Real Value Max Value (19.6%) 800 1600 2400 3200 0 50 100 Time (seconds) Real Value Histogram (12.5%)
(a) RUBiS web server
800 1600 2400 3200 0 50 100 Real Value Signature (3.2%) 800 1600 2400 3200 0 50 100 CPU Usage (%) Real Value Mean Value (5.6%) 800 1600 2400 3200 0 50 100 Real Value Max Value (15.1%) 800 1600 2400 3200 0 50 100 Time (seconds) Real Value Histogram (7.1%)
(b) RUBiS database server
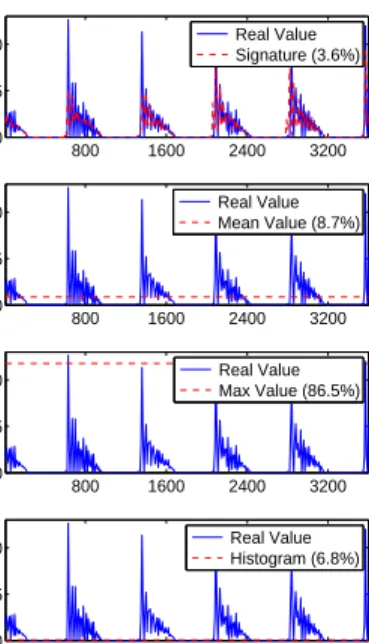
800 1600 2400 3200 0 5 10 Real Value Signature (3.6%) 800 1600 2400 3200 0 5 10 Network I/O (Mbps) Real Value Mean Value (8.7%) 800 1600 2400 3200 0 5 10 Real Value Max Value (86.5%) 800 1600 2400 3200 0 5 10 Time (seconds) Real Value Histogram (6.8%) (c) Hadoop Fig. 7. Resource usage traces and prediction comparison for RUBiS and Hadoop. The mean prediction errors are shown in the legend.
experiments, the workload generator used the request rate for each hour in the real trace to determine how many requests to generate for each 40 seconds period in our experiments. The average load produced is 30 requests/sec and the peak load is 45 requests/sec. The performance metrics of RUBiS (e.g., response time) are maintained by the client emulator; 2) For Hadoop, we run three sample applications provided by Hadoop including word count, sorting and grep; 3) For System S, we run a sample application provided by the System S, that is a fruit supplier selection application based on the weather information. The performance metrics of Hadoop and System S (e.g., job completion time) are maintained by the VMs running the applications.
To validate the prediction accuracy of the signature ex-traction algorithm, we implemented the following prediction algorithms for comparison: 1) mean value prediction that pre-dicts resource demand based on the average resource demand using recent historic data; 2) max value prediction that predicts resource demand using recent peak resource usage; and 3) histogram prediction that constructs histograms for recent re-source demand data. It chooses the bin with the largest number of values and uses the average of those values as the predicted value. For all algorithms, we use the same number of samples (e.g., 512) to predict the next 360 samples that corresponding to one hour of measurements since the global consolidation is performed every hour. We compare the mean prediction error (i.e., the difference between the predicted value and the true value normalized by the maximum possible value) under different algorithms.
We implemented the following common alternative VM placement algorithms for comparison: 1) The Histogram al-gorithm denotes a statistical alal-gorithm. Histograms are con-structed for historical resource usage by counting the fre-quency of metric value falling into different value ranges (i.e., different bins). To find the best matching host for different VMs, we calculate a matching score between the VM resource demand histograms and residual resource histograms of dif-ferent hosts. The matching score is the weighted sum of the difference for every bin in the histogram6. We choose the node that has the smallest positive matching score as the best-fit host to execute the VM; 2) The mean value based algorithm denotes a VM placement algorithm based on the average value of VM resource demands and residual resources on hosts. First, the system selects hosts that have mean residual resource higher than the mean value of the VM’s resource requirement. Among all the qualified hosts, we select the host whose mean residual resource is closest to the mean value of the VM’s resource requirement; 3) The max value based algorithm denotes a VM placement algorithm based on the maximum value of VM resource demands (i.e., peak load). A host is said to math the VM if the maximum value of resource requirement of the VM is lower than the mean value of the host’s residual resource; and 4) The correlation based algorithm [33] denotes that all VMs are placed based on the mean values and correlation values (Equation 1) between the VM’s resource usage time
6We assign higher weights to the bins representing larger value range since
the positive difference at larger value range weighs more than the positive difference at lower range value for resource satisfaction.
series and the host’s residual resource time series. First, the system selects hosts that have mean residual resource higher than the mean value of the VM resource requirement. Among the qualified hosts, the system selects the host whose available resource has the highest correlation with the VM’s resource requirement.
B. Results and Analysis
We first evaluate the efficiency of our signature extraction algorithm using realistic application workloads. We extract the signature patterns using the algorithm described in Sec-tion III-A. The solid lines in Figure 7 show the true CPU and I/O usage traces for a subset of applications used in our experiments. Figure 7(a) and Figure 7(b) show one hour snap-shot of both real and predicted CPU usage traces for RUBiS web server and database server, respectively. Figure 7(c) shows one hour snapshot of both real and predicted network I/O traces for the Hadoop cluster. The dash lines show predicted values acquired by different algorithms for one hour length (360 samples) based on the previous 512 data samples (not shown in the figure)7. Different from PAC, other algorithms can only perform coarse-grained prediction, which derive one value from the training samples and use that value to predict the resource usage for the next one hour period. We observe that the resource consumptions of those applications do exhibit certain repeating patterns. The prediction results (shown by the solid lines in Figure 7) show that PAC can accurately extract the signature patterns that closely track real dynamic resource usage. The prediction results based on the extracted signatures can achieve 50-90% lower prediction error than other alternative schemes.
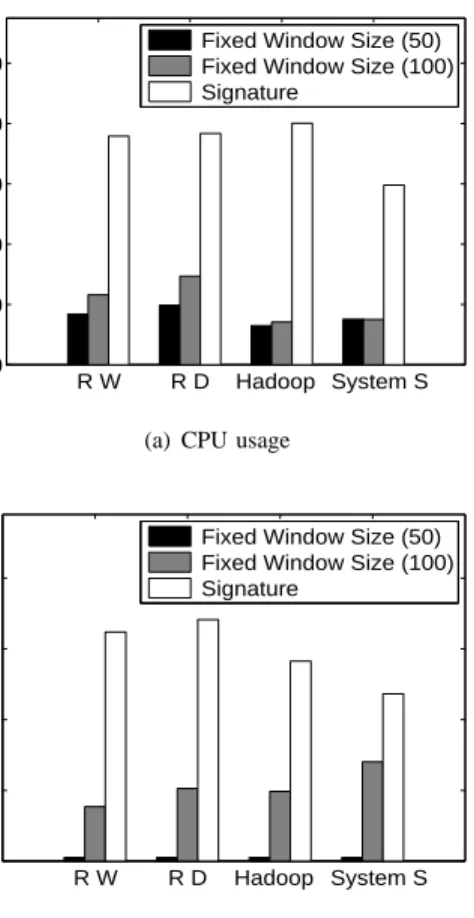
Figure 8(a) and Figure 8(b) show the signature detection rate results for the CPU and I/O usages of all server applications (i.e., RUBiS, Hadoop, IBM System S) used in our experiments, respectively. To measure the signature detection rate, we use the first 512 measurement samples to form a window and check whether we can detect a signature within this window. We then continuously slide the window to see whether the old signature is still valid or a new signature can be extracted. We record how many times a signature can be extracted to calcu-late the detection rate. For comparison, we also implemented a baseline approach which uses fixed window sizes (50 or 100 samples) to extract the signature. The results show that real world applications do exhibit repeating patterns that can be captured by our signature model. Our signature extraction algorithm can achieve much higher detection rate than the baseline algorithm. In figure 8(b), the detection rate using a small window size (50) is very low since the window is too short to cover one signature.
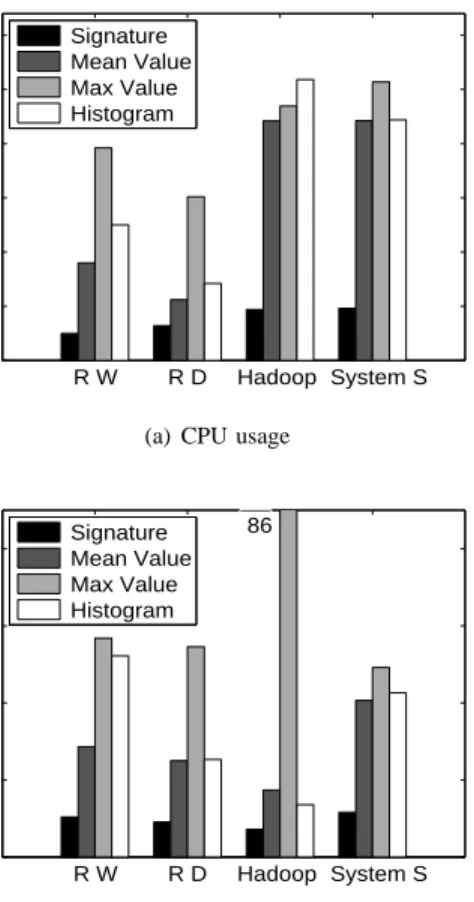
Figure 9(a) and Figure 9(b) show the mean prediction error for the CPU and I/O resource usage traces of all server appli-cations used in our experiments, respectively. We calculate the mean prediction error for the signature approach as follows.
7The spikes in the real trace did not present in the training data so the
maximum value predicted is less than the spike values.
R W R D Hadoop System S 0 20 40 60 80 100
Signature Detection Rate (%)
Fixed Window Size (50) Fixed Window Size (100) Signature
(a) CPU usage
R W R D Hadoop System S 0 20 40 60 80
Signature Detection Rate (%)
Fixed Window Size (50) Fixed Window Size (100) Signature
(b) I/O usage
Fig. 8. Signature detection rate for RUBiS Web server (RW), RUBiS database server (RD), Hadoop, and IBM System S.
If a signature is detected, the system uses the signature to predict resource demands in future one hour, and measures the average error by calculating the difference between the predicted values and the real values on the time series nor-malized by the maximum possible values. If no signature is detected, the system degenerates to the mean value approach. For other algorithms (i.e., mean, max, histogram), the system predicts resource demands in future one hour based on the same sample data used by the signature-based approach. The results show that our signature approach can achieve much lower prediction error than other approaches.
We now evaluate the efficiency of different dynamic VM placement algorithms using application performance metric and SLO violation rate. In this set of experiments, We use a set of RUBiS web servers and database servers driven by different dynamic workload traces to emulate heterogeneous workload environments. We use the request load curve from IRCache to generate workload for all VMs as described before. Moreover, to generate different workload patterns for different VMs, we shift the curves by different lengths for different VMs so that the workload curves for all VMs are different in phases. We measure the mean response time of all auction requests. We set the response time SLO as 1.5 seconds. We measure the ratio of requests that have response time larger than 1.5 seconds and use this ratio as SLO violation rate. To test the system
R W R D Hadoop System S 0 5 10 15 20 25 30
Mean Prediction Error (%)
Signature Mean Value Max Value Histogram
(a) CPU usage
R W R D Hadoop System S 0 10 20 30 40
Mean Prediction Error (%)
Signature Mean Value Max Value Histogram 86 (b) I/O usage
Fig. 9. Prediction accuracy comparison for different applications.
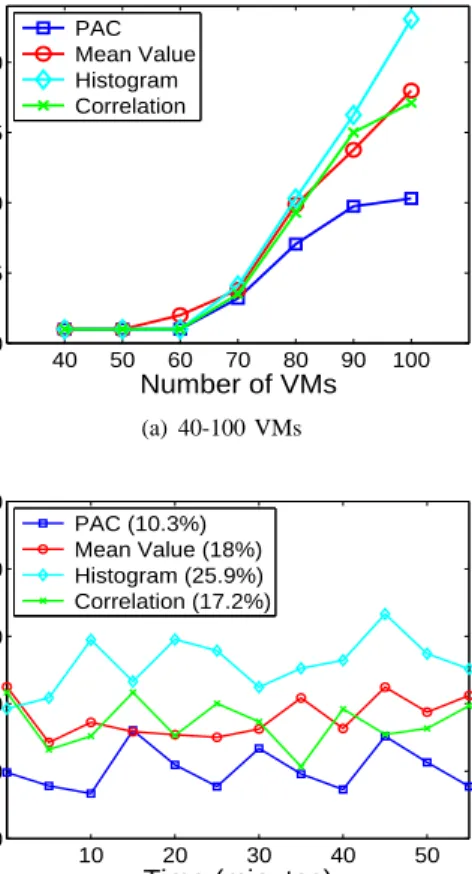
under different workload conditions, we gradually increase the number of VMs running on the cluster from 40 to 100 (half are RUBiS Web servers and half are RUBiS database servers). Figure 10(a) shows the average response time achieved by different algorithms. Under light workload (e.g., 40-70 VMs), the performance of different algorithms are similar, which is expected since there are plenty of resources for all VMs. Under heavy workload (i.e., 80-100 VMs), PAC can achieve much better performance than the other approaches. Figure 10(b) shows the continuous measurements of the average response time sampled every five minutes in the case of running 100 VMs on 20 hosts. We can see that PAC consistently achieves the shortest response time among all algorithms.
Figure 11(a) shows the average SLO violation rate achieved by different algorithms. The results show that PAC can ef-fectively reduce the SLO violation rate by up to 60% under high system workload with a large number of concurrently running VMs. Figure 11(b) shows the detailed continuous measurements when running 100 VMs on 20 hosts. The results show that PAC consistently achieves the lowest SLO violation rate among all algorithms.
We now report the overhead results of the PAC system. Table II summarizes the overhead measurements for the man-agement node running the signature analysis and matching algorithms. The execution time of one signature extraction is based on 512 samples. The signature matching time denotes
40 50 60 70 80 90 100 0 500 1000 1500 2000 Number of VMs
Mean Response Time (ms)
PAC Mean Value Histogram Correlation (a) 40-100 VMs 10 20 30 40 50 0 1000 2000 3000 4000 Time (minutes)
Mean Response Time (ms)
PAC (921) Mean Value (1361) Histogram (2115) Correlation (1340)
(b) 100 VMs
Fig. 10. Response time comparison for running 40-100 VMs on 20 hosts.
the time of matching one VM signature with 20 host sig-natures. Each measurement is repeated 1000 times and we report both mean and standard deviation. The total execution time includes the execution time of placing 100 VMs on 20 hosts using the PAC global consolidation algorithm. This measurement is repeated ten times. PAC imposes less than 1% overhead for running 30 VMs on one physical host8, which shows that PAC is feasible for large-scale cloud computing infrastructures.
Signature extraction time 7±0.45 ms
Signature matching time 85 ±45 ms
Total execution time (100 VMs on 20 hosts) 8.5 sec±0.2 sec TABLE II
THE OVERHEAD OF THEPACSYSTEM.
V. RELATEDWORK
Virtualization has been extensively studied due to its im-portant role in consolidated hosting infrastructures. Previ-ous work has proposed variPrevi-ous enhancements to improve the performance of popular VM platforms such as Xen and VMware [35], [26], [27]. Since VMs hosted in one machine
830 VMs is the largest number of VMs we can create on a single physical
40 50 60 70 80 90 100 0 5 10 15 20 Number of VMs
SLO Violation Rate (%)
PAC Mean Value Histogram Correlation (a) 40-100 VMs 10 20 30 40 50 0 10 20 30 40 50 Time (minutes)
SLO Violation Rate (%)
PAC (10.3%) Mean Value (18%) Histogram (25.9%) Correlation (17.2%)
(b) 100 VMs
Fig. 11. SLO violation comparison for running 40-100 VMs on 20 hosts.
share CPU resources, researchers have proposed different CPU resource scheduling schemes [22], [20]. However, the above work mainly focuses on managing VMs within one physical host. In contrast, our research focuses on exploring VM re-source usage patterns and live VM migration [12] to achieve efficient dynamic application consolidation in cloud systems.
Application consolidation is widely employed by large-scale data centers and hosting infrastructures. Previous consolidation approaches can be broadly classified into static consolidation over long period of time (e.g., days, weeks) and dynamic consolidation over short period of time (e.g., hours). Zhu et al. proposed an integrated control approach to managing workloads at different scopes and time scales [36]. Gmach et al. [17], [16] proposed an integrated workload placement solution using both peak demand based workload assignment simulation and fuzzy logic based feedback control guided workload migration. Verma et al. proposed a static consoli-dation scheme that considers workload correlations and peak patterns to minimize power consumption of data centers [33]. In contrast, our work focuses on dynamic application con-solidation and employs time series similarity matching to achieve precise resource control in multi-tenant cloud systems. Bobroff et al. proposed a dynamic VM placement scheme using predicted resource demands based on recent historical data [7] and tested their algorithm using simulation. Their work is based on auto-correlation assuming the workload has
cyclic patterns. In contrast, our system can extract signatures at runtime even when signatures might change dynamically, and apply time series similarity matching algorithms to perform runtime VM placement in cloud systems.
Rolia et al. proposed dynamic resource allocation using an estimated burst factor multiplies the most recent resource demand [30]. Gmach et al. [18] used a combined evaluation of the periodogram function and the auto-correlation to pre-dict workload. They generate synthetic workload based on the prediction to predict the resource usage. In comparison, PAC directly extracts dynamic resource usage patterns based on the observation over an extended period of time. Our experiments have shown that such an approach is feasible and efficient. Chen et al. [10] used sparse periodic auto regression to perform load prediction. However, their approach assumes the repeating period is known in advance. Chandra et al. [9] proposed two workload prediction algorithms using a simple linear regression model (i.e., prediction based on only the previous value) and a histogram method. Our experiments have shown that PAC can significantly outperform this simple approach.
Mi et al. [28] proposed that temporal dependence can be exploited to forecast future resource requirements of service requests. They use autocorrelation function to identify the temporal dependence to make admission control decision. In comparison, PAC tries to detect resource demand patterns and consolidate different applications based on their signature patterns. Casolari et al. [8] proposed short-term prediction models for Web-based system resources using trend-aware regression algorithm. In comparison, PAC considers resource usage patterns at different time scales (i.e., both short term and long term) to achieve efficient application consolidation and dynamic application relocation. Kochut provided an analytical model to quantify the benefit of dynamic VM relocation [24]. Choi et al. [11] proposed the profiling and prediction of power consumption in consolidated environments. Different from the above work, PAC focuses on pattern-driven resource management for consolidated cloud computing environments. In [19], we presented an initial framework of our signature-driven load management for wide-area distributed systems such as PlanetLab [29], which, however, does not provide dynamic online signature extraction and is not integrated with the VM platform.
Recent studies have shown that recognizing system patterns is a promising approach to automatic system management. Cohen et al. proposed the signature concept to capture the essential characteristic of a system state that can be indexed and clustered, and retrieved based on similarity to assist in sys-tem problem diagnosis [13]. Shen et al. proposed to construct a whole-system I/O throughput model as the reference of ex-pected performance and used statistical clustering and charac-terization of performance anomalies to guide debugging [32]. Ganapathi et al. applied machine learning techniques to predict multiple performance metrics of query processing [14]. Our work is similar to the above work by adopting a pattern driven approach. However, to the best of our knowledge, our work
makes the first step to apply pattern-driven approach to fine-grained resource control in cloud computing environments.
VI. CONCLUSION
In this paper, we have presented PAC, a new pattern-driven application consolidation system for multi-tenant cloud com-puting infrastructures. Different from previous coarse-grained resource management approaches, PAC models dynamic ap-plication resource demand using fine-grained time series and employs signal processing techniques to discover significant patterns. Based on the extracted patterns, PAC performs effi-cient application consolidation that can both avoid resource waste in the cloud system and minimize negative sharing impact among co-located applications. We have implemented the PAC system on top of Xen virtual machine platform and tested it on the NCSU Virtual Computing Lab. Our experi-mental results show that 1) real world applications do exhibit significant resource usage patterns that can be captured by PAC to achieve more efficient resource sharing; 2) pattern-driven application consolidation can significantly improve the application performance by up to 50% compared to previous schemes when running a large number of VMs on a shared cluster; and 3) PAC is feasible for production cloud systems, which imposes little overhead to the cloud system.
VII. ACKNOWLEDGMENT
This work was sponsored in part by NSF CNS0915861 grant, NSF CNS0915567 grant, U.S. Army Research Office (ARO) under grant W911NF-08-1-0105 managed by NCSU Secure Open Systems Initiative (SOSI), IBM Exploratory Stream Analytics Award, IBM Faculty Award, and Google Research Award. Any opinions expressed in this paper are those of the authors and do not necessarily reflect the views of the NSF, ARO, or U.S. Government.
REFERENCES
[1] Amazon Elastic Compute Cloud. http://aws.amazon.com/ec2/. [2] Apache Hadoop System. http://hadoop.apache.org/core/. [3] RUBiS Online Auction System. http://rubis.ow2.org/. [4] The IRCache Project. http://www.ircache.net/. [5] Virtual Computing Lab. http://vcl.ncsu.edu/.
[6] P. Barham and et al. Xen and the Art of Virtualization. Proc. of the Symposium on Operating Systems (SOSP), 2003.
[7] N. Bobroff, A. Kochut, and K. A. Beaty. Dynamic Placement of Virtual Machines for Managing SLA Violations. Proc. of Integrated Network Management (IM), 2007.
[8] S. Casolari, M. Andreolini, and et al. Runtime Prediction Models for Internet-based Systems. Proc. of MASCOTS, 2008.
[9] A. Chandra, W. Gong, and P. Shenoy. Dynamic resource allocation for shared data centers using online measurements. Proc. of IWQoS, 2004. [10] G. Chen and et al. Energy-Aware Server Provisioning and Load Dis-patching for Connection-Intensive Internet Services. Proc. of USENIX NSDI, 2008.
[11] J. Choi, S. Govindan, and et al. Profiling, Prediction, and Capping of Power Consumption in Consolidated Environments. Proc. of MASCOTS, 2008.
[12] C. Clark, K. Fraser, S. Hand, J. Hansen, E. Jul, C. Limpach, I. Pratt, and A. Warfield. Live Migration of Virtual Machines. Proc. of the Second Symposium on Networked Systems Design and Implementation (NSDI), May 2005.
[13] I. Cohen, S. Zhang, M. Goldszmidt, J. Symons, T. Kelly, and A. Fox. Capturing, indexing, clustering, and retrieving system history. SOSP, 2005.
[14] A. Ganapathi and et al. Predicting Multiple Performance Metrics for Queries: Better Decisions Enabled by Machine Learning. Proc. of IEEE International Conference on Data Engineering (ICDE), 2009. [15] B. Gedik, H. Andrade, K.-L. Wu, P. S. Yu, and M. Doo. SPADE: the
system s declarative stream processing engine. Proc. of SIGMOD, 2008. [16] D. Gmach, J. Rolia, and L. Cherkasova. Satisfying Service Level Objectives in a Self-Managing Resource Pool. Proc. of SASO, 2009. [17] D. Gmach, J. Rolia, L. Cherkasova, G. Belrose, T. Turicchi, and A.
Kem-per. An integrated approach to resource pool management: Policies, efficiency and quality metrics. Proc. of DSN, 2008.
[18] D. Gmach, J. Rolia, L. Cherkasova, and A. Kemper. Capacity Manage-ment and Demand Prediction for Next Generation Data Centers. Proc. of ICWS, 2007.
[19] Z. Gong, P. Ramaswamy, X. Gu, and X. Ma. SigLM: Signature-Driven Load Management for Cloud Computing Infrastructures. Proc. of IEEE International Conference on Quality of Service (IWQoS), 2009. [20] S. Govindan, A. R. Nath, A. Das, B. Urgaonkar, and A.
Sivasubra-maniam. Xen and Co.: Communication-aware CPU Scheduling for Consolidated Xen-based Hosting Platforms. Proc. of third International ACM SIGPLAN/SIGOPS Conference on Virtual Execution Environments (VEE), June 2007.
[21] X. Gu and K. Nahrstedt. Dynamic QoS-Aware Multimedia Service Configuration in Ubiquitous Computing Environments. Proc. of ICDCS, 311-318, 2002.
[22] D. Gupta, L. Cherkasova, R. Gardner, and A. Vahdat. Enforcing Performance Isolation Across Virtual Machines in Xen. Proc. of Seventh International Middleware Conference (Middleware), November 2006. [23] K.-L.Wu and et al. Challenges and Experience in Prototyping a
Multi-Modal Stream Analytic and Monitoring Application on System S. Proc. of VLDB, 1185-1196, 2007.
[24] A. Kochut. On Impact of Dynamic Virtual Machine Reallocation on Data Center Efficiency. Proc. of MASCOTS, 2008.
[25] J. Kruskall and M. Liberman. Time Warps, String Edits and Macro-molecules: The Theory and Practice of Sequence Comparison. Addison-Wesley, 1983.
[26] J. Liu, W. Huang, B. Abali, and D. K. Panda. High Performance VMM-Bypass I/O in Virtual Machines. Proc. of the USENIX Annual Technical Conference (USENIX), May 2006.
[27] A. Menon, A. Cox, and W. Zwaenepoel. Optimizing Network Virtu-alization in Xen. Proc. of the USENIX Annual Technical Conference (USENIX), May 2006.
[28] N. Mi, G. Casale, and et al. Autocorrelation-Driven Load Control in Distributed Systems. Proc. of MASCOTS, 2009.
[29] Larry Peterson, Tom Anderson, David Culler, and Timothy Roscoe. A blueprint for introducing disruptive technology into the internet. In HotNets-I, Princeton, New Jersey, October 2002.
[30] J. Rolia, L. Cherkasova, M. Arlitt, and V. Machiraju. Supporting application QoS in shared resource pools. Communications of the ACM, 2006.
[31] S. Salvador and P. Chan. FastDTW: Toward Accurate Dynamic Time Warping in Linear Time and Space. Proc. of KDD Workshop on Mining Temporal and Sequential Data, 2004.
[32] K. Shen, M. Zhong, and C. Li. I/o system performance debugging using model-driven anomaly characterization. FAST, 2005.
[33] A. Verma and et al. Server Workload Analysis for Power Minimization using Consolidation. Proc. of USENIX Annual Technical Conference, June 2009.
[34] M. Vlachos, M. Hadjieleftheriou, D. Gunopulos, and E. Keogh. Index-ing Multi-Dimensional Time-Series with Support for Multiple Distance Measures. Proc. of SIGKDD, 2003.
[35] C. Waldspurger. Memory Resource Management in VMWare ESX Server. Proc. of the Fifth Symposium on Operating System Design and Implementation (OSDI), December 2002.
[36] X. Zhu and et al. 1000 Islands: Integrated Capacity and Workload Management for the Next Generation Data Center. Proc. of IEEE International Conference on Autonomic Computing (ICAC), June 2008.