MARKET SIZE AND DEMAND
FOR MARIJUANA IN COLORADO
Prepared for the Colorado Department of Revenue
Provided by: The Marijuana Policy Group
Authors:
Miles K. Light, Adam Orens, Brian Lewandowski, Todd Pickton
May 13, 2014
Version: Final (v16)
The Marijuana Policy Group (MPG) was formed in 2014 as a collaborative effort between the
University of Colorado Boulder Business Research Division (www.leeds.colorado.edu/brd) and
BBC Research & Consulting (www.bbcresearch.com) in Denver. Both entities have offered custom
economic, market, financial and policy research and consulting services for over 40 years. The
MPG mission is to apply research methods rooted in economic theory and statistical applications
to inform regulatory policy decisions in the rapidly growing legal medical and recreational
marijuana markets.
Contents
EXECUTIVE SUMMARY ... 2
BACKGROUND ... 4
HISTORY ... 4
EVOLUTION OF MEDICAL AND RETAIL MARIJUANA SALES IN COLORADO ... 6
MARIJUANA DEMAND ESTIMATION METHODOLOGY ... 8
EDIBLES AND CONCENTRATES ... 9
AVAILABLE DATA ... 9
RESIDENT DEMAND ESTIMATION ... 10
MARIJUANA USER PREVALENCE IN COLORADO ... 10
MARIJUANA USE TRENDS ... 11
MARIJUANA FREQUENCY OF USE ... 11
POPULATION BY DAYS OF USE ... 12
SURVEY UNDERREPORTING ADJUSTMENTS ... 13
COLORADO MARIJUANA USERS – 2014 ... 15
DAILY CONSUMPTION AMONG USER TYPES ... 15
PRIMARY DATA COLLECTION ... 16
TOTAL RESIDENT DEMAND ... 18
COMPARISON WITH PREVIOUS STUDIES ... 19
DEMAND ESTIMATES ... 20
VISITOR DEMAND ... 21
DESTINATION TOURIST DEMAND ... 21
TRANSIT AND BUSINESS VISITOR DEMAND... 24
MARIJUANA SUPPLY MODALITIES ... 26
ISSUES AND CHALLENGES FOR MARKET SIZE ESTIMATION ... 28
REFERENCES ... 30
TERMS AND DEFINITIONS ... 32
EXECUTIVE SUMMARY
Total demand for marijuana, measured in metric tons, is estimated for the State of Colorado in this report. The process of estimation reveals a number of new and unique characteristics related to Colorado’s market for marijuana. These characteristics are introduced and discussed throughout the report as part of the estimation process.
The demand for marijuana by Colorado adult residents is estimated to be 121.4 metric tons in 2014. In addition, the demand by visitors to the state is estimated to be 8.9 metric tons for a total estimated demand of 130.3 metric tons. This reflects a point estimate for the adult (21+) population only. The true size of Colorado’s market may be smaller or larger than this. We believe the potential range for total adult marijuana demand, including visitor demand, is between 104.2 and 157.9 metric tons. State demand is driven by a combination of user prevalence, user frequency, and the amount of marijuana used (the dosage) each day for different user types.
This demand is supplied through various channels. Medical marijuana dispensaries and licensed retail marijuana vendors are the most obvious suppliers. However, a significant portion of demand is also supplied by medical marijuana caregivers, who are informal producers and vendors of medical marijuana sanctioned by state laws, but are also considered to be “gray-market” vendors. Remaining demand is supplied by home production, unlicensed vendors and individuals who represent the black market.
There are an estimated 485 thousand adult regular marijuana users who consume marijuana at least once per month. This represents 9.0 percent of the 2014 forecast population in Colorado of 5.363 million residents (all ages). Another 201 thousand adult residents reported using marijuana within the past year, which is 3.8 percent of the state population. In addition, 184 thousand residents under 21 reported past year use, of which 59 thousand reported past-month use. The scope of this report only includes the demand from consumers who are 21 years of age and older.
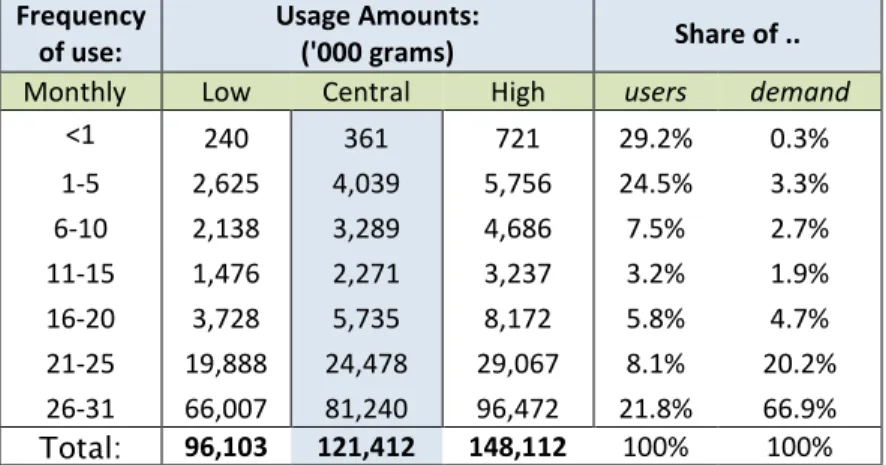
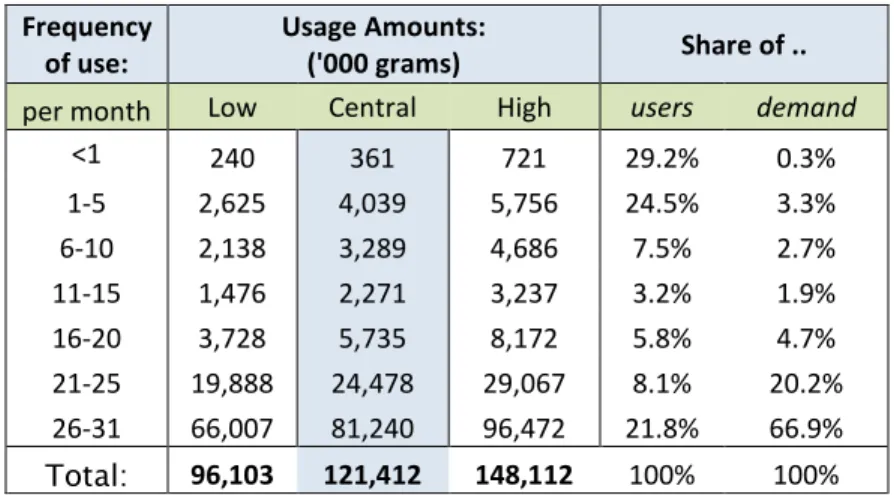
The vast majority of marijuana demand emanates from the regular users—and in particular from the heavy users who consume marijuana on a near-daily basis. In Colorado, the top 21.8 percent of users account for 66.9 percent of the demand. In contrast, the entire population of rare users (less than once per month), a group that accounts for almost one-third of all users, represents less than 1 percent (0.3 percent) of total demand. Table 1 shows Colorado user segments and corresponding demand shares.
Table 1: Adult (21+) User Prevalence and Estimated Quantity of Marijuana Demanded (Thousands of Grams)
Frequency
of use: Usage Amounts: ('000 grams) Share of ..
Monthly Low Central High users demand
<1 240 361 721 29.2% 0.3% 1-5 2,625 4,039 5,756 24.5% 3.3% 6-10 2,138 3,289 4,686 7.5% 2.7% 11-15 1,476 2,271 3,237 3.2% 1.9% 16-20 3,728 5,735 8,172 5.8% 4.7% 21-25 19,888 24,478 29,067 8.1% 20.2% 26-31 66,007 81,240 96,472 21.8% 66.9% Total: 96,103 121,412 148,112 100% 100%
Source: Marijuana Policy Group calculations. One million grams equals one metric ton.
Visitor Demand:
Colorado does not have Amsterdam style “coffee shops,” and it is illegal to consume marijuana in areas where most visitors may be, such as rental cars, hotels, and public spaces. Despite these restrictions, a significant share of retail sales appear to come from visitor purchases. Using a combination of sales tax receipt information, point-of-sale statistics, and data from county tourist offices, it is possible to impute visitor demand. For example, we estimate that purchases by out-of-state visitors currently represent about 44 percent of metro area retail sales and about 90 percent of retail sales in heavily visited mountain communities. Visitor demand is most prevalent in the state’s mountain counties,1 where combined medical and retail marijuana sales more than doubled after retail sales were
legalized in January, 2014. In comparison, Front Range metropolitan combined sales only increased between 15 and 19 percent over the same period.
Visitor prevalence is reflected in retail sales (versus medical) because visitors do not have medical marijuana patient registry ID cards. Point-of-sale data confirm that out-of-state ID cards represented almost one-half of all new retail sales, whereas ongoing medical sales were exclusively to in-state residents.
Summary Points:
This study finds total marijuana demand to be much larger than previously estimated. Our point estimate of demand is 121.4 tons per year for adult residents. This is 31 percent higher than a recent Department of Revenue
assessment, 89 percent higher than a study by the Colorado Futures Center, and 111 percent higher than an older study by the Colorado Center for Law and Policy. The primary difference is caused by much heavier dosage amounts consumed by the state’s “heavy user” population – those who consume marijuana on a daily basis.
Heavy users drive almost 70 percent of total marijuana demand, and the prevalence of heavy users in Colorado is higher than the national average. According to the National Survey on Drug Use and Health, 23 percent of the user population in Colorado consumes near daily, compared with a 17 percent share nationwide. The second highest user cohort is also larger, with a 9 percent share in Colorado, compared to a 6 percent share nationwide.
This study accounts for the recent revelation that dosage levels increase with frequency of use. The drug use literature shows that heavy users consume doses that are three times larger per day than regular or light users. Using the latest retail marijuana tax statistics from the Department of Revenue, we also found that conversions from medical to retail consumption is relatively low. Instead, retail supply of marijuana is growing, while medical
marijuana is relatively constant. This may indicate that medical consumers would rather pay the medical registration fees as opposed to the higher tax rates, or that there are currently relatively few retail outlets compared to medical centers. Therefore, the retail demand is derived primarily from out-of-state visitors and from consumers who previously purchased from the Colorado black and gray markets.
Efforts to measure Colorado’s market size have become more complicated as demand for concentrates and edible products increase. Currently, there are no weight-equivalent conversions between these product types and dry weight of marijuana flower. On the other hand, our ability to measure medical and retail volumes sold, including 1 Mountain counties reporting sales in early 2014 include Summit, San Miguel, Clear Creek, and Gilpin counties.
Page | 3
edibles and concentrates, is improving as the State Marijuana Inventory Tracking System accumulates more data. A subsequent report revision is planned during the first quarter of 2015. This follow-up report is expected to provide improved clarity related to edibles and concentrates, as additional information becomes available.
BACKGROUND
The Colorado policy to legalize recreational marijuana was not challenged by federal authorities subject to guidance in the August 29, 2013, memorandum from James Cole, the US Deputy Attorney General, titled “Guidance Regarding Marijuana Enforcement” under the Controlled Substance Act (CSA) of 1970. In this memorandum, he indicates that federal enforcement agencies are unlikely to enforce the CSA in states where marijuana has been legalized, and where the regulation and control is functional.
The memorandum lists eight enforcement priorities that are of particular importance to the federal government. Among them, two items are particularly relevant to this study:
• Preventing the diversion of marijuana from states where it is legal under state law in some form to other states; and
• Preventing the distribution of marijuana to minors.
In order to demonstrate proper control and regulation of state-level marijuana production, the Colorado Marijuana Enforcement Division (the “MED”) has retained the Marijuana Policy Group (the “MPG”) to determine the demand for marijuana in Colorado and to help design the regulatory framework surrounding the control and pricing measures necessary to maintain an orderly market.
In order to assess the overall market for marijuana in Colorado, the MPG uses a combination of survey results, findings from related literature, and Colorado-specific primary data to triangulate the most accurate estimate possible. While this study relies substantially upon recent work in the marijuana field, especially the recent RAND/BOTEC Washington market assessments, it also provides some improvements upon recent demand and prevalence estimation methods.
One improvement is that we can now use actual price and quantity data from the regulated market to compare the “sales gap” between estimated demand from all sources and the amount of marijuana available in the regulated market. Point-of-sale data, as well as local survey results, have also led to more specific conclusions about state-level use prevalence and the likelihood of underreporting among different user cohorts.
HISTORY
Marijuana was scheduled as a narcotic and made illegal at the federal level in the 1930s under President Franklin Roosevelt. The drug became increasingly popular during the 1960s and 1970s, which prompted state-level enforcement responses, and led to the start of state-led drug enforcement decisions. Some states became increasingly strict, while others moved toward de-criminalization of marijuana.
A major shift toward legalization began in 1996, when Oregon and California passed legislation that legalized marijuana possession and use for medical purposes. Today, 20 states and the District of Columbia allow the cultivation and use of medical marijuana in some form.
Federal law continues to prohibit possession, cultivation, and consumption of marijuana and related products, but several state and local governments have either de-criminalized marijuana possession while other states, such as Colorado and Washington, have begun to fully legalize marijuana through a regulated market.
Colorado voters passed Amendment 20 to the Colorado Constitution in 2000, which established a caregiver-patient system and permitted qualifying patients or caregivers to possess six plants or two ounces of useable marijuana for medical purposes. In 2007, a Denver District judge ruled that a 5:1 patient to caregiver ratio violated state law. This court ruling, and the publication of the Ogden memo in 2009 (Ogden 2009), led to a proliferation of medical
marijuana dispensaries operating as caregivers. In response, the Colorado General Assembly passed HB-1284, which established a framework for medical marijuana centers (dispensaries), cultivation facilities, and manufacturers of edible marijuana products.
In 2012, Colorado and Washington were the first two states to approve measures that allow recreational cultivation and use of marijuana among adults 21 of years or older within each state.
Because marijuana has remained an illegal substance under federal law, several business complications have arisen. The most prominent example is banking. Since banks are federally regulated, they face penalties or license
revocation for enabling marijuana sales transactions in Washington and Colorado. Even though the federal government has issued statements of clarification that allow financial transactions related to marijuana, very few banks currently allow account creation by firms that are related to the marijuana business.
Evolution of Medical and Retail Marijuana Sales in Colorado
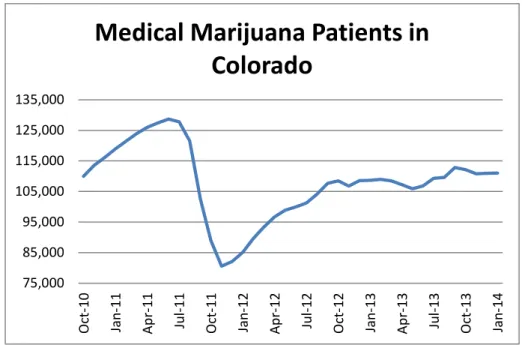
In January of 2009, the medical marijuana registry listed 5,051 valid medical ID cards in Colorado.2 Today, there are
111,031 residents with valid “red cards,” which represents 2.1 percent of the state population and 22.8 percent of the estimated marijuana user population who are over 21 years of age. The group of medical marijuana consumers is likely to include many of the “heavy users” within the state. While some of these patients have debilitating medical conditions like cancer, glaucoma, or cachexia, other red-card holders indicate more generic conditions, such as “severe pain.” The official breakdown of medical conditions indicated by red-card holders is shown in Table 2.
Table 2: Reported Conditions for Colorado Marijuana ID Cards as of January 31, 2014 Condition Number of Patients Share of Patients* Severe Pain 103,918 94% Muscle Spasms 14,632 13% Severe Nausea 10,904 10% Cancer 3,118 3% Seizures 2,111 2% Glaucoma 1,133 1% Cachexia 1,126 1% HIV/AIDS 668 1%
*Note: Total does not add to 100% due to multiple conditions reported.
Source: Colorado Medical Marijuana Registry.
Among the medical card holders, two-thirds are male and one-third are female, which reflects the marijuana
consumer population more closely than the general population of Colorado (101.4 males for every 100 females). The trend in patients has been relatively volatile, with as many as 125,000 card holders in April 2011, to as few as 79,000 in November of the same year. State policymakers and regulators are currently watching the number of red-card holders who switch to the retail market to determine how the two markets will coexist following the passage of Amendment 64.
2 January 2009 statistical archive, Colorado Medical Marijuana Registry. Page | 6
Table 3: Historical Tally of Medical Marijuana Card Holders in Colorado
Source: Colorado Medical Marijuana Registry, Quarterly Report Archives.
Those who suggest there will be a migration of medical card holders point to the cost of medical marijuana
registration fees and the required doctor’s prescription. Consumer anonymity when purchasing as a retail buyer is also cited as another factor that would attract current patients to the retail market. However, the cost of registering for a red card has recently declined. The fee was lowered from $100 to $90 in 2012, then to $35 in 2013, and is just $15 as of February 2014.
The red-card registration fees are likely to be offset by lower tax rates paid for medical marijuana, compared to retail marijuana. Medical marijuana is subject to state and local sales taxes, but retail marijuana is also subject to a 15 percent excise tax and a special state sales tax rate of 10 percent. In addition, each city can apply higher tax rates to retail marijuana. For example, the Denver sales tax rate is 3.62 percent for medical marijuana, but the rate is 7.12 percent for retail marijuana. The effect is compounded by state and district taxes. The final rate a red-card holder pays for medical marijuana in Denver is 7.62 percent, compared to the retail sales tax rate of 21.12 percent.3
This makes it unclear how many medical marijuana users will choose to become retail buyers. Another factor that contributes to medical marijuana users lack of conversion is that retail marijuana is not available in all jurisdictions that allow the sale of medical marijuana. A more likely outcome is that gray-market and black-market customers will choose the retail market, because they can select from a variety of high-quality products in a safe and predictable environment. 3 http://www.denvergov.org/Portals/571/documents/TaxGuide/Tax%20Rates%20and%20Rounding%20-%2093.pdf 75,000 85,000 95,000 105,000 115,000 125,000 135,000 O ct -10 Ja n-11 Ap r-11 Jul -1 1 O ct -11 Ja n-12 Ap r-12 Jul -1 2 O ct -12 Ja n-13 Ap r-13 Jul -1 3 O ct -13 Ja n-14
Medical Marijuana Patients in
Colorado
Page | 7
MARIJUANA DEMAND ESTIMATION METHODOLOGY
The amount of marijuana consumed in Colorado by adults is not a known quantity and must be estimated. The total size of the marijuana market can be measured by using a supply-side approach or a demand-side approach.
The supply-based approach requires information from marijuana producers and sellers across the state. Starting January 1, 2014, production quantities by licensed marijuana companies is being recorded, but it is unlikely that the Colorado marijuana market is limited to licensed production alone. Home production, imports, and black market growing operations have been important contributors to Colorado’s marijuana ecosystem in the past. While the amount of underground and illegal production is expected to decline significantly, some level is believed to exist to date. Therefore, in order to determine the total market for licensed and unlicensed marijuana, a demand approach is more practical. The demand estimate is then compared to licensed supply in order to determine the underground production gap.
This study is the first analysis that combines both methods: demand and supply. By comparing our estimates of demand to sales statistics and actual production, we believe that a more reliable examination of the marijuana market is possible.
In the demand approach, the number of users is first estimated, and then the quantity of marijuana consumed is estimated for each type of user over a specified period of time. The time period is dictated by the survey data source. In most cases, the surveys used for this analysis ask respondents whether they have consumed marijuana in the past 30 days. We identify users based upon their reported frequency of use by month. Next, the quantity demanded is tallied based upon dosage estimates. The quantity of marijuana used during a dosage can vary widely. Social marijuana users may consume a small (less than a gram) amount on rare occasions, whereas heavy users and those with chronic pain will consume more than one gram per each day of use. The prevalence of marijuana use in Colorado can be estimated from survey responses, but the quantity used is not available from these surveys. Therefore, the next step is to identify how much is consumed by different types of marijuana consumers in a given year. This may sound trivial but due to the illegal nature of the product no records of use have been recorded, and survey data are often distorted by potential misreporting by survey respondents.4
The disparity between user types is highlighted in the 2013 analysis by the RAND group.5 They concluded that heavy
users consume two to three times as much marijuana per day as infrequent users. When this heavy use is combined with more frequent use, the heavy user demographic becomes the primary group driving demand. According to the study, over 80 percent of demand is consumed by the top 20 percent of marijuana users in Washington State. Other studies that use a population average dosage amount will miss these important details, which are necessary to properly estimate the overall demand.
4 Usage amounts are typically underreported, due to factors such as social stigma related to the drug, or because respondents
cannot remember each consumption event. These respondents typically revert to their typical pattern of use, rather than the actual use.
5 See Caulkins, Hawken, Kilmer, & Kleiman, 2012. (and ) B. Kilmer, et al. (2013). “Before the Grand Opening: Measuring
Washington State’s Marijuana Market in the Last Year Before Legalized Commercial Sales,” RAND Drug Policy Research Center. See http://www.rand.org .
Page | 8
Edibles and Concentrates
There is a slow but steady shift away from the traditional method of consuming marijuana – smoking it – to new delivery methods. Some of these new methods include:
• Vaporizing the marijuana using a “vape pen,” which heats the cannabis flower, concentrate or oil enough to release the THC and cannaboids, but does not burn the flower and therefore does not smoke.
• Edibles: candy bars, brownies, candies such as lollipops and gummy bears are sold with 100 mg or less TCH content.
• Concentrates: a more compact method to carry and consume marijuana is to burn a concentrate, similar to hashish oil using a hot point, called a “nail.” The size of a concentrate jar is similar to a lip-balm container, such as Carmex.
• Lotions and salves: body lotions and salves are infused with marijuana concentrates and absorbed through the skin.
Each of these alternative consumption methods are unique and may be difficult to convert into a dry-weight equivalent of dried flower. In order to obtain an estimate in a weight-based equivalent, each consumption method would require a specific conversion factor back to the dried flower weight.
Matters are complicated further because most edibles are manufactured goods that are produced using secondary products from the marijuana plant, such as the trim (the leaves surrounding the marijuana flower), sugar (THC crystals on and around the marijuana plant), and even the stems of the plant.
The dried flower weight of marijuana is a useful common denominator for marijuana products because it can be used to link the consumption amount to the number of marijuana plants cultivated over a period of time. Together, the total demand (in tons) can then be designated to equal the total supply (in plants or in tons) based upon the latest production function for modern marijuana growing technology. Over time the growing technology may change and plants may have a higher yield or faster growth per unit of time, but it is then possible to simply scale down (or up) the amount of marijuana allowed in the market for a particular year.
Available Data
Several disparate data sources were used to assemble Colorado’s marijuana market size estimate, but to date, the primary source of prevalence data is surveys. Because marijuana has been an illegal substance to produce or consume in the past, historical production and market data are unavailable. Up until now, researchers were forced to rely upon voluntary survey responses to discern marijuana use patterns and amounts. For this study, a new source of more legitimate data is being used to supplement the traditional survey results.
Retail marijuana vendors are now recording actual sales volumes and values into point-of-sale systems, and in turn into Colorado’s State Marijuana Inventory Tracking System. System data were provided for the sole use of this study in order to identify sales and use patterns for the first three months of 2014, since recreational marijuana vending has become legal.
However, the State Marijuana Inventory Tracking System does not cover illegal marijuana use and distribution, nor does it indicate whether the marijuana sold is being diverted to underground markets outside of Colorado. Page | 9
Therefore, we must still rely heavily upon survey results, state demographics, and estimated marijuana usage patterns in order to determine the estimated market size in Colorado.
Resident Demand Estimation
Total demand is the combination of demand by Colorado state residents and visitors to the state. These segments of the market are considered separately. Since tourism is an important segment of the Colorado economy, estimation of tourist demand is devoted to a separate section, and resident demand is computed here.
Total resident demand is computed using the following formula: 𝐷𝑟 =�𝑑𝑎𝑦𝑠1,000,000𝑡∗ 𝑔𝑡 ∗ 𝑛𝑡
7 𝑡=1 Where
• Dr = the total demand for marijuana in Colorado by adult residents, measured in metric tons of
marijuana
• Dayst = number of use days per year by user type, t (1-365)
• gt = number of grams consumed per day for each user type, t
• nt = number of people included in each marijuana user classification, t .
This approach is the most simple and straightforward method to estimate total marijuana demand. However, the identification of each component is challenging. We partition the formula into two parts, an estimate of user
prevalence (the n and the t) that will identify how many marijuana users reside in Colorado, and how often marijuana is consumed for different types of users in the state. Then, the physical quantity of consumption is estimated. We use primary survey data from Colorado to confirm or reject the results from studies for other states and for countries in Europe. The combination of recent literature and primary data from Colorado residents is used to assess the quantity demanded by different consumer types per occasion. The next subsections explain how these estimates were computed.
Marijuana User Prevalence in Colorado
The most recent and comprehensive data for Colorado marijuana use come from the National Survey on Drug Use and Health (NSDUH). The NSDUH is a nationwide survey that collects state-level representative samples on a wide variety of substance abuse, addiction, and mental health issues. The survey is administered by the Substance Abuse and Mental Health Services Administration (SAMHSA) of the U.S. Department of Health and Human Services. This data source is preferable because it is transparent, reliable, and comparable. The survey has been continuously repeated since 2002, providing trend data in use prevalence. Using this data source, the survey results are also comparable against other states in the country and against the country as a whole.
In order to obtain our specific prevalence dataset, the NSDUH offers its “restricted-use data analysis system” (R-DAS). This system provides access to the most detailed cross-tabulations of marijuana use frequency and age groups. The R-DAS data allowed for the segmentation of marijuana users by use frequency (i.e., occasional, heavy, etc.) and to make distinctions between the over-21 user age group, which has access to the regulated retail market, and those under 21 whom do not have access to retail marijuana outlets.
Marijuana Use Trends
The NSDUH reports state level marijuana use by frequency annually since 2002 by combining survey data in two-year intervals. The figure below shows past-year and past-month trends in Colorado marijuana between 2002/2003 and 2010/2011. The solid lines represent point estimates for the amount of past-year and past-month marijuana users. The dotted lines show a 95 percent confidence interval around the point estimate.
Notice that the survey data were collected most recently in 2010/2011, which precedes the advent of legal recreational marijuana in Colorado, which started only as of January 1, 2014.
Figure 1: Colorado Past-Year and Past-Month Marijuana Users, 2002/2003 to 2010/2011
Source: SAMHSA NSDUH, 2002-2011.
In general, past-month and past-year marijuana users have moved in concert between 2002/2003 and 2010/2011. Marijuana use in Colorado has risen steadily between 2004/2005 and 2009/2010. Past-year use rose by about 49 percent and past-month use rose by about 64 percent, which outpaces population growth and indicates rising prevalence rates among the state’s population between 2004 and 2010.
Most recently, marijuana prevalence has declined slightly, by about 3 percent in past-year users and 2 percent in past-month users between 2009/2010 and 2010/2011. Nationally, marijuana use increased slightly during the same time period.6
Marijuana Frequency of Use
A recent and important revelation is that heavy users account for most of a region’s demand and that infrequent users have a very small impact upon demand. This effect occurs because heavy users consume marijuana much more often, and more intensely, than other consumers. Kilmer et al. (2013), and Caulkins (2011) are recent studies that highlight this effect and its importance for aggregate market size estimates. Therefore, construction of a statewide demand estimate requires detailed prevalence statistics related to user frequency.
6 National past year marijuana user population rose from 29.0 million to 29.5 million. Past-month user population rose from 17.1
million to 17.7 million.
Page | 11
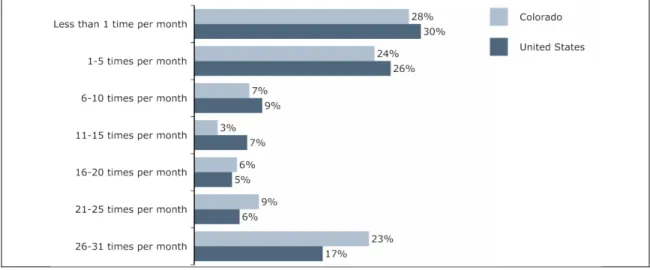
The figure below is used to compare the Colorado marijuana use frequency distribution to national figures. Figure 2 organizes marijuana users into seven groups based on use frequency. The groups can also be labeled as rare or occasional users who consume marijuana less than once per month, regular users who consume between once per month and 20 days per month, and heavy or daily users who consume over 20 days per month.
Figure 2: Use Frequency Distribution by Yearly Users Age 21 and Over, Colorado and United States. Data were collected during 2010/2011 (before Amendment 64 was passed and it does not include non-users)
Source: SAMHSA NSDUH R-DAS, 2010-2011.
While the data in Figure 2 predate the legalized retail market in Colorado, the data reveal that overall prevalence rates in Colorado lie below the national average (12 percent versus 16 percent, respectively), but that Colorado has a much higher share of “heavy” marijuana users compared to the national average. In Colorado, 23 percent of
marijuana users claim to consume marijuana near daily (26-31 times per month), compared to 17 percent in the United States overall. Colorado has a larger share of users in each of the top three frequency cohorts compared to the national average and a smaller share of users in each of the bottom four user categories.
This feature of Colorado’s user distribution will drive the state’s marijuana demand in a disproportionate way, leading to higher demand estimates than a simple averaging method would suggest and a higher rate of use compared to the national average.
Population by Days of Use
The R-DAS data also provide population estimates that form the basis of our marijuana demand estimates. In order to estimate the number of Colorado users in each cohort, the consultant team converted R-DAS data reported as marijuana use days per year, per month, and per week to a common monthly basis. The NSDUH asks all past-year users to report their average days of use by week, month, or year. Then, based on each user’s answer, the
respondents are separated into three pools. The consultant team converted the data to a per month common unit using logical conversion factors (i.e., a respondent who consumes marijuana 12 days per year is classified under 1–5 days per month, three days per week is classified as 11–15 days per month, and so on).
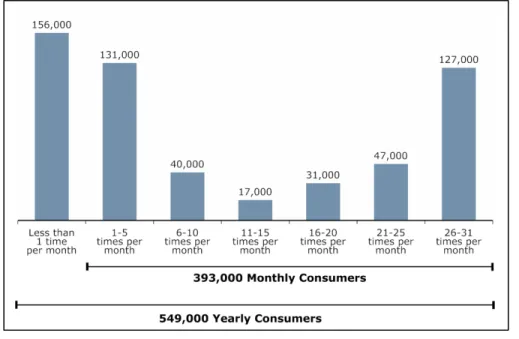
Figure 3 shows the estimated population of Colorado marijuana users segmented by frequency of use in 2010/2011. Page | 12
Figure 3 : Marijuana User Population, Past-Year Users Age 21 and Over, Colorado, 2010/2011
Source: SAMHSA NSDUH R-DAS, 2010-2011.
Approximately 549,000 Coloradans age 21 and over reported to consume marijuana in 2010/2011, which represents about 13 percent of the 2011 state’s adult (non-minor) population. About 393,000 Coloradans said they consume at least once per month. Monthly marijuana users make up approximately 9 percent of the state adult population. About 156,000 Coloradans reported using marijuana less than once per month, while approximately 127,000 residents consumed marijuana nearly every day. About 131,000 people used marijuana roughly once per week in 2010/2011. Another 149,000 marijuana users in Colorado are under 21 years of age. Those users are also analyzed to help estimate the size of the illegal (black/gray) market in subsequent sections.
For the adult users, an assumption is made that someone using marijuana 21 or more days per month is a “heavy” user and would consume larger amounts on each day of consumption. The other categories, between less than 1 day and 20 days, are assumed to be “regular” users who consume much less per day. A very detailed discussion of daily use (or dosage) is presented in the next section, where quantity of use is determined.
The figures above include all marijuana demand in Colorado by those over 21, including medical marijuana patients, black-market demand, and gray-market demand. These users are considered the target market for retail and medical marijuana centers. The monthly registered medical marijuana patient population ranged between about 53,000 and 129,000 in 2010/2011 and likely represents a significant portion of the regular to heavy user cohorts.
Survey Underreporting Adjustments
Two adjustments are applied to the NSDUH 2010/2011 user population figures to address population growth and survey underreporting. The first adjustment accounts for state population growth between the survey date and 2014.
The State Demographer’s Office estimates population growth of 5.3 percent between 2011 and 2014.7 The
consultant team applied a 5.3 percent growth factor due to population growth.
The population growth adjustment is conservative because it assumes that marijuana prevalence has remained constant and that the use frequency distribution also remained constant among use cohorts. We do not include an additional prevalence increase factor, as other studies have done, because the NSDUH user population for Colorado was flat between 2009/2010 and 2010/2011.
A second adjustment is needed to account for underreporting. Several recent studies that utilize NSDUH data conclude that an adjustment factor is necessary to capture the true user prevalence. The adjustment ranges from just 2 percent to as much as 43 percent. Table 4 lists previous reports that use NSDUH data; all of them conclude that an adjustment is necessary, but to a varying degree.
. Table 4: Marijuana prevalence adjustments made in the literature to account for NSDUH survey
underreporting by respondents.
Marijuana Use Study Adjustment
True lower bound 0.0%
(RAND, 2013), Lower Bound 2.0%
(CCLP, 2012/CFC, 2013) 20.0% (Kilmer, 2009) 20.0% (RAND, 2013), Mean 22.0% (Kilmer, 2011) 25.0% (Abt Associates, 2012) 33.0% (Harrison, et al., 2007) 35.0%
(RAND, 2013), Upper Bound 43.0%
This study assumes the following underreporting rates:
Mean Underreporting Adjustment 22.2% Heavy User Underreporting Adjustment 11.1%
Note: See references section for full citations. Heavy users are considered the top two use cohorts.
Sources: RAND, CCLP, Kilmer, Abt Associates, Harrison, et al., and assessment by the Marijuana Policy Group.
The sources in Table 4 cite underreporting due to unwillingness to admit to using a federally illegal substance, presence of user population outside the sampling frame, and purposeful or mistaken misrepresentation of marijuana use. The project team added a true lower bound to the underreporting adjustment calculation to account for a scenario where all respondents provide truthful answers to survey questions.
7 Estimated over 21 population of 3,666,250 in 2011 is expected to grow to 3,861,003 in 2014, or 5.3 percent. Page | 14
The mean amount, or 22.2 percent, is applied to all but the top two use frequency cohorts as the underreporting adjustment. An 11.1 percent underreporting adjustment factor is applied to the heavy marijuana use cohorts to recognize that underreporting is likely to be less prevalent among heavy users compared to light and occasional users.
We believe that the underreporting rate among heavy users is lower for the following reasons. First, it is very difficult to conceal a daily marijuana use habit over long periods of time. Therefore, heavy marijuana users must eventually become comfortable and more open with their habit. Second, a large portion of heavy users are medical marijuana patients who are legally allowed to consume marijuana. These two facets increase the likelihood that heavy use respondents truthfully answer the NSDUH survey questions. In contrast, light users can more easily conceal their habit and are more likely to socialize in circles where marijuana use remains a taboo subject, and to work in positions where marijuana use is frowned upon. These respondents are less likely to provide honest answers, and are more likely to underreport their marijuana use habits.
Colorado Marijuana Users – 2014
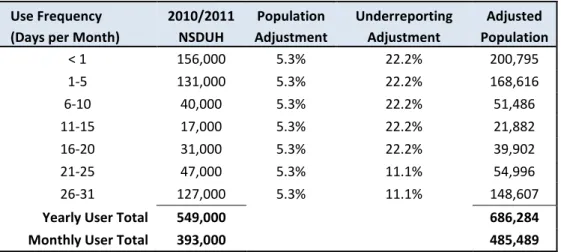
After incorporating the population and underreporting adjustments, for 2014, there are approximately 686,000 yearly users, of which 485,000 are monthly users. The following figure presents the adjusted yearly and monthly marijuana user population for 2014.
Table 5: Adjusted Colorado Marijuana User Population by Frequency of Use, 2014
Use Frequency 2010/2011 Population Underreporting Adjusted (Days per Month) NSDUH Adjustment Adjustment Population
< 1 156,000 5.3% 22.2% 200,795 1-5 131,000 5.3% 22.2% 168,616 6-10 40,000 5.3% 22.2% 51,486 11-15 17,000 5.3% 22.2% 21,882 16-20 31,000 5.3% 22.2% 39,902 21-25 47,000 5.3% 11.1% 54,996 26-31 127,000 5.3% 11.1% 148,607
Yearly User Total 549,000 686,284 Monthly User Total 393,000 485,489
Source: Marijuana Policy Group; SAMHSA NSDUH R-DAS, 2010/2011.
Daily Consumption among User Types
After learning about the number of users and frequency of use in Colorado, the physical amount of marijuana used by each person must be identified before a state total can be computed. There exist several datasets and studies to measure marijuana use prevalence, but until recently, there have been very few studies to understand how much
each user type demands. In the past, most researchers used a single, average annual consumption amount in order to compute total demand. However, recent literature such as Caulkins (2011), Kilmer (2013), and Zeisser (2011) show that an average rate is unreliable, and that heavy users account for the vast majority of marijuana demand in all markets.
The predominant finding is that marijuana quantities are strongly and positively correlated with frequency of use. In a Canadian marijuana study, Zeisser (2011) found that users who smoked on a daily basis consumed three times as many joints or marijuana bowls as those who consumed once per week. In a study across several European countries, Caulkins, Cohen, and Zamarra (2013) found that daily users consumed 1.5 grams of marijuana per day, whereas bi-weekly users (8 times per month) consumed 0.8 grams on average per day that they used, and monthly users (2 times per month) used just 0.4 grams per day of use. This shows a positive and increasing relationship between frequency of use and amount used per day.
Among the previously cited sources is the National Epidemiologic Survey on Alcohol and Related Conditions
(NESARC), a panel survey of the non-institutionalized U.S. population 18 years of age and older. The NESARC survey asked respondents how many “joints” they smoked per day. The survey results indicate that heavy users (near daily users) smoked 3.9 joints per day, while infrequent users (1 to 3 days during the previous month) smoked 1.7 joints during those use days. The survey is expected to be slightly biased because there is no response for less than 1 joint per day, even though many marijuana users sometimes share their joints with others. Instead of reporting “1/2 joint” per day, most users would simply round up to 1 joint, thereby creating the bias.
Kilmer, Caulkins, Bond, and Reuter (2010) estimated that the average weight of a joint is approximately 0.46 grams. If the NESARC survey estimates are used, then heavy users demand 3.87 joints, each with a weight of 0.46 grams, leading to daily demand of 1.78 grams per day. However, the usage patterns are from 2001, and since that time the potency and acceptance of marijuana have both increased substantially.
The most recent study (Kilmer et al., 2013) produced for the Washington State Liquor Control Board combines the findings from recent literature with their own survey focused upon Washington State resident consumption of marijuana. Their results suggest that heavy users consume 1.3 to 1.9 grams per day, with a point estimate of 1.6 grams per day. We believe that this estimate is the most accurate description of heavy marijuana use, and that it should be used in this study unless our own survey results indicate differently.
Therefore, based upon the Kilmer et al. findings, the initial estimate used in this report is 1.6 grams per day for heavy users—those who use marijuana more than 21 days per month—and 0.67 grams per day for regular users.
In a departure from other studies, we have added a third tier to the consumption rates. For the lowest user group, those who reported using marijuana less than once per month, the use amount is further reduced to 0.3 grams. This third tier is included, but it is noted that the change has a negligible impact upon total market demand. Total
demand is reduced by just 0.28 metric tons, which is small compared to overall demand that is well above 100 metric tons in Colorado.
Primary Data Collection
In order to verify (or reject) the results from other recent studies, the Marijuana Policy Group collected primary data from Colorado residents about daily use habits. The Colorado Marijuana Use Survey utilizes the best-practice methods that are similar to those developed by the RAND Corp as deployed in their Cannabis Consumption Survey. In particular, a set of use questions is combined with photographs that allow respondents to visually see how much marijuana corresponds to 1 gram of dried buds.
The web-based survey was deployed starting March 18, 2014. Like other surveys related to marijuana use, no personally identifying information was collected except for the respondent’s age and whether they reside within or Page | 16
outside of Colorado. A number of results emerged from the survey, but the most important initial finding is that these Colorado results confirm the other studies’ results.
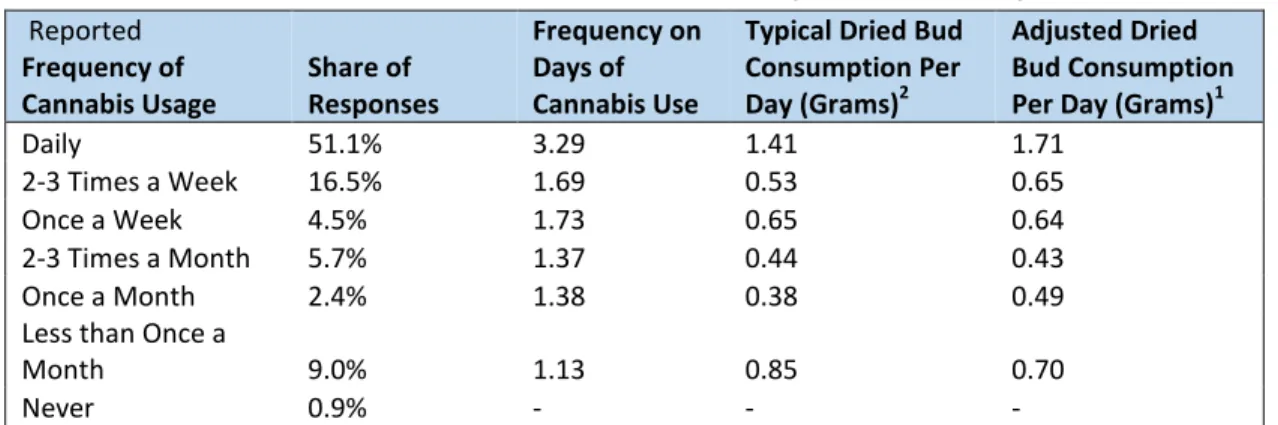
Table 6 : Results from the Colorado Marijuana Use Survey
Reported
Frequency of
Cannabis Usage Share of Responses
Frequency on Days of Cannabis Use
Typical Dried Bud Consumption Per Day (Grams)2
Adjusted Dried Bud Consumption Per Day (Grams)1
Daily 51.1% 3.29 1.41 1.71
2-3 Times a Week 16.5% 1.69 0.53 0.65
Once a Week 4.5% 1.73 0.65 0.64
2-3 Times a Month 5.7% 1.37 0.44 0.43
Once a Month 2.4% 1.38 0.38 0.49
Less than Once a
Month 9.0% 1.13 0.85 0.70
Never 0.9% - - -
Unweighted; n=299; 15 or more recoded as "5." See: “Marijuana Use Survey”, May 2014, submitted to the
Colorado Department of Revenue.
Table 6 provides the survey responses collected between March 18 and May 14, 2014. Most daily users indicate that they consumed between 0.5 and 1.5 grams per day, with many heavy users reporting much higher usage.
Conversely, almost no other users reported consuming high volumes of marijuana, with most of the low-frequency users consuming between 0.125 and 0.5 grams per occasion. These results confirm that a preliminary estimate of 1.6 grams per day for heavy users is close to the Colorado average as well. However, it also indicates that an average of 0.67 grams for regular users may be slightly higher than the Colorado average, which is less than 0.5 grams according to preliminary survey results.
Table 7: Quantity demanded by marijuana users during each day of consumption, by user type.
Grams per Day Use Days
Per Month Low Mean High
<1 0.20 0.30 0.60 1-5 0.43 0.67 0.95 6-10 0.43 0.67 0.95 11-15 0.43 0.67 0.95 16-20 0.43 0.67 0.95 21-25 1.30 1.60 1.90 26-31 1.30 1.60 1.90
Note: Estimates are based upon Kilmer et al. (2013) findings and preliminary survey results.
The weight quantities listed in Table 7 can now be applied to the prevalence rates determined in the previous section to compute the total market size for marijuana in Colorado.
Total Resident Demand
Using the formula presented in Equation 1 at the start of this report, it is now possible to compute the total market demand for marijuana in Colorado. Table 8 presents the total amount of marijuana, measured in thousand grams, for 2014 in Colorado. Total adult marijuana demand is estimated to be 121.4 million grams, or 121.4 metric tons. This total may vary if the average amount consumed by different groups is higher or lower than estimated in this study. For example, if users are closer to the “low” daily use amounts, rather than the “central” amounts, then total demand would be 96.1 metric tons. Demand would be as high as 148.1 metric tons if, instead, users consumed the “high” daily use amount.
Table 8: Total estimated demand for marijuana by Colorado residents in 2014. Results are disaggregated by user type.
Frequency
of use: Usage Amounts: ('000 grams) Share of ..
per month Low Central High users demand
<1 240 361 721 29.2% 0.3% 1-5 2,625 4,039 5,756 24.5% 3.3% 6-10 2,138 3,289 4,686 7.5% 2.7% 11-15 1,476 2,271 3,237 3.2% 1.9% 16-20 3,728 5,735 8,172 5.8% 4.7% 21-25 19,888 24,478 29,067 8.1% 20.2% 26-31 66,007 81,240 96,472 21.8% 66.9% Total: 96,103 121,412 148,112 100% 100%
Source: Marijuana Policy Group calculations. One million grams equals one metric ton.
Many of the previous reports have listed total Colorado demand using a different measuring unit than grams and metric tons. Table 9 provides a menu of values depending upon the preferred choice of measurement. The 121.4 central value, measured in metric tons, corresponds to 4.283 million ounces, or 267.7 thousand pounds.
Table 9: Colorado market size estimate for 2014 - viewed using different units of measure.
2014 Colorado Market Size Estimate
Unit of Measure Low Central High
Thousand Grams 96,103 121,412 148,112
Thousand Lbs 211.9 267.7 326.5
Metric Tons 96.1 121.4 148.1
Thousand Ounces 3,390 4,283 5,224
Source: Marijuana Policy Group calculations.
Note that these demand estimates include demand by all Colorado residents over 21, but not the amount demanded by visitors to the state. It is also worth remembering that this demand can be supplied by various channels, including Page | 18
medical marijuana dispensaries; medical marijuana caregivers, who are informal producers and vendors of medical marijuana sanctioned by state laws, but also considered to be “gray-market” vendor; by licensed retail marijuana vendors; or by unlicensed vendors who represent the black market. In addition, some of this demand can be
supplied by home production, where each adult resident is allowed to grow up to 6 marijuana plants, or 12 marijuana plants in a home with more than one adult. The prevalence of home-growing among marijuana users is 3.9 percent nationally according to NSDUH statistics.
Comparison with Previous Studies
This analysis suggests that the Colorado marijuana market is larger than previously thought. Much of the additional demand comes from the disaggregation of marijuana user types and the fact that Colorado has a high prevalence of heavy users compared with the national average.
Three previous studies for Colorado include the Colorado Futures Center (CFC) tax impact assessment of Amendment 64, which was released in 2013, the Colorado Center for Law and Policy (CCLP) study of Amendment 64, which was released in August of 2012, and the Department of Revenue (DOR) tax assessment, released in February 2014. The earliest study was by the CCLP. The CCLP study used summary statistics from the 2010/2011 NSDUH survey to obtain a 12.9 percent prevalence rate for adult marijuana users. This rate was then applied to the 21+ population for 2012 to obtain 495,050 users. The result was then adjusted upward by 20 percent to account for underreporting. The result was an estimated 574,040 users in the state. Each study’s prevalence estimate is shown in Table 10.
Table 10: Different User Prevalence Estimates for Colorado and Washington States
Estimated Prevalence Rate
Number of Marijuana Users Prevalence Rate: Implied
No Adj Adjusted No Adj Adjusted Year
Marijuana Policy Group1 485,000 687,000 12.4% 17.4% 2014
Marijuana Policy Group2 393,000 549,000 10.0% 13.9% 2014
Colorado Futures Center3 554,710 642,772 14.1% 16.3% 2014
Colorado Center for Law and
Policy3 495,050 574,040 12.9% 15.5% 2012
Department of Revenue3 720,616 13.4%* 2012
Washington State: 556,000 746,152 2014
Notes: 1. Users reporting use within the past year. 2. Users reporting use with in the past month.
3. CFC, CCLP, and DOR studies do not indicate past month or past year. * Reflects share of total population, rather than 21+ population.
Subsequent studies by the CFC and DOR utilized the CCLP results for several pieces of their own demand estimate calculations. The CFC study applies an average prevalence rate of 14.1 percent to the 2014 adult population, and then adjusts the prevalence by 20 percent to account for underreporting, resulting in an adjusted user count of 665,652. However, the CFC study claims to be focused upon licensed retail sales only. The authors then make an assumption that 79 percent of current medical users will switch to the retail market, but that 21 percent will Page | 19
maintain their red cards. This subtraction of the remaining red-card holders reduces their estimated retail population to 642,772 users.
The Department of Revenue includes an increase of users, from the 12.9 prevalence rate in 2010 to a 13.4 prevalence rate in 2012. This is roughly based upon a 0.3 percent assumed increase in the rate each year.8
Importantly, each of the previous Colorado studies are implicitly considering demand that is associated with the regulated retail marijuana market. While the retail market is expected to eventually supply a large portion of total demand, there also exist non-regulated modalities that have been serving the unregulated segment of the market for many years.
Demand Estimates
Most studies focus upon total marijuana demand for the adult population, while the CFC study focuses only upon the retail segment of the market. Most studies only include the state resident population in their calculations. The Department of Revenue study includes additional demand for visitors, using the same prevalence and quantity assumptions as for the Colorado adult population. It is not clear from that study how the visitors are included. All of the studies report demand using a weight measure for (dried) marijuana buds. The CFC study acknowledges that they do not include separate demand for edibles, but that the total estimate does include plant weight that is used to produce edibles.
Table 11: Comparison of Marijuana Demand Estimates for Colorado (and Washington)
State Demand Estimate Comparison
M. Tons Ounces Pounds
MPG 121.4 4,281,050 267,566
CFC 64.32 2,268,985 141,812 CCLP 57.45 2,026,360 126,648 DOR 92.65 3,268,192 204,262 WA State: 172.00 6,067,128 379,196
Sources: Marijuana Policy Group (this study), Colorado Futures Center, Colorado C and Law Practice, Colorado Department of Revenue, Tax Research Department.
Only resident demand is shown in Table 11, for consistency with other studies. In this study (MPG) estimates resident demand to be 121.4 metric tons in 2014. This translates to 4.2 million ounces, which is 89 percent higher than the CFC estimate (64.32 tons), 111 percent higher than the CCLP estimate (57.45 tons), and 31 percent higher than the DOR estimate (92.65 tons). The total demand is 29 percent less than the estimated demand by the RAND Corporation in Washington State, which is reasonable because Washington’s population was 33 percent larger than Colorado’s in 2012. Colorado demand is only 29 percent lower than Washington because demand is expected to be slightly higher than Washington on a per capita basis.
8 The number of users, 720,616, reflects 13.4 percent of all Colorado residents (as of 2012), rather than only residents who are
21+.
Page | 20
Visitor Demand
The potential demand for marijuana by out-of-state visitors could represent a significant portion of total retail demand. While many Colorado residents have medical marijuana cards allowing them to purchase at a lower tax rate and at a greater number of locations, out-of-state visitors must purchase from retail marijuana vendors exclusively. Preliminary revenue and sales data from the Department of Revenue indicate that for some counties about 90 percent of all retail sales are likely to be from out-of-state visitors.
In the City and County of Denver (“Denver”), indicative point-of-sale information provided by a Denver vendor showed that among 2,512 transactions during a typical week in March 2014, out-of-state ID card holders represented 1,117 of them, which represents a 44 percent rate of sales to Colorado visitors.9 This section attempts to
characterize the nature of visitor demand for marijuana, and to provide a rough estimate of visitor demand quantity. However, the methods used in this section are less robust than the resident demand estimates made earlier, so the results should be considered to be indicative only.
The major issue limiting the accuracy of visitor demand estimation is the dearth of data on visitor purchases. Retail marijuana sales started in January 2014, and the available methods for calculating visitor demand—tax revenue data and retailer point-of-sale systems—have made a very limited amount of data available for our purposes. As more data become available, visitor demand estimates will improve.
Destination Tourist Demand
Colorado is best known as a ski and mountain destination, with 11.4 million visitors to state ski areas such as Aspen, Vail, Breckenridge, and Keystone projected for 2014. But the number of visitors to Colorado is also increased due to other factors. The state’s central location in the country and its intersection of two major interstate freeways makes it a major transit artery between the East and West Coast areas. Denver International Airport is the 15th-largest
airport in the world by passenger traffic, so it also brings large numbers of visitors to the state. A ruling after Amendment 64 declared that it was legal to sell marijuana to out-of-state adult visitors. Each visitor can purchase ¼ ounce at a time from Colorado retail outlets, but there is no record of purchases, so any visitor can make multiple purchases in a single day, if desired. No individual may lawfully possess more than one ounce of marijuana at any given time, regardless of whether they are a resident or not, unless they are a registered medical marijuana patient (2 ounces).
During January and February of 2014, the impact of tourist demand was highlighted by the media in the Denver metro area, but it was strongest in Colorado’s mountain communities. Many counties and cities that currently permit retail marijuana are located in Colorado’s mountain communities and one of the counties is a major gaming (casino) destination.
Based upon sales tax reports from the Colorado Department of Revenue for January, total marijuana receipts in most mountain communities increased by more than 100 percent after January 1, 2014. By comparison, the metropolitan areas in Denver and Jefferson counties experienced more modest increases near 15 percent.
9 The licensee notes that some out-of-state purchasers have moved to Denver but do not yet have in-state IDs. Page | 21
Table 12 shows the percentage change in total marijuana sales (medical and retail) among six counties where retail sales were allowed and were reported.10
Table 12: Tourism Impact for Mountain Counties versus Metro Area Counties - Retail Demand is Highly Correlated with Tourists
County Communities within each County Resident Population Sales Change (%) To ur ist C ount ie
s Summit Breckenridge, Keystone, Arapahoe Basin,
Copper Mountain 28,970 162%
San Miguel Telluride 7,910 174%
Clear Creek Loveland 9,005 108%
Gilpin None / Casino Area 5562 141% Metro
Counties
Denver None 649,481 19%
Jefferson None 549,643 15%
Source: Authors' estimates based upon DOR Retail Sales data and demographics.
Two factors contribute to the large difference between mountain communities and metropolitan counties. First, visitors to Colorado cannot obtain medical marijuana cards and therefore must purchase through retail venders exclusively. Tourist destinations have a high ratio of visitors to residents, so the inception of the retail market services a large amount of marijuana demand by tourists.
Second, retail prices in mountain communities were 50–100 percent higher than prices for similar marijuana strains in the Front Range. The price difference is most pronounced for small servings. For example, a single gram serving near Keystone resort cost $14.00, whereas the same gram for an identical strain cost $7.00 in Denver.
In order to estimate the quantity of marijuana demanded by destination tourists in Colorado, several assumptions must be made. The first step is to convert reported revenues into physical weight equivalents. The most accurate conversion would identify the serving size shares and the associated revenues in order to account for different pricing regimes between the mountain communities and metropolitan counties. It is likely that most retail store sales in ski-area counties are for small servings, between 1 gram and 1/8 of an ounce.
However, for larger serving sizes, the prices are similar across regions. Most mountain communityvendor price lists indicate that an ounce of marijuana dried bud is available for approximately $200. In order to avoid over-counting the quantity of marijuana sold in mountain communities, we scale up the average price for dried buds to $320 per ounce. This represents a 60 percent higher average price for all marijuana (including edibles and infused products) in
10 Thirteen counties currently permit retail marijuana sales, but seven of these counties were aggregated for privacy purposes,
leaving six distinct counties to analyze. If there are fewer than three reporting firms in a district, then the Department of Revenue aggregates those tax districts with others.
Page | 22
ski-area retail shops.11 By imputing the average price for marijuana within each county that reported sales, an
imputed quantity of marijuana can be determined. By further extension, the current month revenue profiles can be projected into quarterly and annualized sales values in order to characterize the potential quarterly and annual retail and medical sales volumes for 2014.
Table 13 shows how this calculation is made. First, the total sales tax receipts are listed as provided by the Colorado Department of Revenue. Next, the associated sales amount is imputed from the tax revenues by dividing the tax revenues by the tax rate. There is a “low” and “high” amount listed because the sales value is different, depending upon whether the 2.9 percent rate is used or the 12.9 percent rate is used. Next, the imputed monthly sales values are multiplied by three to obtain a quarterly sales value. Finally, these quarterly sales values are divided by an indicative price of marijuana; each price depends upon the estimated price in each county. A higher price produces a lower quantity sold, which more accurately depicts the actual sales volume estimates for different counties.
Table 13: January 2014 retail sales tax revenues for recreational marijuana, and associated extrapolations of quarterly sales, and quarterly estimated quantity sold, in dry-weight equivalent.12
This exercise can now be extended to an annualized estimate of retail and medical marijuana sales values and quantities. Table 14 shows the results of this calculation if the sales tax values and volumes were extrapolated to all of 2014. As more data become available, a more accurate depiction of sales and physical volumes will be possible. An updated estimate will be prepared for the follow-up report planned for Q1 2015.
11 In the next revision of this report, we intend to utilize updated pricing and imputed quantity data to confirm those price
differences over time.
12 Dry weight equivalent is used here because there is currently no standard method for estimating the marijuana equivalent of
edible and concentrate product sold. The growing importance of edibles and concentrates in the marijuana market is discussed at the end of this report.
Assigned Average
Retail Price
County: 2.9% Rate 10% Rate High Low High Low $/Oz High Low
Jefferson $24,416 $65,626 $841,931 $656,260 $2,525,793 $1,968,780 $200 12,629 9,844 Gilpin $5,380 $15,647 $185,517 $156,470 $556,552 $469,410 $250 2,226 1,878 Denver $256,756 $728,651 $8,853,655 $7,286,510 $26,560,966 $21,859,530 $200 132,805 109,298 Clear Creek $12,770 $38,277 $440,345 $382,770 $1,321,034 $1,148,310 $320 4,128 3,588 San Miguel $12,121 $35,237 $417,966 $352,370 $1,253,897 $1,057,110 $320 3,918 3,303 Summit $37,274 $108,307 $1,285,310 $1,083,070 $3,855,931 $3,249,210 $320 12,050 10,154 Remainder of State1 $67,972 $199,790 $2,343,862 $1,997,900 $7,031,586 $5,993,700 $250 28,126 23,975 Total: $416,690 $1,191,534 $14,368,621 $11,915,340 $43,105,862 $35,746,020 195,883 162,040 Notes:
5. As additional tax revenue is reported and confirmed, the Department will be able to update the sales and demand figures accordingly. 3. Quarterly figures are computed by multiplying January figures by three.
4. Quantity is computed by dividing sales by an average estimated price per ounce per county.
Retail (Non-Medical) Tax Revenues, Imputed Sales, and Estimated Quantity Sold
January, 2014 Tax Revenue Collections
Imputed Sales Values for Jan. 2014
Imputed Sales Values for Q1 2014
Estimated Quantity of Sales, Q1 2014 (Oz)
1. Remainder of State includes the following counties: Adams, Garfield, Lake, Park, Pueblo, Routt, and Weld. 2. Imputed sales are computed by dividing tax revenues by the tax rate.
Page | 23
The figures in Table 14 are simple extensions from the previous table. The 2014 annualized estimates equal January retail sales values, multiplied by 12. For 2013, the DOR reported actual sales values for medical marijuana, so this row was included as a proxy for 2014 possible medical marijuana sales values. The volume of sales in the medical
marijuana market equals the 2013 medical sales, divided by an average price per ounce of $200. The result is an estimated 55 metric tons of sales in 2013, which is used for comparison to 2014.
These estimates clearly contain bold assumptions, but they provide useful indications of regulated market demand that can be refined as more data become available.
Table 14: Imputed Sales Values and Quantities for the State Based upon Sales Tax Revenues for Marijuana
Estimated Sales and Quantity Demanded High Low Imputed Values and Quantities for Q1, 2014
Imputed Sales $43,105,862 $35,746,020
Imputed Metric Tons Sold 5.56 4.60
Imputed Full-Year Values and Quantities for 2014
Retail Sales (Tons) 22.3 18.4
Actual Medical Sales
(Tons in 2013) 55 55 Estimated Total (Tons in 2014) 77.3 73.4 Of which: Mountain Community Visitors (Tons) 2.54 2.15
Source: MPG Calculations based upon Department of Revenue sales and revenue statistics.
Based upon retail sales volumes and average market prices in mountain communities, we estimate that current annualized marijuana demand for destination tourists is between 2.15 and 2.54 tons of marijuana. However, this figure is expected to increase as more counties and tax districts begin permitting retail store fronts. A rough estimate for total annual destination tourist demand is roughly double the current level, so that total destination tourist demand is expected to lie between 4.3 and 5.1 metric tons of marijuana equivalent after more retail stores open in the mountain communities. Our 2014 estimate maintains the current range of 2.15 – 2.54.
Transit and Business Visitor Demand
The Colorado Tourism Office, through its research vendors, estimates there were 29.5 million overnight trips to Colorado and 30.9 million day trips. The largest number of visitors come through the state’s airports, the second largest number pass through the states roads and highways.
It would be difficult to estimate the propensity for day trip and overnight visitors to purchase marijuana during their stay, so our approach relies upon reported sales tax revenues, combined with point-of-sale information supplied to us by Denver area vendors. We estimate current transit and business visitor demand in a similar fashion as with the mountain communities. Denver and Jefferson counties’ reported sales tax revenues are used to impute total sales Page | 24
values and quantities. Then, indicative values from a Denver area vendor are applied to the quantity sold in order to estimate metropolitan area visitor demand, which we call the “transit and business” visitor demand.
The MPG was provided with aggregated transaction data for a typical retail sales period in March 2014. Many licensees are marketed as “membership based” and may collect information that is not collected by the State. For sales-limit purposes, retail marijuana licensees record whether the government identification rendered is “in-state” or “out-of-state”. For the week of March 10-16, 2014, the number of sales transactions were recorded and are displayed in Table 15. The 1,117 out of state transactions represents a 44.5 percent share of total transactions for the week. This ratio will be used to provide an indicative share of visitor demand in metropolitan areas.
Table 15: In-state and Out-of-state transaction count for a single Denver area retail store.
Weekly Transaction Count by a Single Denver Area Retailer*
Patron ID Rendered: Transaction Count
In-State ID 1,395
Out-of-State ID 1,117
* All data collected are from the week of March 10, 2014, to March 16, 2014.
The county level sales values and quantities for Denver and Jefferson counties are reported in Table 16 below. Using January tax collections, their expected quarterly sales value are estimated to be between $23.8 million and $29.1 million. Using an average price per ounce of $200, this would translate into a sales quantity between 119 thousand and 145 thousand ounces.
Table 16: Denver and Jefferson County reported sales tax revenues for January, 2014 and the imputed quarterly value of sales and estimated quantity sold using indicative product prices
Retail (Non-Medical) Tax Revenues, Imputed Sales, and Estimated Quantity Sold
January, 2014 Tax
Revenue Collections Imputed Sales Values for Jan. 2014 Imputed Sales Values for Q1 2014
Estimated Quantity of Sales,
Q1 2014 (Oz)
County: 2.9% Rate 10% Rate High Low High Low High Low
Jefferson $24,416 $65,626 $841,931 $656,260 $2,525,793 $1,968,780 12,629 9,844
Denver $256,756 $728,651 $8,853,655 $7,286,510 $26,560,966 $21,859,530 132,805 109,298
Total: $281,172 $794,277 $9,695,586 $7,942,770 $29,086,759 $23,828,310 145,434 119,142
1. Imputed sales are computed by dividing tax revenues by the tax rate. 2. Quarterly figures are computed by multiplying January figures by three.
3. Quantity is computed by dividing sales by an average estimated using an average price of $200 per ounce.
Next, these quarterly estimates are annualized and combined with the 44.5 percent transaction ratio found in Table 15. The results are shown in Table 17, where full-year imputed recreational sales would be between 13.5 and 16.5


![{4′ [4 (4,4′ Bipyridin 1 ylmethyl)phenyl] 2,2′:6′,2′′ terpyridine}chloridoplatinum(II) bis(perchlorate) acetonitrile disolvate sesquihydrate](data:image/gif;base64,R0lGODlhAQABAIAAAP///wAAACH5BAEAAAAALAAAAAABAAEAAAICRAEAOw==)