Honors Projects University Scholars
Spring June 2nd, 2017
Smart grid technology in the developing world
Jacob R. Young
Seattle Pacific University
Follow this and additional works at:https://digitalcommons.spu.edu/honorsprojects
Part of thePower and Energy Commons, and theSystems and Communications Commons
This Honors Project is brought to you for free and open access by the University Scholars at Digital Commons @ SPU. It has been accepted for inclusion in Honors Projects by an authorized administrator of Digital Commons @ SPU.
Recommended Citation
Young, Jacob R., "Smart grid technology in the developing world" (2017).Honors Projects. 68. https://digitalcommons.spu.edu/honorsprojects/68
SMART GRID TECHNOLOGY IN THE DEVELOPING WORLD by
JACOB YOUNG
FACULTY ADVISOR, DON PETER SECOND READER, MELANIE PLETT
A project submitted in partial fulfillment
of the requirements of the University Scholars Program
Seattle Pacific University 2017
Table of contents Abstract……….………3 Preface………...5 1.0 Overview 1.1 Key players………...7 2.0 Literature review 2.1 Policies surrounding smart grid………10
2.2 Public opinion of smart grid……….13
2.3 Communications technology………14
2.4 Renewable and alternative energy integration………..16
2.5 Grid size and structure………..21
2.6 Applications in the developing world……….……..25
3.0 Analysis of smart grid potential in the developing world 3.1National compatibility analysis described…...……….…………32
3.1.1 Education and training accessibility……….33
3.1.2 Available resources vs. proximity to urban centers………..34
3.1.3 Development cost……….35
3.1.4 Political stability………...37
3.1.5 Kepner-Tregoe analysis and test summary………...37
3.2 Compatibility test results………...……….………..38
3.2.1 Education and training accessibility……….…………39
3.2.2 Available resources vs. proximity to urban centers……….……….40
3.2.3 Development cost……….………43
3.2.4 Political stability……….……..45
3.2.5 Kepner-Tregoe analysis……….…...46
3.3 Proposal of future work………50
4.0 Conclusion………..54 5.0 Glossary….……...………..56 Works Cited……….………58 6.0 Appendices 6.1 Appendix A……….……59 6.2 Appendix B……….78
Abstract
A smart grid is the integration of communication and information technologies with contemporary power infrastructure to enhance load service and to incorporate continually evolving end-use applications. It is the latest advancement in the areas of power generation, transmission and distribution. It has advanced beyond the traditional grid structure at every stage; a smart grid is capable of incorporating distributed generation (DG) renewable sources and has improved transmission capabilities through implementation of technologies such as Flexible AC Transmission Systems (FACTS). Through the addition of control technology in the distribution network a smart grid is able to implement “self-healing” and other methods to improve reliability of power supply. Enhanced interconnectivity also offers the option of microgrid development which can be accomplished more quickly and affordably than a large scale grid. The ultimate goal of this approach is to then connect various microgrids to establish a robust network. On the consumer’s side, smart devices are being developed which can practice load shifting to reduce demand on the grid at peak hours. One facet of this technology network is the smart meter, an enhanced metering device used by the consumer to practice demand side management through control technology and informed decision making. All of these characteristics make the smart grid more reliable, efficient, versatile, cost effective, interactive and environmentally beneficial than other systems. The goal of this paper is to first explore the characteristics of a smart grid system and to report on current work that is being done implementing these systems, particularly in developing countries. The latter half of the paper will then present a test for smart grid
compatibility on a national level based on the necessary and beneficial preconditions for smart grid development. That test will then be applied to nations that lack a significant or reliable power generation and transmission system. The results of this test will determine specific regions which meet the criteria for both a high compatibility for smart grid development and a high
demand for the solutions it offers. Those results will be synthesized into a proposal for future work, with the goal of broadening the global focus of smart grid development to include countries where millions of people still lack access to electricity in their cities and homes.
Preface
The sun shines brightly on a small village in Africa, no more than 200 people live here. There are children playing nearby, weaving through their mothers who are hanging clothes up to dry. In some houses the evening meal is being cooked over a kerosene fire. To the observer who may be a tourist on holiday they may not notice anything distinctly different about this village than those in their own country, even as the sun begins to descend beneath the horizon. Once darkness truly arrives, however, the observer will begin to wonder where all the lights are. This village, like many across the continent of Africa and in countries around the world, has no electricity. It does not even have power lines running above it that supply unreliable access to power a few hours of the day. The scattered homes are now completely dark, or else lit by the kerosene fires. These fires are the only source of light and heat they have access to. The poisonous carbon monoxide gas that is released from burning kerosene is a danger they cannot avoid. The children are now gathered around the dim fires in their homes with school books in their laps, while their mothers warn them to finish their studies soon so the family can conserve fuel. The children in the unlit homes are unable to study after the sun sets, many are doing worse than their peers as a result. This scenario describes the problem space for places around the world that lack electricity. These areas need reliable and efficient infrastructure, they need a smart grid.
1.0
Overview
There are more than 1.2 billion people in the world who don’t have access to electricity [5]. Those who lack this resource or who have unreliable electrical power often use open fires fueled by biomass to provide heat and light. This is the direct cause of death for over 4.3 million people per year who contract illnesses from household pollution [17]. There are also an
estimated 1.6 billion people who rely on kerosene and oil for their source of light. Kerosene has a variety of adverse health effects. Long term exposure to kerosene fumes could result in neurological or kidney damage including blood clots that damage the brain, heart or other organs, and most commonly, carbon monoxide poisoning. Providing electrification to these people will greatly improve quality of life, as well as nearly eliminate the health issues brought about by these alternatives.
While there has been a growing need for electricity around the world, a solution has been developing alongside it. Smart grid technology offers the blueprint for a better power generation, transmission and distribution system. It is more easily implemented than a traditional grid in areas that lack any infrastructure because of its versatility. A smart grid can operate effectively on a microgrid level, which is a system that may be only the size of a small village yet contains power generation, distribution, energy storage, smart metering and more. A larger smart grid can then be synthesized by connecting various microgrids, thanks to smart grids’ enhanced
capabilities to handle distributed generation (DG). Smart grids offer more reliability to consumers, a trait that is lacking in many infrastructures that have been built in developing countries. Smart grid implementation in the developing world has huge potential to address the need for electrification and many other needs, and is more feasible than any solution in the past.
This paper will describe the characteristics of smart grid technology and its current applications in the developing world before establishing a proposal for future work in the developing world.
1.1 Key players
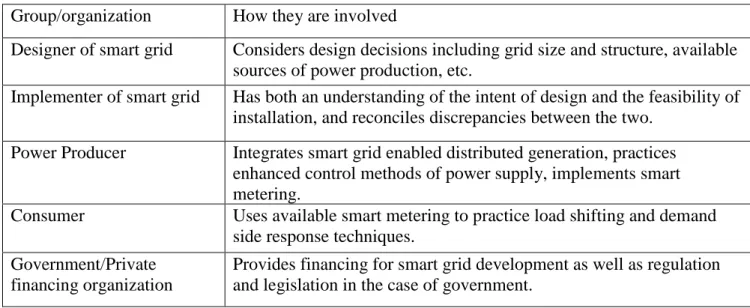
It is important from a systems engineering perspective to recognize the key players surrounding any technology in order to gain a better understanding of it. These different groups for smart grid technology include: the designers who are responsible for innovative thinking about smart grid technologies, the workers who construct and implement these technologies, power providers who must integrate smart grid concepts into their own grid structure, consumers of electricity who are responsible for increased participation via demand side controls, and the governments of countries responsible for funding smart grid projects and passing legislation regarding them. These different groups and their contributions to smart grid development will now be examined in order to gain a systems perspective on this technology, the discussion is summarized in Table 1.1.
The primary way in which the developers of smart grid technology contribute is through innovation. This innovative design is needed to fit the variety of contexts in which a smart grid may be deployed. As will be discussed in section 2.5 there is a critical design decision about grid size and the development of either a “microgrid” system, or else a large centralized grid, or some middle ground between the two. This design choice is completely contextual and is affected by factors such as budget, power reliability and desired grid performance, as well as the desire for integrating renewable energy sources to supply power to the system. The designer of a smart grid technology must therefore have a contextual understanding of the project in order to design an appropriate solution.
The primary way that constructors of smart grid technologies contribute is through assessing and enacting its feasible implementation. This will involve an assessment of
environmental factors to deployment of this technology which may not be obvious in the design phase. For example, a significant portion of smart grid design involves inclusion of renewable energy sources, which may include solar energy. However, if the construction plan involves adding a photovoltaic power generation system, yet the construction site is overshadowed by neighboring buildings and receives no direct sunlight, then that system is entirely ineffective. The contractor who is responsible for constructing the physical grid system will be the most responsible for observing these issues and making decisions to help solve problems.
The primary way that power producers contribute to smart grid technology is by integrating it with their own power grid network. Part of this process involves replacing old technology with new, such as the replacement of traditional electricity meters with “smart meters” that allow for demand side management of power supply. It also may involve the integration of renewable sources of energy to the power production system. These renewable sources however, as will be discussed, are often more effective with a small scale deployment scheme rather than large scale power production. The inclusion of various renewable DG will have an effect on the voltage level of the network due to their intermittency; therefore, the power supplier must be able to manage the multiple sources on their network. Lastly the integration of smart technology includes added responsibility on the supply side as well as the demand side to be managing load distribution. Power producers must employ control technology to measure and predict the load and to avoid excessive demand on the grid during peak consumption hours.
The primary way that consumers of electricity produced by a smart grid system
of the power supply system who makes decisions that affect the network. A prosumer interacts by using one characteristic of a smart grid which is the inclusion of various control technologies. One of the devices that is included in the control system is the smart meter, which gives the user a way to measure their power consumption in real time. An issue that arises in a non-smart grid system is the excessive demand on the grid’s supply during peak usage times of day, which can cause reliability issues or necessitate the use of expensive, inefficient and polluting “backup” power supplies. With the introduction of user or “demand side” control, the consumer is given the ability to practice “load shifting,” which is consuming power during non-peak hours. This informed participation of the consumer based on smart meter data allows for a more reliable and efficient grid supply system.
The primary way that governments, and also non-governmental organizations, contribute to smart grid technology is through funding and supporting through legislation the development and testing of these technologies. There are several examples of nations whose governments have chosen to invest a significant amount of funding and manpower in the development and testing of smart grids, the foremost of these include the United States, China, Brazil and India. The later three and their test projects will be discussed in detail as they represent a template for developing nations without existing infrastructure to implement this technology. Each of these governments have invested billions of dollars to support the development of smart grid
Table 1.1 Summary of key players in smart grid technology development
Group/organization How they are involved
Designer of smart grid Considers design decisions including grid size and structure, available sources of power production, etc.
Implementer of smart grid Has both an understanding of the intent of design and the feasibility of installation, and reconciles discrepancies between the two.
Power Producer Integrates smart grid enabled distributed generation, practices
enhanced control methods of power supply, implements smart metering.
Consumer Uses available smart metering to practice load shifting and demand
side response techniques. Government/Private
financing organization
Provides financing for smart grid development as well as regulation and legislation in the case of government.
2.0 Literature review
This section is comprised of a literature review on smart grid technology concerning its definition, characteristics, and design decisions regarding its implementation. Lastly a review of current applications of smart grid technology among nations considered developing is presented. This section predominately concerns the countries of China, Brazil and India, which are all forerunners in launching pilot projects and innovations of smart grid designs. These countries and their work in this field will provide information and background for section 3.0 which concerns compatibility analysis for smart grid development in other countries which lack substantial electrification.
2.1 Policies surrounding smart grid
In order to better understand the nature of smart grid technology as well as its capacity to be implemented, the policies and regulations that apply to smart grid development will now be examined. The foremost international authority on these regulations is the Institute of Electrical and Electronics Engineers (IEEE). Their policies on how to handle the transition from a
traditional electric grid to a modern or smart grid have been cited in multiple legislative acts. Some of these legislations that were created for regulation of the United States’ smart grid development shall be presented. In 2005 the United States Congress passed the Energy Policy Act, which cites the IEEE 1547 Standards and Best Practices for Interconnection as the national authority for interconnection of distributed energy resources (DER), which is a key innovation of the smart grid system [14]. Two years later the United States Congress passed the Energy
Independence and Security Act (EISA), which officially charged IEEE along with other organizations to “coordinate framework and roadmap for smart grid Interoperability standards and protocols” [14]. This legislation expanded the IEEE 1547 standard, among others, to continue to define smart grid development and implementation. Later in 2009 the Federal American Recovery and Reinvestment Act (ARRA) was put into effect. This much more complex piece of legislation was an attempt to stimulate the U.S. economy on a massive scale, and $4.5 billion was allocated specifically for the “modernization” of the electric grid. This led to federal investment in the Smart Grid Investment Grant (SGIG) combined with other investors to a total of over $8 billion to help develop new smart grid and “high penetration” DER projects [14]. This was the first large step that the United States took to implementing smart grid
technologies on a substantial level.
In order to better understand the basis for these key legislative acts, the underlying policies and standards will be examined. The previously mentioned IEEE 1547 Series is one of the foremost international standards for smart grid development. It deals with technical
specifications and requirements for the interconnection of DERs and the traditional Area Electric Power System (EPS). It also covers testing of those specifications and requirements [14]. IEEE 1547 therefore presents the primary technical standard and functional requirements for these
interconnections and their testing; it is also comprehensive enough to be sufficient for installation of most DER systems [14]. It does not include any information about the design, planning or operating of a smart grid system. The 1547 standard is effective when used as a reference during the design phase of smart grid development, because its specifications and requirements can be used as ultimate design parameters. It is also useful during and after installation to provide testing mechanisms in order to ensure that the installed grid is safe and functional.
Along with the pivotal 1547 standard IEEE also produced the 2030 Standard Series. While the 1547 series has a large focus on testing methods for smart grid applications, the 2030 standard provides definitions for terms associated with this technology. As a part of the revisions done due to the EISA the 2030 standard was written to document the IEEE standard definition of a smart grid, as well as an associated term called “interoperability.” The term interoperability is defined by Standard 2030 as “the capability of two or more networks, systems, devices,
applications or components to externally exchange and readily use information securely and effectively” [14]. This is a key aspect of smart grids that make them unique, there is a continuous exchange of information between many components on the grid. The standard also gives a concise definition from IEEE for what a smart grid is: “the integration of power,
communications, and information technologies for an improved electric power infrastructure serving loads while providing for an ongoing evolution of end-use applications” [14]. This definition highlights the different aspects of smart grid that make it unique. These include the integration of power and communication, which is done to increase control over distribution at both the supply and demand sides. The definition also includes the “evolution of end-use
applications,” which defines the smart grid as being highly receptive to innovation and improved technologies being added to it, including the addition of renewable sources as DERs.
2.2 Public opinion about smart grid
Because the effective operation of a smart grid system involves the active participation of many groups, it is important to understand the prevailing opinion about these technologies. A study was performed and published in the Renewable and Sustainable Energy Reviews journal which used a means of experimentally determining the mindset of consumers about smart grid technology. The research was performed using a tool called signal detection theory, which demonstrates a response under several input-signal conditions. The participants were presented with situations involving an actual smart grid design and its operation and asked to either confirm or deny claims about the usefulness and practicality of this technology. The questions that framed these scenarios are presented in table 2.1.
Table 2.1 List of questions used in end user perception study for smart grid operations and participation [11].
1 Have you adjusted your load-patterns to serve the utility supplier’s wishes? 2 Have you adjusted your load-patterns to fit the patterns of power generated by
renewable energy sources?
3 Do you adjust your micro-grid for the conditions of the utility supplier?
4 Do you know the values of power quality in real time for improving energy quality in the smart grid?
5 Do you know the fault conditions that affect the complete smart gird?
6 Do you want to monitor energy theft in the complete smart gird?
7 Do you desire to monitor the improvement of environmental conditions from reduced
CO2 emissions in the entire smart grid?
8 Do you want to include your solar-energy production in your micro-grid or smart grid system?
9 Do you want to include your wind-energy production in your micro-grid or smart grid
system?
10 Do you prefer to be involved in dynamic tariffs and load shift?
11 Does accurate meter reading change your decision about energy consumption?
12 Are you using community social capital to build a community micro-grid?
13 Are you willing to install your own generating capacity under the current government conditions?
14 Are you willing to accept smart metering in order to provide information that helps the smart grid?
15 Do you agree with the rules and infrastructure required for smart grid technology?
The participants who represented the end user population were assessing the smart grid scenarios based on the perceived usefulness and ease of use of that technology. It was found that most end users have a conservative criterion, or low level of confidence in the usefulness of smart grid technology, and that the root cause of this was that it was “not a well-known technology for end users” involved in the experiments [11]. This is evidenced by the fact that despite an observed interest in the general public about global environmental health, the sampled group of end users still had a lack of confidence in smart grid technology, which focuses on sustainable energy production integration. The sampled user population may also be unaware that smart grid technology is capable of reducing cost of power by enhancing system efficiency. A population of consumers that lack knowledge of and confidence in smart grid technology will reduce the effectiveness of the smart grid system. This is because the end user is intended to play an “active and efficient role” by detecting power information through a smart metering system and implementing practices such as load-shifting [11]. This research suggests that given proper knowledge and incentive, the end user population will adopt smart grid technology because it directly serves the desires of the majority of that population. It is only a matter of making that knowledge available and the technology accessible.
2.3 Communications technology
An important aspect to the management of a power system is the ability to predict the load of the system. This allows the operators to plan for variable load demand and to make adjustments based on this knowledge. According to an article written by Ioannis Panapakidis with the Department of Electrical Engineering at the Technological Education Institute of
Thessaly, there are a variety of load forecasting models, and no one model has a universal advantage but each are advantageous in specific situations [8]. It is therefore an objective of this paper to determine which model or models are most effective when applied to potential smart grid systems in the developing world.
Panapakidis does explain that an effective forecasting model always has a few basic properties: “low computation burden, capability of simulation of the human expertise, flexibility, interpretability and exploitation of the results” [8]. Furthermore, almost all existing models can be classified as fitting into one of two categories: trend methods and similar-day approaches. The first method is truly “forecasting” the load demand based on available historical load values and their trends. The second model type compares current and historical load values, and accounts for other exogenous factors other than the load itself to produce a “training set” that the model is then tested against until it performs well enough to be implemented. If the model is not
forecasting with acceptable efficiency, the training set is adjusted and the model is retrained and then re-implemented. This category of models is often called “cluster based” [8]. According to the research that Panapakidis cites, a hybrid of the forecasting and clustering models is suggested for the purpose of lowering forecasting errors.
Panapakidis next introduces another method of categorizing forecasting models which is their predictive power. Most commonly models are either day-ahead or hour-ahead forecasts. Panapakidis states that “Hour-ahead forecasts are potentially essential in smart grid paradigms with prosumers that bid load reductions hourly, in distribution system lines congestion
management and operational planning of distributed generation and storage technologies” [8]. Panapakidis suggests that a smart grid system hinges on load prediction on an hourly basis, because both the consumer and the power manufacturer will be making adjustments to the
system multiple times daily, therefore smart grid load forecasting should be focused on hour-ahead models.
Panapakidis makes an observation of the current load-forecasting models: that they are most equipped to deal with large-load systems. “While the load level decreases, the deterministic character of the load sequence tends to limit” [8]. A large load system is typically considered to be on the scale of a country or a region, and there is a gradient between that and the smallest load variety which are micro grids. The nature of smart grid technology therefore makes it difficult to integrate with current load forecasting methods, because “the continuous evolution of smart grid and micro grid technologies provide the methods for the development of grid-independent small scale power communities” [8]. Smart grid technology, at least the beginning stages of it, lends itself well to a small scale or micro grid application, therefore there is a need for improving load forecasting models for small systems. This paper will continue to explore the consideration of grid size in developing a smart grid system.
Panapakidis believes that the solution may be in the innovative use of hybridized forecasting with an hour-ahead load model. The trend of smaller smart grid systems is that they are composed of “a large number of buses; their consumption patterns differ significantly and characterized by stochasticity and presence of outliers” [8]. The research conducted by Panapakidis demonstrates that this hybridized hour-ahead load forecasting model is able to “effectively stimulate the nonlinearity and the special attributes of bus loads,” which makes it a good candidate for the current stage of smart grid technology development.
2.4 Renewable and alternative energy integration
In regards to renewable energy concepts being pursued in the developing world there is a great deal of effort put into innovation. There are some countries that are becoming developed at
a rapid rate which results in the unique combination of high electricity demand as well as a capacity to invest in new technology development. Countries such as Brazil, China, India, Mexico, Russia and South Africa fall into this category. According to data gathered by the International Energy Agency (IEA), in 2008 these countries spent more on research,
development, demonstration and deployment of renewable energy technology than IEA member countries did [9].
India is in a unique situation in that it was one of few countries with the capacity to develop nuclear power generation technology that was excluded from the Nuclear Non-Proliferation Treaty, which means that it has spent decades developing a “largely indigenous” nuclear power program [9]. India also holds 25% of the world’s known reserves of thorium, which can be used in a pressurized heavy-water reactor (PHWR) to absorb additional neutrons and become fissile and useful for nuclear reaction. This innovation with thorium based reactors will allow India to make use of its large supply of the element and develop more infrastructure for this type of alternative energy. As of April 2015 the Indian government stated that a 300 MW advanced heavy water reactor (AHWR) for the processing of thorium has been developed and will be implemented as a new standard.
Elsewhere in the world, where even less capacity for large infrastructure exists,
innovation still occurs. In 2014 a startup company in Tunisia called Saphon Energy demonstrated their design of a bladeless wind turbine [9]. This design replaces the rotating blades and hub with a sail shaped body. It not only minimizes materials and environmental impact, but allegedly is able to capture “twice as much wind energy as a conventional bladed wind turbine for the same swept area” [9].
In a partnership of ideas between the University of Nottingham and local universities in Bangladesh, Nepal and Kenya, the researchers in these developing countries have been able to test and improve upon the design of a thermo-acoustic stove. This device uses an ambient heat exchanger (AHX) to remove heat from the stove which is generated by fuel burning. The air within the stove then undergoes “repetitive thermal expansion and rarefaction to produce acoustic energy” [9]. Between the heat source and the AHX there is a porous regenerator whose purpose is to sustain a resonant acoustic wave from the acoustic energy being produced. Then a closed loop linear alternator converts that resonant wave into electrical energy. This technology, while still requiring more development in order to make it perform as well as a conventional oven, serves another distinct purpose for the areas it is being tested and implemented in. This stove was developed as “a means to reduce health problems that occur from chronic exposure to smoke and other pollutants emitted by rudimentary wood-fired cook stoves and open fires” [9]. This type of innovation is important, because it solves more than just the immediate energy need of people in the developing world, but also recognizes that there are other related issues that are not always obvious.
While current models of renewable energy are important to discuss, it also must be evaluated how these renewable generation sources integrate with smart grid technology. The common model for smart grid development shares an important characteristic with most
renewable energy generation, which is that both involve distributed generation. Most smart grid models are characterized by “small rating electrical sources, typically decentralized and located close to the end-user locations” [13]. One primary reason for this is that it provides enhanced grid security; having distributed generation means that the failure of one power source will not cause a global failure, and power can therefore be rerouted to ensure grid integrity [13]. The
reason that renewable energy generation is typically distributed is because of its limited power production capabilities. Currently the power production capabilities of most renewable sources are much less than that of oil, coal and natural gas facilities, and therefore it becomes less feasible to build a centralized renewable energy facility as it would need to be built on a very large scale. Building multiple, decentralized and smaller scale renewable energy
systems is the most cost effective way to use the technology.
It is promising that smart grids are capable of operating on a microgrid level which can make better use of small and distributed renewable energy production than a larger system could. It is also noteworthy that smart grid innovations can alleviate issues related to renewable energy production such as intermittent power production and voltage variation. An article published by the Renewable and Sustainable Energy Reviews journalstates that “renewable generations cause new challenges to the distribution system over centralized, predictable, and dispatchable
production due to their intermittency and fluctuating characteristics” [10]. The article states that the most prominent renewable generation sources such as wind energy and solar photovoltaic inherently involve significant fluctuation, due to changing wind speeds or changing solar collection. These fluctuations of power production cause a variation of voltage from the source, which can result in “degraded protection, two-way power flow, and increased fault level” [10]. These issues are common and can be crippling when renewable energy sources are implemented in the current centralized grid model. The smart grid is able to employ control technology to mitigate negative effects of renewable integration thereby making it more feasible [10].
The smart grid differs from a standard grid system by employing control technologies for the purposes of monitoring and analyzing power flow, and for sending communication and control signals throughout the system [10]. Through these enhanced levels of information about
the grid and control over it a smart grid system can enable a more complex system of loads and DG, including renewable sources of power. The primary issue in renewable energy production is that the lack of control over the energy source results in a lack of control over voltage and power output. Smart grid technology offers three primary methods to address the power production issues of renewable sources. These are inclusion of standby conventional power sources, demand response, and the addition of energy storage [10].
Employing standby power sources involves the most automated control of the grid. The conventional power sources would be on standby mode until production from the renewable sources stops, at which point the standby would rapidly be turned on in an effort to maintain constant production. In theory this works, but “it is difficult to achieve in practice the required level of power tracking capability” [10]. More than lack of precision, it is also costly to build and maintain these standby power sources when they are not being used to their full capacity. Overall this approach to solving the issues in renewable power production is the most costly and also not very effective.
Smart grid technology also allows for the use of demand side integration, of which
demand response is an integral part. This method involves “active participation of both producers and consumers of electrical energy in network operation.” Producers might participate in demand response through employing a “time of use rate, real time pricing and direct load control” in order to minimize energy usage and add incentive for consumers to do so [10]. Consumer participation includes “energy consumption reduction through load curtailment strategies and load shifting to off-peak period” [10]. Consumers and producers must therefore be informed about overall grid power production and consumption, in order to make decisions to mitigate stress on the grid during “peak periods.” This is made much more feasible with the development
of smart metering infrastructure, which provides “real time data” to these groups and allows for “demand side voltage control” [10]. Demand side integration has been shown to be an effective way to “mitigate voltage variations with minimum network reinforcement and constant output of the renewable generation sources” [10]. Demand response allows for the ability to control the load demand in response to variations in power production and overall load consumption, which is an effective way to handle a variable production source.
Smart grids may also resolve distributed power production issues by the inclusion of energy storage. Energy storage can be used to normalize a variable production source, by storing excess production when it is greater than the demand, and then utilizing that stored power when the demand exceeds production. Smart grids integrate this technology by installing small energy storage units near the end user, such as on the feeders in a residential distribution network [10]. Having a local or community energy storage system means less line loss in power distribution when the stored energy is released. Also in keeping with the demand response paradigm, it allows for the local consumer side to be responsible for the distribution of their own locally stored power. This method has been shown to reduce voltage variation problems in grid systems that have significant renewable generation sources included [10].
It is therefore evident that a smart grid model is more adept at utilizing renewable energy production than a standard centralized grid scheme. By employing a distributed, interconnected structure and by using methods such as integration with conventional power production, demand response and energy storage to manage the load and the power quality smart grids can make renewable energy production efficient and useful [10].
As will be discussed in section 2.6, it is worthy of note that the majority of successful smart grid applications have so far been implemented with small, decentralized infrastructures, such as a microgrid. This is partially due to smart grid development being in its early stages, but it has also been shown that smart grid technology works well in smaller systems which employ DG [10]. In planning for the future of smart grid it is important to consider whether this
technology should be applied large grid structures, such as the United States system, as well as to microgrid schemes. Researcher Paul Hines of the University of Vermont and his colleagues have attempted to model the “optimal planning of networks that deliver services or otherwise provide connectivity over physical space” [4]. The goal of their efforts is to “describe the conditions under which it is optimal to build decentralized network infrastructures, such as a microgrid, rather than centralized ones, such as a large high voltage power system” [4]. They have chosen to perform this analysis by selecting the simplest set of conditions for decision-making in grid design. Using the two conditions of cost and network reliability they generated spatial models for optimal grid size based on these variables.
The first stage of the grid size model which considers capital cost of building the
infrastructure and interconnections within the network is relatively straightforward. The analysis performed suggested that “as capital costs increase network sizes decrease gradually, according to a power law” [4]. It makes sense that as the cost of building a grid increases building a larger and more interconnected grid becomes less feasible due to the total cost becoming excessive. Therefore if the cost of building infrastructure and interconnections is high there is a strong argument for smaller, decentralized systems which can be installed individually and represent much less cost upfront. When interconnection cost is low then highly connected centralized systems become more optimal because these have the advantage of increased reliability.
Reliability is the other parameter used in this modeling system, it is observed that “as the value of reliability increases network sizes increase abruptly – there is a threshold in the value of reliability at which large, highly interconnected networks are economically justified” [4]. A large and centralized grid offers increased reliability due to its larger amount of redundant
connections. Those redundancies help prevent failure in power supply and as reliability becomes more significant of a factor having a large, redundant system becomes advantageous. When the importance of reliability is much greater than the cost of building interconnections, “the extent of interconnection redundancy increases even in a highly connected network” [4], meaning that affordable, highly reliable networks are optimized by a large centralized network. It is only when the cost of interconnection and network reliability are both high that it is “sensible to build redundancy through additional local supply rather than through interconnection” [4]. This means that if the cost of building interconnections exceeds the cost of building DG sources by a certain amount, then decentralized systems again become more optimal. It is even observed that the cost of interconnection must be “orders of magnitude smaller than the value of reliability” for a centralized network to be justified. Therefore a situation where it is costly to build
interconnections and where the network reliability is high is most optimally implemented by the decentralized network.
In order to test this modeling program on a real geographical region, the country of Senegal was selected. This region represents a low electrification area, “About half of the countries’ population still has no access to electricity” with electrification rates in rural areas as low as 28% [4]. Despite the low levels of infrastructure for electricity, there is a large amount of infrastructure for mobile communications, with 1666 mobile phone towers distributed across Senegal and a mobile phone penetration rate of practically 100%. Because the mobile
communication system is so well developed, the concentration of mobile towers can be used as an estimation to predict the concentration of electricity needs. The optimal grid modeling was done without any constraints on reliability, and it produced “tree-like networks that are similar in structure to what we found with randomly distributed vertices…the network realization
resembles the spatial topology of the existing electricity grid in Senegal” [4]. This test using a real geographic region with non-random load centers confirmed that a modeling system based on the simple parameter set was accurate.
The Senegal test also confirmed what Dr. Hines refers to as the “power law.” Using the optimally placed distribution of grid components, the model also tested various costs of
infrastructure construction to see how varying this parameter affected resulting grid size. It was found that the optimal grid size and structure obeyed the power law, which theoretically
calculates how the cost parameter affects optimal grid size. This power law is given by the relation 𝜔−2/3, where 𝜔 is the cost of one unit length-capacity used in building interconnections for a given network [4]. The power law shows that, while it can logically be surmised that as network infrastructure costs increase the optimal grid size decreases, in actuality the optimal grid size decreases very gradually. The Senegal analysis results demonstrated that 𝜔 had to increase several orders of magnitude before optimal grid size decreased appreciably due to the increased cost [4].
The power law has implications on the ultimate goal of this modeling system, which is to determine the optimal size of grid infrastructure for any given situation. However what the power law means is that if cost is the most important factor involved then an optimal grid structure cannot be determined. The information necessary is the distribution of demand for electricity, and because of this “there is no single optimal size for infrastructure networks, but
rather that different sizes are likely to be optimal for different locations.” [4]. This modeling system therefore suggests that “a highly connected power grid” is only optimal if the cost of transmitting power is very small relative to the cost of producing power locally in a decentralized system, and also as the value of reliability increases so does the optimal grid size. Future analysis that is applied to specific regions should include the geographic distribution of load centers as a third important parameter that has a significant effect on grid structure.
2.6 Applications in the developing world
The benefits of smart grid technology have already been discussed, and it has been demonstrated that this system design can be more cost effective and power efficient than
traditional grids, is very compatible with inclusion of renewable energy sources, helps eliminate failures in power supply, and in general gives more control to both those involved in power generation and distribution and to the end user. However, despite the universal advantages to utilizing this technology, its development and application have been very imbalanced based on a region’s economic status. It has been observed that the “application of smart grid in developing countries is still lagging behind as compared to the developed ones” [3]. The remainder of this paper is concerned with presenting a description of the status of smart grid technology in the developing world and assessing the future work that needs to be pursued in order to most effectively provide this technology to these regions.
According to an article published in the Renewable and Sustainable Energy Reviews journal in 2013, there are a few countries that are considered “developing economies” which stand out in the area of smart grid development. As mentioned in section 2.4 these are China, India and Brazil. These few countries among many in the developing world have demonstrated “proper planning and developing in this technology…therefore, according to the developing
progress for smart grid in China, India and Brazil, a pattern of reference for other developing countries is suggested” [3].
The development of smart grid technology in the country of Brazil will now be examined. Unlike many other nations that are considered developing, Brazil has a large and centralized power production and transmission grid in place similar to those found in developed countries. However the Brazilian grid system is problematic in many ways, including “obsolete assets” in its distribution network, an average of 8.7% commercial power lost in transmission, and issues with blackouts and loss of power provided [2]. A literature review produced by researchers at the University of Sao Paulo identifies the main incentives for smart grid technologies to be developed in Brazil as “the reduction of cost [of power production and transmission], increase of reliability and quality of energy services, reduction of technical and commercial losses; grid preparation for the future, and environmental sustainability” [2].
Because of the issues of the Brazilian grid, the national government has funded multiple large scale projects to test and demonstrate different aspects of smart grid technologies. The action plan to raise this funding is named Inova Energia, and it involves the “joint effort of the Brazilian Development Bank (BNDES), Brazilian Electricity Regulatory Agency (ANEEL) and Brazilian Financer of Studies and Projects (FINEP)” to provide US $920 million for projects” [2].
The first of these projects is the “Smart City” of Buzios. The goal of this project was to build the “first smart city” in Latin America, which would “implement clean technologies…align with the current societal problems…and acquire experiences on new smart technologies” [2]. The scope of this project was 10,000 consumers ranging from “homes, industries, businesses and public services,” with an overall grid system rated at 36MVA and a power consumption rate of
55GWh/year for a three year period [2]. The Buzios project had many focuses including “energy management, generation and storage, electric mobility, public lighting and smart buildings, telecommunications, grid automation, broadband internet, and consumer awareness” [2].
The management of energy consumption is an important aspect to all smart grid projects, and like many others the Buzios project accomplished this with smart meters. These meters had a communication network of their own; each consumer unit had its own smart meter located inside it monitoring energy consumption, and each transformer station had a data concentrator which compiles regional data to be sent to the central system, which processes all of the data and manages grid activity [2]. This system allows for automated reading of electricity consumption, automated billing and quality of service control.
In the category of power generation and energy storage, the Buzios project chose to have each consumer producing local power by using solar panels and small wind turbines, as a way to supplement centralized production [2]. The power produced by centralized systems also
incorporated renewable energy sources, and also involved a 200kW battery bank for energy storage. This storage system was then use to help reduce strain on the grid during peak demand, when energy consumption was reaching the same level as energy production, the stored energy would then be used so that energy production systems could have reduced usage [2].
The Smart City was lit using 150 LED grid integrated lamps, whose brightness was remotely regulated based on the time of day and the level of people flow [2]. Finally, the consumer awareness program focused on “disseminating information about sustainability and rational use of energy and natural resources, together with the local identity of the population, raising awareness to support the project and to incorporate it in the people’s daily life” [2]. This aspect of the Buizos project is a sometimes overlooked asset to smart grid development. Because
the demand side regulation of power involves the active participation of the consumer, not just the producer of power, it may be worthwhile to invest more time and energy into consumer education than some projects choose to do.
The application of smart grid technology in China is also a key example for developing countries. China represents a unique case as it is a very rapidly developing economy with massive energy demands, much larger than most other countries. China’s electricity demand is predicted to increase by 233% over the period of 2007 to 2050, up to an estimated 9500 TWh [3].Smart grid development can help alleviate the problems that this extreme growth rate creates by utilizing a more robust and efficient generation, transmission and distribution system. In addition to the need for a greater power supply capacity, the Chinese power grid is under internal and external pressures to integrate more renewable energy sources and thereby reduce its carbon footprint. A primary issue that China currently faces in harnessing these sources such as wind and solar is an uneven distribution of these sources and in particular a lack of overlap between regions of high production potential and high demand [1]. Therefore the smart grid solution will also be useful for its more advanced distribution and transmission capabilities including
distributed generation integration as previously discussed in this paper.
China’s case is a useful one to examine particularly because it is under the process of rapid development and is in a sense in transition out of the class of nations in the “developing world” and towards those that have strong economies and infrastructure. In fact there is a direct correlation between the rapid development of China and its environmental issues [1], as it has been forced to rely on coal as an expedient source of energy. The ways in which the Chinese smart grid system is tailored towards addressing the consequences of its transition out of an
undeveloped state will be useful in the design of smart grid systems for nations with little to no development.
The concept of smart grid technology was first introduced in China around 2006 and was immediately adopted as a popular direction for the future of the Chinese power system. Since then the Chinese literature on this development has also rapidly grown, one article published in the Asian-Pacific Power and Energy Engineering Conference (APPEEC) describes the plan for development in China for a “strong smart grid.” This design is made possible with China’s unique current grid structure that operates at “ultra-high voltage” of roughly 1000kV AC and 800kV DC [6]. The planned “strong smart grid” is still intended to maintain the characteristics of lower voltage systems, and will integrate information based control over transmission, as well as higher levels of interaction on the parts of both consumer and producer [6].
China has successfully invested in some key technologies of smart grid development, such as DG. Because of China’s unique situation of rapid growth of infrastructure as well as areas of high production potential but lower demand, DG has been used for more than as a supplemental power supply, which is its common use in well-developed grid structures. The growing Chinese grid in some cases uses DG as the only means of providing in remote areas where the larger grid structure does not service [1]. The bulk of China’s DG systems that were built before smart grid plans were made need to be overhauled, as many of them contained small thermal plants which were cheap but highly polluting. However other DG systems that were powered by small hydropower can be readily integrated into smart grid development, and in either case the existing distribution network is a valuable base for further infrastructure [1]. Additionally as a part of the Chinese government’s initiative to build upon its DG resources, further investment will be made in its vast untapped wind energy sources, particularly those
located offshore near eastern cities and demand centers. Solar powered systems have likewise been installed and used as DG sources powering regions of China where the grid does not service, and further plans to install an additional 20,000 PV rooftop systems by 2020 are being enacted [1].
Aside from the construction and design of better DG systems, China is in the development phase of other key smart grid technologies. The next level of complexity and organization is connecting DG sources to loads and distribution networks in an interconnected microgrid. One of the purposes of a microgrid is increased interconnection, including connecting an “islanded” network to a larger grid or allowing it to operate independently. The multiple modes of operation make a microgrid system much more reliable than the larger grid which is prone to more frequent failures, as well as increased power potential over a simple DG source. The Chinese government is again a major instigator in the development of this technology, with plans to install 30 different microgrid projects for testing and refinement [1]. Research is also being conducted on the bi-directional communication channel and smart metering system which will enable demand side management (DSM), a key innovation discussed previously in this paper [1].
Thus far the most robust and successful implementations of smart grid innovation by developing countries have been presented in the cases of Brazil, India and China. However it is important to note also that these countries represent significant economies, and despite their classification as developing they are in a much different state than countless other nations in regards to infrastructure and economic wellness. These countries therefore represent a transitory stage, not only are they the forerunners of smart grid development among developing nations but they also are at the forefront of other areas of development. I believe that this enforces their
usefulness as cases to be examined for the benefit of other nations attempting to transition towards establishing economic and physical infrastructure. The remainder of this paper will be dedicated to the task of determining factors that aid or hinder the development of smart grid technology and apply these to the generation of a national compatibility test for smart grid development. Through the application of this test will be determined some of the best candidates for nations with high smart grid potential as well as high need for it, and finally a proposal of future work for smart grid applications in the developing world based on the results of these tests will be presented.
3.0 Analysis of smart grid potential in the developing world
3.1 National compatibility analysis described
Smart grid technology has many advantages over the typical grid system that allow it to address specific needs that are experienced to different degrees in different regions. The needs of a nation or region vary significantly based on economic and development status. Smart grid applications in areas such as the European Union and the United States are focused on optimization and customer satisfaction. They accomplish tasks such as replacing aged infrastructure, improving reliability, integrating existing and future DG, strengthening the distribution network using more advanced communication technology, and microgrid
development. The applications in developing regions such as China are focused on establishing new infrastructure including the development of new renewable DG sources to replace more polluting generation methods, and also to handle the rapidly growing energy demands of the developing nation [1]. In general, smart grid applications in the developing world will look to address similar problems to these, and will address areas of need through the development of new infrastructure that is DG compatible, implements microgrid technology, improves network reliability and also implements demand side management to give the consumer more control of their power consumption.
Through examination of the characteristics of a smart grid earlier in this report it has become clear that there are certain criteria that if met make a nation much more compatible for this technology. I will examine these factors and compile them into a test for compatibility of a nation for smart grid development. The factors that appear to have the greatest effect on
compatibility are: access to appropriate education and training, proximity of demand centers to renewable energy production areas, available government spending, and political climate and
stability. As a precondition to be considered before assessing the factors of the compatibility test, nations will be filtered based on the percent of their population that has access to electricity. This means that the test will only consider nations in which 50% or less of their population has
reliable access to electricity. In this way the test will be considering developing nations who have the greatest need for electrical power infrastructure to be developed. All percentages were
obtained via the World Bank database which has collected data as recently as 2012. The nations to be considered for this compatibility test are presented in table 3.3.
3.1.1 Education and training accessibility:
Firstly, as a means of determining a nation’s compatibility for smart grid implementation its rate of enrollment in tertiary education will be assessed. In order for a nation to provide its citizens with the proper training to operate a smart grid system they must have higher education institutions, including trade schools and universities. The specialized knowledge provided by these institutions is a necessity for being able to properly construct, operate and maintain a smart grid system. All information regarding tertiary enrollment was obtained from the World Bank database and its information regarding global education, which was collected between 1960 and 2016 [16]. The percentages given by World Bank pertain to groups of individuals who were surveyed during and after their secondary education. Many groups have been assessed since 1960, and the percent of each year’s group that enrolled in a tertiary education institution was reported. The compatibility test will consider the most recent percentage for each nation, and because data is not available for every nation for each year, only percentages since 2008 will be considered. If the most recent percentage is greater than a 5% enrollment in tertiary education then that nation will be considered more able to educate its population than other nations being
tested. Table 3.4 presents each of the 42 nations that have an enrollment percentage of greater than 5%.
3.1.2 Available resources vs. proximity to urban centers:
Secondly, in order to assess the potential for renewable energy sources to be adopted in a nation the proximity of sources of renewable energy to the large demand centers such as cities must be examined. China will again demonstrate this consideration, with the example of its potential wind energy as one type of renewable source. China has a huge potential for wind energy to be harnessed, an estimated 2548 GW of power production capacity in 2006 [1]. However the majority of wind energy potential lies in western China which is much less
populous and lacks the large urban centers of east China. Therefore in order to make use of this renewable source effective integration and long-distance transmission technologies must be utilized [1]. As previously discussed, smart grid systems are much more adept at transmission of power over distance and minimizing power loss. An example of smart grid transmission
technologies are Flexible AC Transmission Systems (FACTS), which are located along the transmission route and increase quality of power supplied, reduce transmission losses and improve network stability [1]. These and other control devices that are added to the transmission system are essential for long distance transmission as well as the intermittent power supplied by distributed renewable generation sources. The compatibility test therefore will select for nations or regions whose sources of renewable energy production are located a significant distance from the largest centers of demand. This is a positive indication of smart grid compatibility because only through smart grid transmission technologies can those renewable energy sources be effectively utilized.
3.1.3 Development cost:
The third aspect of smart grid compatibility is the ability of a nation to afford the initial cost of developing smart grid infrastructure. There is a significant cost associated with
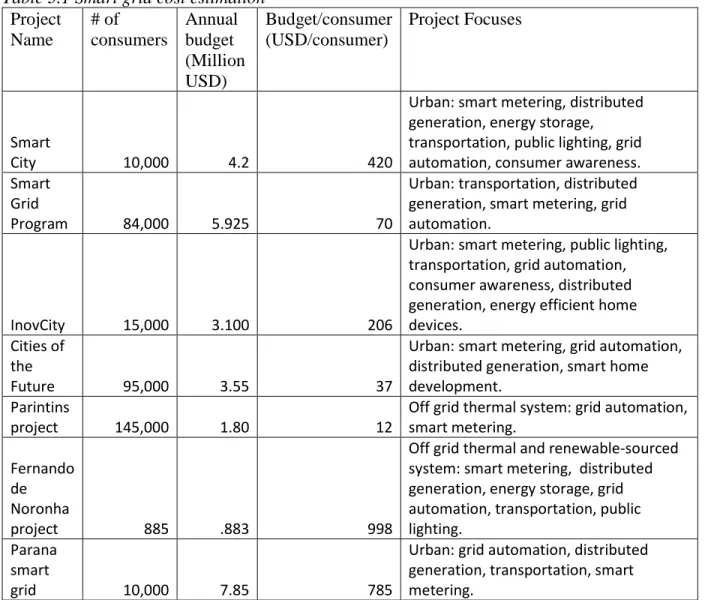
developing new transmission systems, new distributed generation centers, smart meter infrastructure, and other technologies. In order to estimate the cost of developing these infrastructures from little to no starting infrastructure, the previously mentioned smart grid projects in the nation of Brazil will be examined below. The article by Di Santo [2] lists several Brazilian projects and their annual budget, as well as their relative scale based on number of consumers (homes, industries, businesses, and the total power consumption of each project in GWh/year. Those projects and their cost information are summarized in the table below.
The duration of each of these projects ranged from 2 to 7 years; therefore, they offer information about the upfront costs associated with developing smart grid infrastructure in situations that are lacking any substantial or efficient power system currently. Five of the seven projects were performed in urban centers where population density is high, and two were
performed in communities that are not connected to a grid because of their remote location. Both of these projects (Parintins and Fernando de Noronha) previously relied on small thermal
generation plants, and had the beginnings of a microgrid distribution system.
Each of the seven projects had specific focuses, some of which were shared by the majority of the projects. Every project focused on smart metering which is the communication infrastructure for demand side management as well as grid automation which encompasses distribution capacities such as self-healing. Six of the seven projects included distributed generation renewable sources, and five had focuses on public lighting, electric-powered public transportation, or both.
Table 3.1 Smart grid cost estimation Project Name # of consumers Annual budget (Million USD) Budget/consumer (USD/consumer) Project Focuses Smart City 10,000 4.2 420
Urban: smart metering, distributed generation, energy storage, transportation, public lighting, grid automation, consumer awareness. Smart
Grid
Program 84,000 5.925 70
Urban: transportation, distributed generation, smart metering, grid automation.
InovCity 15,000 3.100 206
Urban: smart metering, public lighting, transportation, grid automation, consumer awareness, distributed generation, energy efficient home devices.
Cities of the
Future 95,000 3.55 37
Urban: smart metering, grid automation, distributed generation, smart home development.
Parintins
project 145,000 1.80 12
Off grid thermal system: grid automation, smart metering.
Fernando de Noronha
project 885 .883 998
Off grid thermal and renewable-sourced system: smart metering, distributed generation, energy storage, grid automation, transportation, public lighting.
Parana smart
grid 10,000 7.85 785
Urban: grid automation, distributed generation, transportation, smart metering.
From the information provided by [2] about the budgeting for each of the seven smart grid projects in Brazil, a number of conclusions can be made about the cost of smart grid
development. Firstly it must be noted that from the sample set, no evidence suggests that there is a cost per consumer difference in developing infrastructure in urban centers vs. rural areas. It may be noted that the two off-grid rural projects represented both the least and most expensive projects. This would suggest that it is unlikely that cost per consumer is most related to consumer population density, however a larger data set would be needed to draw conclusions from. Two projects stand out as being significantly cheaper in cost per consumer than the rest, those are the
Cities of the Future and Parintins projects. When examining the different focuses of every project it may be noted that neither of these projects included public lighting or public electric-powered transportation focuses; therefore, these two project focuses may contribute to a high cost per consumer value.
Overall these seven projects represent both urban and off-grid situations and a wide variety of smart grid characteristics in their project focuses. Therefore the calculated average cost per consumer value (in USD) of $361.14 may be used as an approximation for the initial cost of smart grid development.
3.1.4 Political Stability:
The last consideration of this compatibility test is the political climate of the remaining nations. As a means of quantifying the political stability of each nation the 2016 Fragile States Index (FSI) will be utilized. This source is the culmination of research performed and presented by the Fund for Peace in an attempt to quantify the risk that each nation is in due to political instability and poor government structure. The FSI categorizes each nation based on its assessed level of risk into various alert stages, which will correlate to different utility scores assigned to each nation in this compatibility test.
3.1.5 Kepner-Tregoe analysis and test summary:
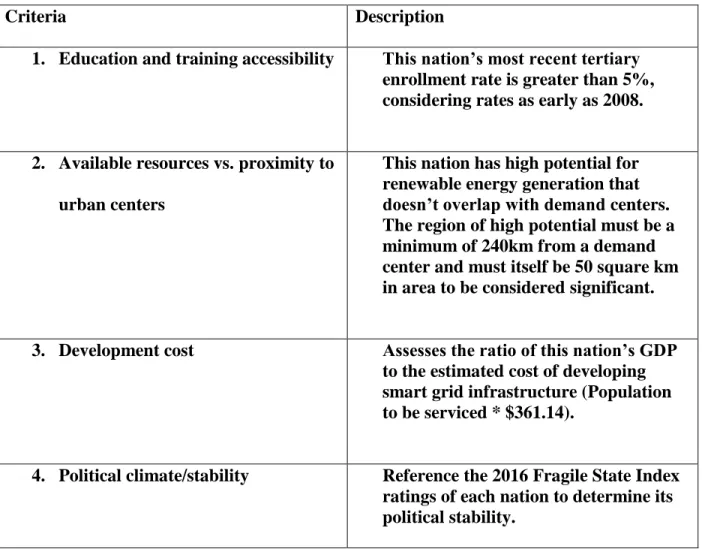
The final stage of the compatibility test will apply Kepner-Tregoe analysis [15] as a means of assessing multi-criteria decision making. This method of analysis will yield the most compatible nations for smart grid development by applying weighting factors to each criteria and assessing the utility score of each nation for each criteria. This analysis will be presented in section 3.2.5. Table 3.2 summarizes the four portions of the compatibility test and the specific means of testing for each criterion, as already discussed in this section.
Table 3.2 Summary of smart grid compatibility test
Criteria Description
1. Education and training accessibility This nation’s most recent tertiary enrollment rate is greater than 5%, considering rates as early as 2008.
2. Available resources vs. proximity to urban centers
This nation has high potential for renewable energy generation that doesn’t overlap with demand centers. The region of high potential must be a minimum of 240km from a demand center and must itself be 50 square km in area to be considered significant.
3. Development cost Assesses the ratio of this nation’s GDP to the estimated cost of developing smart grid infrastructure (Population to be serviced * $361.14).
4. Political climate/stability Reference the 2016 Fragile State Index ratings of each nation to determine its political stability.
3.2 Compatibility test results
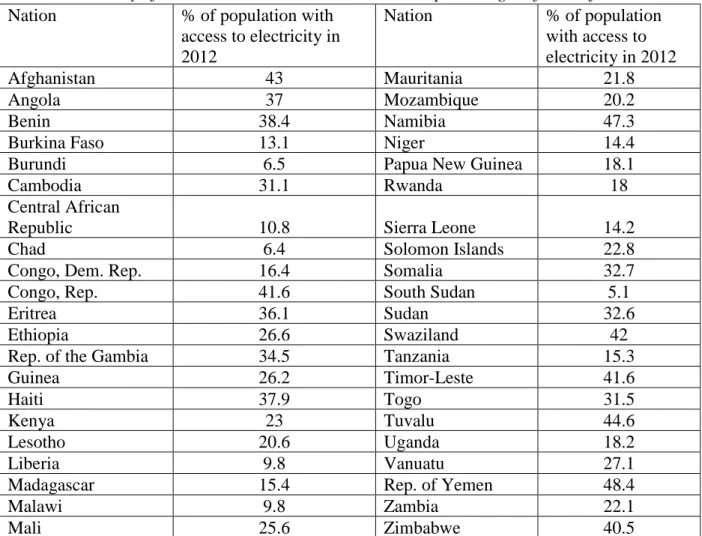
The precondition for this compatibility test is that less than 50% of the population of a nation has reliable access to electricity. The information regarding electrification rates was collected from the World Bank database whose most recent survey dates back to 2012. There are 43 nations who have less than a 50% accessibility to electricity; however, the nation of North Korea will for the purpose of this paper will not be included, due to various impracticalities of development there. The remaining 42 nations and the percent of their populations with access to electricity are summarized in table 3.3 below.
Table 3.3 Summary of 42 nations to be considered and their percentages of electrification
Nation % of population with
access to electricity in 2012 Nation % of population with access to electricity in 2012 Afghanistan 43 Mauritania 21.8 Angola 37 Mozambique 20.2 Benin 38.4 Namibia 47.3
Burkina Faso 13.1 Niger 14.4
Burundi 6.5 Papua New Guinea 18.1
Cambodia 31.1 Rwanda 18
Central African
Republic 10.8 Sierra Leone 14.2
Chad 6.4 Solomon Islands 22.8
Congo, Dem. Rep. 16.4 Somalia 32.7
Congo, Rep. 41.6 South Sudan 5.1
Eritrea 36.1 Sudan 32.6
Ethiopia 26.6 Swaziland 42
Rep. of the Gambia 34.5 Tanzania 15.3
Guinea 26.2 Timor-Leste 41.6
Haiti 37.9 Togo 31.5
Kenya 23 Tuvalu 44.6
Lesotho 20.6 Uganda 18.2
Liberia 9.8 Vanuatu 27.1
Madagascar 15.4 Rep. of Yemen 48.4
Malawi 9.8 Zambia 22.1
Mali 25.6 Zimbabwe 40.5
3.2.1 Education and training accessibility:
This portion of the compatibility test will focus on the ability of each nation to educate its citizens so that they will be capable of operating a complex smart grid system. The parameter that this test utilizes is the tertiary enrollment rate of a sample population of secondary education graduates, using that nation’s most recent annual data since 2008. The results of this portion of the test are summarized in table 3.4.