S
USTAINABILITY
M
ANAGEMENT
IN THE AUTOMOTIVE INDUSTRY
DRAWN FROM THEIR REPORTING
Evaluation of the sustainability performance of companies in the
automotive industry by means of their communication based on
sustainability and CSR reports
© GUT Certifizierungsgesellschaft
für Managementsysteme mbH
Umweltgutachter
Eichenstraße 3b, 12435 Berlin
Tel +49 30 2332021 - 0
E-Mail: [email protected]
-
The rights on this investigation are exclusively owned by GUTcert Berlin. Reprinting, use of the texts and images, duplication and passing on – also in extracts – is permitted only with detailed source ref-erence and after notice to GUTcert. This applies also for any other kind of reproduction including the storage in electronic databases and duplication on data carriers, be it in German or any other lan-guage. We regard violations as an unfriendly act and reserve the right to react to these with legal procecution.
Berlin, August 2013 Part II
As of: 15.08.2013
The studies (Parts I and II) are available on the Internet at:
http://www.gut-cert.de/nachhaltigkeitsstudie.html
Authors:
Prof. Dr.-Ing. Jan Uwe Lieback, Environmental expert and professor at ESCP Europe M.A. Susanne Moosmann
M.A. Yulia Felker Assistance: Flora Sallen
GUT Certifizierungsgesellschaft für Managementsysteme mbH Umweltgutachter Eichenstr. 3b 12435 Berlin E-mail: [email protected]
Further publications of GUTcert on the subject:
- Gehemmte Leselust bei Nachhaltigkeitsberichten. Nachhaltigkeitsmanagement im Spiegel der Berichterstattung; Ökologisches Wirtschaften 1.2013
- Stiefmütterliches Personalmanagement? Wo Unternehmen ihre soziale Nachhaltigkeit zu wenig reflektieren; CSR Magazine online, März 2013
-
Content
Background ... 4
Sustainability or CSR-Report? ... 5
Fundamentals of the Analysis ... 5
Sustainable Development Management - the Deming Circle ... 6
Process of the PDCA Cycle ... 6
The GUTcert-SustainabilityCheck© ... 6
Analysis and Evaluation ... 8
Findings ... 9
Completeness of the Indicators ... 11
Results in Detail ... 11
Evaluation focus: Management and communication ... 13
Indicator Group: Strategy and Management ... 14
Indicator Group: Communication ... 15
Indicator Group: Economic Assurance ... 16
Indicator Group: Strategic Environmental Aspects ... 17
Indicator Group: Social Responsibility ... 17
Evaluation priorities: Product & Production ... 18
Indicator Group: Sustainable Products and Production ... 19
Indicator Group: Environmentally Friendly Production & Products ... 19
Indicator Group: Safe and Healthy Products & Production ... 20
Evaluation priorities: Human Resources Management ... 21
Indicator Group: Efficient Human Resources Management (HRM) ... 21
Indicator Group: Environmental Protection and Personnel Safety Management ... 22
Indicator Group: Social Human Resources Management ... 22
Further information ... 24
-
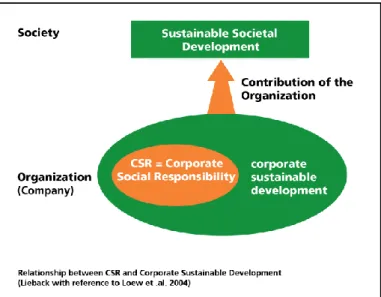
Background
The concept of "Sustainable Development", as part of it also "Corporate Social Responsibility", is gaining attraction for companies: On the one hand, society demands more transparency - also in re-porting, and whoever blocks its mind to this risks image damage and legitimisation loss. On the other hand, this concept also contains the economic survival of companies; hence it does not contradict their economic fundament.
Companies want to and must communicate about their sustainability performance. Current means for this is a ‚Sustainability Report‛. This lives on the compact presentation of the current sustainability performance and the outlook on its improvement. The creation of a sustainability report demands no mandatory requirements up to now. However, stakeholders have certain expectations. The indicators of the Global Reporting Initiative (GRI) are often used as a basis for reporting. Nevertheless, many re-ports appear like advertising brochures for Image nursing: they tell little about the real sustainability performance of the companies. An orientation for the readers and support for the publishers appears to be useful.
Therefore, in a first study in the beginning of 2013, GUTcert evaluated the sustainability performance of companies by means of their communication in sustainability and CSR reports. 27 reports from sev-en industries were analysed.1 The survey attracted high public interest and readers called for a sup-plement, especially for the automotive industry. We are reacting to this demand with this 2nd Study. While the focus of the first investigation was on German companies of different industries, the present one concentrates on the comparison of big international car manufacturers. The sustainability perfor-mance of twelve companies from Germany, France, Italy, the USA, Sweden and Japan were analysed, taking their reporting as an image of their true activities.
Questions of interest were:
What indicators are addressed in the sustainability reports and what activities do companies pre-sent to go along with this?
Are indicators only mentioned, or are objectives named for them as well, and also measures for continuous improvement and programs for monitoring the implementation?
What indicators are treated often and in detail and what are rather neglected? What focus do companies take in their reports?
This study does not evaluate the reports. The GUTcert-SustainabilityCheck© captures the status
of Sustainable Development in the company, as it is published in the report.
The presentation in sustainability reports can deviate from actual practice with respect to the consid-ered indicators and the anchorage of a true sustainability management. Validated statements are pos-sible only with on-site audits.
Experiences from assessments show that the corporate image in reports is presented partly better and partly worse than the reality – behind the appearance another reality is often hidden. Still this theoret-ical analysis reveals the trends of Sustainable Development in the analysed companies.
1
-
Sustainability or CSR-Report?
Both Sustainability and also CSR reports were examined. Ten of the selected automotive companies published sustainability reports that also covered the economic part of Sustainable Development. The reports of Peugeot and Honda are named ‚CSR report‛. The Peugeot report contains comprehensive information about the economic situation and hence is rather an integrated CSR report, annual finan-cial report and management report.
In the form of its use, CSR can today in-clude all the indicators of Sustainable De-velopment – but it does not have to! Who-ever speaks of CSR should explain in detail what he covers by this expression.
The concept of Corporate Social Responsi-bility (CSR) originates from the field of op-erational economics. There, the awareness grew, that without social responsibility of private economies, the business model of free market economy could be questioned2. The classic basic concept of CSR though lacks the principle of sustainable survival from an economic point of view.
"Sustainable Development" is a macroeconomic term for the preservation of the material basis of our civilization. It referred historically always to the preservation of "resources" (water, wood, but also fi-nancial means), on the interests of which society should live. In regard to a company, it refers to an economically stabilizing development that promotes the common good, while involving the environ-ment and the employees.
Fundamentals of the Analysis
For Sustainable Development different indicators are considered essential. They reflect the expecta-tions of stakeholders. Many indicators are compiled since 2010 in the ISO 26000.They relate amongst others to the requirements of international standards, such as those of theUN Global Compact, the Standards of the WBCSD, of organisations like AccountAbility (AA 1000), Social AccountAbility Inter-national (SAI with SA 8800), of the GRI Guidelines or the OECD Guidelines.
Each of the approaches mentioned above pursues its own key aspects according to its origin and does not claim completeness. ISO 26000 includes, for example, only one part of the indicators for the busi-ness development of an organisation, for environmentally friendly behaviour of the employees and their social security, or the production environment 3.
Summarizing ALL demands of these standards, a comprehensive catalogue of the "indicators" of Sus-tainable Development can be constituted. Thus, in several years of research the
GUTcert-SustainabilityCheck© was developed. A special feature is its two-dimensional consideration of
per-formance. First, it explores whether an indicator is reported at all. Second, it determines to what
2
Howard R. Bowen: Social Responsibilities of the Business man. Harper & Brothers, New York 1953.
3
Gehemmte Leselust bei Nachhaltigkeitsberichten. Nachhaltigkeitsmanagement im Spiegel der Berichterstattung; ÖkologischesWirtschaften 1.2013.
-
tent the activities for the continuous improvement of this aspect have already prospered. For whoever takes the sustainable path is willing to and must improve continuously.
Sustainable Development Management - the Deming Circle
For the systematic development of non-financial tasks in organizations, such as ‚Quality‛, ‚Environ-mental Protection‛ or ‚Health & Safety‛, there are concepts with the corresponding management sys-tems (i.a. ISO 9001, 14001, OHSAS 18001). They assist the continuous improvement of business per-formance and develop it from an ‚ACTUAL‛ state into a (partly legally required) ‚TARGET‛ state. It makes sense to use this control unit concept also for the monitoring of Sustainable Development of other non-financial performance areas and to improve these continuously with the help of a manage-ment system. The application of this control concept demonstrates the seriousness with which Sus-tainable Development is operated within the reporting organisation.
The control concept is based upon the ‚Deming circle‛ or ‚PDCA cycle‛4. It is the fundament of all management systems and describes how organisations learn and/or could learn efficiently. According to this concept, capture, afterwards description and evaluation a given "actual situation" is the begin-ning of a self-contaibegin-ning and a self-controlling process that leads to a continuous improvement of per-formance - here of Sustainable Development. For the pursuit of the continuous improvement of the varied components of Sustainable Development, the PDCA cycle therefore makes sense. All aspects to be treated can be integrated into this cycle of continual improvement.
Process of the PDCA Cycle
An ACTUAL status is recorded in detail. This opens the opportunity to compare it with others or an own scale, to rate it and derive objectives and measures for improvement. (Plan)
The implementation of the objectives for the achievement of a desired TARGET state and the meas-urement of these require an organisational frame in which they unfold in a planned and controlled manner. (Do)
It is audited regularly if processes need to be improved and whether the goals are achieved with the planned measures and/or may need to be supplemented or replaced. (Check)
The audit results show the current status in relation to the planned improvements and allow an evalu-ation of the progress. The results are the basis for the revision of the strategy, the planning of new or changed goals and necessary measures. (Act Plan)
The GUTcert-SustainabilityCheck
©The check is based on 81 indicators for Sustainable Development. They are classified into 11 indicator groups, which focus on three assessment areas:
Management and Communication
covers five sets of indicators on sustainability strategy and management, sustainability communication, sustainable economic development, environmental protection and social
responsibility strategy. These include 39 indicators in total, partly with different weightings, up to 500 points are awarded, half of the Overall rating.
Product and Production
focuses on the product and the production conditions. The 25 indicators of this core area form 3 indicator groups: economically efficient, environmentally friendly, safe and healthy products and production conditions. A company can attain here a maximum of 300 points.
4
Out of the Crisis. Deming, W.E. Massachusetts Institute of Technology, 1982. Statistical Method from the Viewpoint of Quality Control, Shewhart, W.A.. Dover Publication, 1986.
-
Human ResourcesManagement
evaluates with 17 indicators the efficiency, the environment protection, the safety and social aspects of Human Resource Management, with a total of 200 points that can be achieved.
The entire set of 81 indicators, with which a maximum of 1000 points can be attained, serves compa-nies to determine in Assessments their ‚Position in the terrain of Sustainable Development‛. Examin-ing with these indicators the completeness of the treatment of important issues while verifyExamin-ing accord-ing to the PDCA cycle, how intensively these are beaccord-ing dealt with, the own position can be deter-mined (or updated).
The results can be presented graphically. Visual aggregation facilitates benchmarking over time and with the sector. From this, a comprehensive perspective for future Sustainable Development can be derived if the result is evaluated with respect to the corporate strategy.
Certification of Sustainable Development?
With a ‚Sustainable Company‛ certificate, commitment would be easy to prove to the public. But since the sustainable path is a development concept5, there does not exist a static feature "Sustainabil-ity". Therefore, we always define "Sustainable Development‛. Could then "Sustainable Development" be certifiable? This would require that the development is measurable as an "ACTUAL‛ status of an organisation in order to allow a comparison with a defined "TARGET" state.
Such a "TARGET" of Sustainable Development would be a confirmed standard of assessment at least for a row of essential indicators. Only an international consensus, which measurable minimum behav-iour is to be required for Sustainable Development could be a basis of a certification. But the interna-tional community is still far from this, shown by the discussion on the contents of ISO 26000 (cf. also the comments by, among others, DIHK, BDI, ZDH et al.6 ), the protracted agreement attempts on cli-mate change, the ideas for a fair global economy and other internationally negotiated issues. Current-ly, there is no internationally binding standard for the ‚TARGET‛ of Sustainable Development.
5
Nachhaltigkeitsleistungen bewerten, UmweltMagazin Juni 2012: http://www.gut-cert.de/dl-veroeffentlichung.html
6
-
Analysis and Evaluation
Following corporate reports were examined. In the study, the companies are referred to by their ab-breviations (if existing):
Reporting year Company (and/or abbreviation)
2010/11 2011 2011/2012 2012
BMW
Daimler, Peugeot (Peugeot/Citroën), Renault, VW Ford
Fiat (Fiat/Chrysler), GM, Honda, Nissan, Toyota, Volvo
The central question also of the second part of the study was: How far has Sustainable Development progressed in the company today and is it traceable?
For 12 candidates the status of their development was determined for every indicator of the GUTcert-SustainabilityChecks© on the basis of their communication in sustainability or CSR reports (and/or doc-uments referenced there). With this information, the activities for continuous improvement were ex-amined and evaluated for every indicator. The following evaluation pattern resulted:
No Info: no information on activities is reported for these indicators (0% of the points to be allo-cated).
Plan: The indicator (or accompanying aspects) is included at least in the strategy for Sustainable Development (up to 25% of the possible score).
Plan & Do: There are objectives on the subject that are being worked on or that are backed with practical measures (up to 50%).
Plan-Do-Check: The achievement of objectives and implementation of measures are audited in-ternally and a report on the results is submitted to the top management (up to 75%).
Plan-Do-Check-Act: The top management deals regularly with the results of this indicator for Sus-tainable Development, takes action if necessary and/or sets new goals (up to 100% for this indica-tor).
As explained, the three evaluation foci encompass eleven indicator groups. With respect to the com-pany, the average score for each of them is recorded and compared to the maximum achievable score. Besides the numerical determination, the results are presented as sustainability radar (Appendix). With this, the strengths and potential of every company are revealed at a glance. Differences become visible immediately:
Are there any peculiarities in treating certain indicators?
How intensive is dealing with the indicator groups in general, are there any with particularly strong and/or minor activity?
Can any sector-specific differences be identified in treating of the topics?
To what extent do the companies consider the management approach of continuous improvement for their Sustainable Development?
Who leaves aside certain indicators or discusses them only marginally (Non-Reporter)?
On the other hand, who delivers exemplary and transparent descriptions of continuous efforts for an indicator (Best Practice)?
-
Findings
Strength of the 12 car manufacturers is the strategic sphere of management & communication. In this, on average 77% of all possible check points are achieved. Only Honda shows big gaps. In the field of Human Resources Management, the performance is clearly lower with on average 64% of the points. The front runner, Fiat, receives 81% of the points for its reported sustainability performance, taking the average of the three evaluation areas.
After detailed investigation of the12 car manufacturers, we drew a comparison with the 27 companies of the preceding study in an n-39 Ranking. In the section ‚Results in detail‛, the mean values of the first study part - with the "winner" there Telekom (see Fig.6) - are by example compared to those of the second ranking. In the Appendix, graphic short evaluations with n-12 mean values of the reports of the car manufacturers are listed.
Most important finding from the comparison of the study partsI and II: the n-39 Ranking continues to be headed by the reported sustainability performance of Deutsche Telekom (872 points). Places two and three are taken byFiat (868 points) and Peugeot (834 points).
The completeness of the aspects taken up in the reports is often ‘purchased’ with great effort: Alt-hough internet-based, at Ford for instance, one has to ‘fight’ through 540 pages, at Fiat through al-most 300 pages. BMW achieves the same score in the ranking as Ford with a report of 149 pages. VW and Daimler achieve similar good results with reports of 91 and/or 124 pages. So sustainability report does not need to be long to be convincing. Fig. 3 shows the n-39 Ranking of the findings, indicating the page number of the reports (in brackets).
-
Compared to the total field, the reported sustainability performance of the automobile manufacturers is very comprehensive: Eight of the twelve brands placed in the first third of the n-27 Ranking created in January 2013 (orange bar). Only Volvo und Honda are among the last.
The sustainability reports of the car manufacturers show that in spite of different product ranges, business models and national specific features, they are confronted with similar challenges. Among the reported activities, the following fields of activity are found regularly:
Innovation as a driver of sustainable success in all business segments More efficient design of conventional drive systems
Contribution of new products and technologies to Sustainable Development of society: sustainable mobility, safety while driving, optimisation of the entire individual transport area (software, new concepts for urban development)
Resource efficiency in the production
Adapting business models to meet the needs of national markets
‚Safety‛ as a topic, both in terms of products as well as of employees and production
According to tradition and national legislation, further activity priorities are set. Where the countries of origin of the corporate groups have introduced special reporting obligations, respective key figures ex-ist. This facilitates the analysis of their sustainability performance. If there is little pressure from the outside, the description of the performances often lacks transparency and completeness. In spite of common characteristics, the sustainability performances of the companies under review therefore clearly differ. Our evaluating system makes visible priorities of the companies, of which they are maybe not even aware:
Peugeot reports, for example, extensively with indicators on human resources management and looks to new markets in emerging countries and the associated change in the product portfolio. New products and drive systems are the focus of Renault: Electrical mobility and the use of biofu-els are prominently addressed.
Fiat highlights the efficiency optimisation of the products in a more than 30-page sustainability program. A strong management approach is another focus of the corporate culture.
Ford, Daimler, VW, GM und BMW see the driver for success in all business segments to be in Inno-vations.
Volvos activities emphasize the reliability of its proven products and development of new drive sys-tems.
Toyota takes up social mobility and cooperation with municipalities and cities and expands the au-tomotive horizon to include the perspective of traffic control.
-
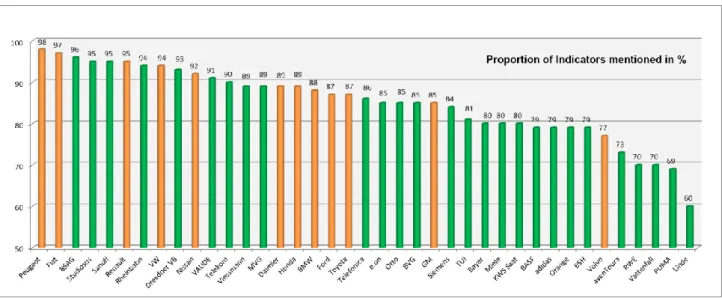
Completeness of the Indicators – catchwords or substantial activities?
Sustainability reports serve to communicate the activities to Stakeholders. Communication strategists know what these want to read and they provide their readers with respective catchwords. These catchwords though are often used without reporting any detailed activities.
If the evaluation concentrates upon the percentage of considered indicators with no respect to the ef-forts for their development, the order in the ranking listed above changes. In this case Peugeot leads the field of participants with 98% of all possible indicators (mentioned place 3). Summarising both surveys, a comprehensive understanding of Sustainable Development as completeness of the indica-tors and substantial activities demonstrates how serious Sustainable Development within the reporting organisation operated. Peugeot addresses practically all issues demanded nowadays by Stakeholders but does not report always systematic activities.
The difference between the percentage in considered indicators and the efforts to develop them by means of a management approach is greatest by Honda. Subjects are often mentioned only rudimen-tarily or part objectives are reported: Catchwords without substance predominate.
Results in Detail
The most important indicator group for Sustainable Development is ‚Strategy and Management‛, with an average of 85% of the points being achieved by the car manufacturers. Many companies, but not all, have realized that this is the basis for a systematic approach.
Also in the indicator group ‚Strategic Environmental Aspects‛, an average of 85% is achieved in the present investigation. This second area forms the focus in all reports due to the specific feature of the products and the strategic orientation of the industry.
If we compare the results of 27 participants of the first study part with the 12 car manufacturers in this second study part, it is noticeable that, for the car manufacturers, the same number of, but usual-ly even more points, were scored in all areas - although Human Resources Management is once again the area with the lowest coverage. In this evaluation focus, an average of only 62% of the points could be assigned.
-
Although on average 73% of the points are achieved by the car manufacturers in the evaluation focus Products and Production two weak indicator groups are found here. These do not differ in both study parts: Environmentally friendly products / production as well as Safe and Healthy products / produc-tion.
The comprehensive reports of the car manufacturers lead to the fact that the benchmark of the Study Part II is clearly higher (see Fig.6). Front runner of all candidates is still Deutsch Telekom - but closely followed by Fiat.
Fig. 5 Telekom (green area) with aver-age line n-27 (red line) and compared to the automobile manufacturers n-12 (orange line)
Fig. 6 FIAT´s result, 869 out of 1000 points (green area), with benchmark (n-12) Automobile Manufacturers (or-ange line)
-
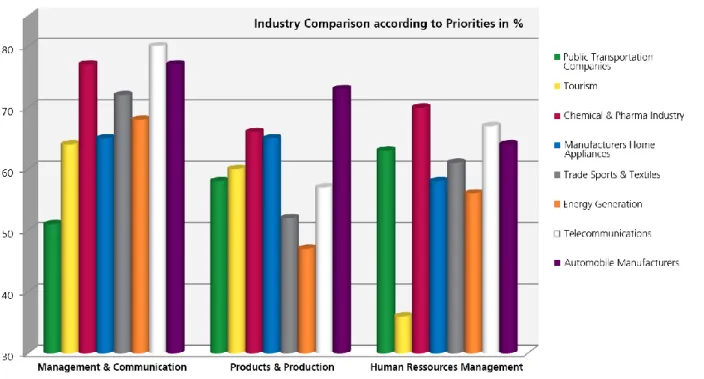
The seven analysed industries from the first study were supplemented by the summary of the currently examined car manufacturers. In the General industry comparison (Fig. 7), their strength shows up par-ticularly in the areas Product & Production. The two other areas are also exceptionally well developed, but do not show top performance.
Evaluation focus: Management and communication
With 500 points, the evaluation focus: ‚Management and communication‛, which includes the first 5 indicator groups, is the core area of the GUTcert-SustainabilityCheck©. The 39 indicators of the 5 groups illustrate the strategic basis of all sustainability efforts. On average, up to 93% of these indica-tors are reported. If the circumference (completeness) of the management processes is involved in the assessment, the company reaches an average of 75% of all points.
The inclusion of the shareholders, municipal involvement, the neighbourly dialogue (essential CR- is-sue!) as well as the expansion of a sustainable delivery chain play obviously a rather low role for the companies.
All examined companies report comprehensively on their sustainability programs (and re-ceive maximum scores) for Customer relationships and Reduction of energy consumption (CO2 emissions).
-
IndicatorGroup: StrategyandManagement
This indicator group includes all single indicators accompanying a sustainability strategy and its practi-cal implementation in the everyday life of the company, in particular also the methods for their con-tinuous improvement.
In 98%, there is reporting on all indica-tors. Exceptions are Toyota with missing references to Risk management and Vol-vo, which obviously operates its Sustaina-ble Development without a comprehen-sive management program.
On average, the companies achieved a good 85% of the evaluation points, the highest value in comparison to all other indicator groups. Honda, Volvo and Toyo-ta remain below average in their descrip-tions. The full score was achieved by BMW, Daimler and Fiat.
A management approach in this area
means to define strategic and operational objectives and to back these up with measures and control mechanisms. 90% of the reports follow this approach.
All participants report in this area on extensive activities and on comprehensive management activities concerning their vision and strategy and their efforts towards compliance and thereby achieve 95% of the points. Considerable differences in the participant field arise for:
Risk Management
Renault, BMW and Nissan report very much in detail. They describe subject fields, accompanying crite-ria and methods. Renault explains its risks with key figures on 13 pages. The reporting of Honda, Ford and Volvo, on the other hand, strive this indicator only marginally. Risks are mentioned, however, without description of the consequences.
Management Program
Fiat and Daimler report in detail and Peugeot names measurable objectives for every area of the man-agement program. Ford reports about the status of its objectives, but without naming new ones. VW presents measures in the management program, but these are not very meaningful without a status survey. GM, Toyota and Honda limit themselves to measurable environmental objectives.
Key Figures
Diverse KPI substantiate the activities of BMW, Fiat, Peugeot and Renault. GM, Volvo and Toyota communicate few KPI.
KPI for the areas Environment and Economy are frequent. On the other hand, apart from Peugeot, the companies report few KPI for Human Resources Management. GM and Honda hardly offer any de-tailed information via KPI.
-
Indicator Group: Communication
The central task of Sustainable Development is the identification of and the communication with rele-vant Stakeholders and gathering their interests. These must be included in the sustainability strategy and the determination of the essential indicators. The entrepreneurial balancing act of Sustainable De-velopment is to take internal and external interests into consideration equally.
All companies report on their activities to inform the public and on their stakeholder dialogue. Thereby, 81% of the indicators are mentioned. Short descriptions are pro-vided by Honda, Renault and Toyota.
Rarely is there reporting about an inclusion of shareholders in Sustainable Develop-ment. Exceptions: BMW, GM, Nissan and Renault, they receive for this indicator a score of 100%.
Only 66% of all possible points are achieved in the field of communication.
A management approach in this area is to register all stakeholders, to show the
com-munication channels with the foci on discussions and to evaluate the significance of the results of dialogues. Half of the reports display a PDCA approach for this.
Employee Communication
Employees are important stakeholders for all participants. Therefore, employee communication is pre-sented in detail. It is amazing that Toyota has nothing to report on this issue and VW and Renault only marginally.
Municipal Commitment
Within international comparison, cultural differences became clear. The US companies involved report in detail on their municipal commitment. In the report 2012, Toyota describes extensive personal con-cern, crisis management and practical assistance provided with regard to the disaster in Fukushima in March, 2011.
Without a complete management approach and without monetary KPI, list Volvo, Honda and Nissan initiatives (Plan, Do). Daimler mentions its intentions in Strategy and occasionally provides explanations (only Plan). Renault tells nothing about Municipal commitment.
-
IndicatorGroup: EconomicAssurance
The existence of the company and its economic stability form the basis of every Sustainable Develop-ment. In detail, the activities for that are described by the French study participants. They are legally obliged to communicate their non-financial performances extensively in the management report (Gre-nelle 2)7. CSR and/or sustainability reports are hence written by French groups as integrated reports. All remaining study participants communicate the strategic development of the company with the rel-evant core indicators, partially under reference to, or with linking to the annual financial reports.
The focus in this topic is on customer satisfac-tion. It is reported that the customer require-ments differ strongly in the automotive sector, according to market and geographical loca-tion: the tendency is towards large and luxuri-ous cars in emerging countries and in the Unit-ed States, and rather small and efficient ones in Europe. All models and markets are high-lighted in great detail in the process, as are strategy and efforts in R & D.
No report in this indicator group reached 100%. The benchmark is at 80%. BMW, Peugeot and Renault supply the best results with 92%. Honda achieves 38% of the points with its economic strategy, only half of the next highest placed company.
The management approach in this area means setting an economic strategy substantiated with key figures and their control mechanisms. Foci are: Financial planning / Control, Liquidity protec-tion and Profit use, supported by sustainable Human Resources planning, as well as Innovaprotec-tion policy supplemented with Customer and Supplier Management. Nearly 80% of the car manufac-turers examined treat the indicators with a visible management approach.
Supplier Management
Sustainable supplier management or the management of sustainable suppliers is obviously a chal-lenge. All participants announce their commitment to build long-term and fair relationships with sup-pliers. This is confirmed by the commitment to the UN Global Compact and internal guidelines. Peugeot and Nissan deal with sub-suppliers of the supply chain (Tier 2, 3). A third limits itself to direct suppliers and 58% of the participants do not report on their suppliers at all.
Sustainable supplier management is barely represented with specific objectives in the management programs. The exception is Renault, which indicates the number of annually planned and conducted supplier audits in the management program. The prevailing part of the companies lay down require-ments for suppliers, but verifies these almost exclusively by self-reports and trainings within the com-pany and within suppliers.
Environmentally relevant requirements are well covered as a rule by the demand to the supplier for ISO 14001 certificates. However, the social dimension, working conditions, building safety and fire protec-tion are not registered. Self-informaprotec-tion or small number of quality audits on site cannot verify con-formity in this respect. A larger number of on-site inspections is reported only by Renault.
7
Guide Méthodologique, Reporting RSE Les nouvelles dispositions légales et réglementaires, Comprendre et ap-pliquer les obligations Mouvement des Entreprises de France, www.medef.com.
-
Indicator Group: Strategic Environmental Aspects
Strategic Environmental protection is a priority in all reports. Environmental issues, such as energy con-sumption, CO2-emissions, water concon-sumption, sewage water and waste, are treated.
95% of the indicators are ad-dressed. Exceptions are the activi-ties on biodiversity: no data on this from BMW, Volvo and Renault. Other participants limit themselves to KPI on land use or mean individ-ual projects.
On average almost 85% of the points are achieved in this (second strongest) indicator group. Fiat, GM and Toyota report on activities in all areas of the environment and re-ceive 100% of the points in Strate-gic Environmental protection.
Nis-san and Honda are at the bottom in Strategic Environmental protection with 67% and/or 61%.
Since the production locations of all study participants are certified according to ISO 14001, which requires an application of the PDCA cycle, the management circle is well illustrated in this area. 90% of the companies describe activities on Strategic Environmental Protection, illustrating this.
All companies emphasize their climate ambitions in the form of a climate policy, with which they want to reduce energy consumption and CO2 emissions of the products and of production. In all reports a complete PDCA cycle is described for this.
Indicator Group: Social Responsibility
The indicator group on Social responsibility completes the focus area of Management and Communi-cation. As in Environmental protection, the indicators of this group deal with the strategic dimension of Social responsibility, CSR. Internal SR and above all product-related and employee-related aspects of the CSR, are dealt with in the next focus areas, especially in the third one of Human Resources Man-agement.
92% of all indicators in this area are ad-dressed in total by all participants.
On average, however, the companies only achieve 67% of all possible points.
To pursue a management approach in this field means to develop strategic objectives, to adopt internal policies and a transparent control of the status. The focus, i. a. is on fighting against corruption, respecting human rights, volunteering and sponsor-ship. These stakeholder demands are mapped by 59% of the companies in their reports.
-
Some differences in the reported activities are of interest: Support of External Volunteering by Employees
Ford, GM, Fiat, Daimler, VW and all Japanese companies report in great detail on the support of the private commitment of its employees. BMW states to be in the development stages for this topic. Sur-prisingly: the French companies, otherwise a pioneer in social issues, barely have any activities to offer on this topic, and Volvo nothing at all.
Disadvantaged Groups, Disabled
Two-thirds of companies report on their disabled employees rate. Daimler, Ford, Nissan and Volvo do not to mention the subject at all.
In terms of product designs adapted for the disabled, only VW and Daimler describe activities. Corruption
Fighting corruption is usually implemented with compliance management and communication of all participants. The German and French car manufacturers report on this in particular detail. Honda men-tions the subject without details. Toyota keeps silent on this.
Human Rights
All participants commit themselves to the observance of human rights in the company and in the sup-ply chain, implemented by Internal Directives and Guidelines (cf. Supplier management 3.3.3). The control tool for suppliers is usually self-reporting. On-site audits (as opposed to quality inspections) are however rare. Neither the objectives about this nor reaching an objective are clearly communicated. For all participants except Ford (here 100%), it remains extremely non-transparent whether the measures are adequate and effective.
Evaluation priorities: Product & Production
The indicators of this focus that are important to the stakeholders are the environmentally friendly and safe design of the products and production, customer friendliness and sustainable marketing strate-gies.
All 12 vehicle manufacturers see future opportunities in an increase of their resource efficiency, in production as well as with the (conventional) drive systems of their products. At the same time they emphasize the development of their products in the direction of sustainable mobility (E-Mobility, Hy-brid). This field has for all manufacturers an outstanding significance. All therefore report about their concepts in detail.
In production - besides energy conservation - it is all about the reduction of operation-related emis-sions. Many companies report medium-term and long-term objectives for this. Toyota and Nissan only present short-term goals. Volvo mentions exclusively CO2 reduction objectives in its management pro-gram.
More than 84% of all indicators focus these areas, efforts are reported, which, which regarding to the management cycle, achieve on average 70% of the points.
No company reports fully on all indicators. Fiat and Peugeot respectively leave out only one of the total of 25 in this field, while Volvo specifies no activities in 30% of them.
-
Indicator Group: Sustainable Products and Production
This group comprises indicators for Sustainability and Economic efficiency of the products offered in the market. A company can only develop sustainably and hence be fit for the future, if its products are sustainable and also its production is efficient. This starts off with the development and goes on to re-cycling after use.
With their efforts, the companies achieve 73% of the total points of this indicator group. A PDCA cycle is described in 64% of the reports.
For R & D, compliance of products, compliance with customer requirements and efficiency and safety using the cars, more than 90% of the participants respectively report.
Only three companies mention the pricing, and only Renault incorporates sustainability criteria and receives full points.
Supplementary service offers are also dealt with below average, at 42%. Mainly the Euro-peans offer an extension of services, such as Car Sharing (Daimler, BMW and Peugeot).
According to the product, the car manufacturers report intensively about the efficiency and safety of their products in the use phase. Detailed manuals for fuel-efficient driving techniques and product declarations on safety features, as well as on the driving-related CO2 emissions, are part of marketing. Many details are due to national or EU legislation: end consumers have to obtain in-formation on the efficiency of the vehicles, their CO2 emissions and the safety behaviour in ac-companying information.
Indicator Group: Environmentally Friendly Production & Products
For Sustainable Development, products not only have to be successful financially and production must be assured permanently, but above all they must also be environmentally friendly during production and handling. This begins with the selection of raw materials and the supply chain and continues through production and transporting, up to use and disposal.
Participants report in detail about their ef-forts in this regard because the branch is re-peatedly under criticism due to the environ-mental effects of their products. The com-prehensively implemented Environmental Protection Management provides detailed figures for the communication. Information is provided on 98% of all indicators and thus on average 80% of the possible points are achieved. Exceptions again are Volvo and es-pecially Honda, which address fewer indica-tors and communicate a smaller number of KPI.
Nissan, Toyota and Ford are ‚Best in Class‛ in this indicator group and receive over 94% of the points for their reported activities.
The largest differences are for the indicator Packaging and Transport. A large part of the partici-pants uses service providers for logistics and does not look at this aspect as a component of their own responsibility. Requirements for route optimisation and shifting of transport from road to rail or waterways are perceived as a part of the supplier obligations. For VW, Daimler, BMW and Vol-vo, "Green Logistic" is indeed part of their sustainability strategy, but only provides some
-
and Renault report in detail and management-oriented (objectives, measures, KPI, results). Fiat, Ford, Toyota and Nissan comment on optimising the packaging; GM reports nothing on this as-pect.
Indicator Group: Safe and Healthy Products & Production
Economically successful, environmentally friendly and environmentally sound production and products must also be socially responsible. For the purposes of Sustainable Development, the safety concept goes beyond what one associates with it at first sight. For Sustainable Development, products not only have to be safe in the handling, but also the social aspects of the application of the products as well as the production are a component of this.
No report receives the full score on this indi-cator group. On average, 66% of all points are achieved for the management cycle.
Only Fiat and Peugeot report on all indicators of this group and achieve the best results with 88% and 83%. In last place is BMW with 45%, which obviously does neither think about customer data protection nor the effects of setting up production sites. And it cares little about the social impact of their products and the social conditions in the supply chain. The same applies to Honda with 49%.
A demonstrable management approach is
documented in 63% of the reports. The other reports mainly lack the representation of control mechanisms (only Plan, Do).
Production Safety is reported completely everywhere (97%), which is not surprising, since all par-ticipants operate formal occupational health and safety management systems.
A similar result is reached by Product Safety (98%), which from the customer's perspective and from a legal standpoint is a top priority for all car manufacturers. In all reports, there are com-ments on new safety techniques. The use of anti-allergenic substances in the car interior is ad-dressed by Renault, Nissan and Volvo.
The impacts of the product use on society are addressed by a large part of the car manufacturers. Concepts on the more efficient design of road traffic are reported among other issues out of cur-rent research projects.
Data safety plays apparently only a low role in some companies. Reporting in detail and manage-ment-oriented on this are Fiat, GM, Nissan, Renault and Daimler (D. only for Germany). No infor-mation on this is provided by BMW, Volvo and Toyota. The remaining participants cover the sub-ject with internal directives, but offer no further information about it.
Only in one quarter of the reports are found statements about societal impacts of site choice. On-ly VW receives full points here. Social effects in the suppOn-ly chain are treated in every report, but mostly in a rudimentary way.
-
Evaluation priorities: Human Resources Management
An efficient, forward-looking Human Resources Management with offers on staff development, con-tinuing education and preventive health, is today a must and therefore an integral part of the eco-nomically Sustainable Development of a company. The combination of work and family, the Work-Life Balance and a safe and healthy work environment are vital prerequisites for the development of the currently most important "production factor‚, people.
Reporting activities on this Evaluation priority, the companies are achieved on average only 62% of the points. Thus, it takes the back seat in the comparison. Differences between European and non-European manufacturers are remarkable. The legal situation in Germany, France, Sweden and Italy strongly differs from the requirements in the USA and in the Asian region. Strict controlling of the job market in Europe (employee representatives, collective bargaining agreements) and especially the obli-gation for enlarged reporting with regard to staff interests in France, lead to the formation of a lot of KPI and the collecting of extensive data (exception Volvo). On average 79% of the points are achieved among them. However, the US-American and Japanese report few activities in their reports and hence achieved only 46% of the points on average.
Indicator Group: Efficient Human Resources Management (HRM)
The group of indicators on efficient human resources management considers the economic aspects within sustainable Human Resources Management. For indicators for remuneration and pensions, among others, employee satisfaction and human resources planning are taken into account.
The activities in the companies differ consid-erably and only 78% of the indicators are addressed in the reports.
With only 59% of the possible points, this result is the weakest of all indicator groups.
5 manufacturers address all indicators with their activities. Volvo, Ford and GM report only half.
Daimler gets 100%, GM, Ford and Honda, with only 23% to 34% of points are the laggards.
With Honda and Toyota there is no infor-mation on the subject of compensation. Transparent information on the number of
employees, who work with a collective bargaining agreement, is in the reports of the German and French manufacturers and that of Nissan.
Details on company pension schemes are sparse. As a rule, no targets are defined for this and there are no group-wide solutions. There is little information on nation-wide activities, but usually without figures (e.g. coverage degree). An exception is Daimler with its group-wide ‚General Pension Policy‛, for which requirements are formulated and are backed with figures. Peugeot publishes a list of countries where supplementary pensions are offered.
Most companies report about recording employee satisfaction. As a rule, survey cycle, return rate and results are briefly introduced. Partially a "staff satisfaction index" is formed. Only GM gives no information on this subject.
Big differences are found with the reporting about a suggestion scheme. Ford and Volvo deliver no information on this and GM omits key figures. Detailed information about the method, the number of submitted proposals and savings is found in the reports of Daimler, Fiat, Honda, Re-nault and VW and, with deduction, BMW.
-
Indicator Group: Environmental Protection and Personnel Safety Management
Safe and healthy workplaces are a cornerstone of the social responsibility of each company. A compo-nent of it is continuous sensitivity for the subject. Training as well as advanced training and continuing education of the employees for a safe, healthy and environmentally friendly behaviour in their working surroundings and with regard to their company are the keys to this.
On average 70% of the points are achieved, indicating a mean relevance of this indicator group. The manufacturers show a similar level in this; only Fiat achieves 100%.
A comprehensible PDCA cycle is noted in 56% of cases investigated.
Subjects and fields of activity for industrial safety and training of the employees are covered almost automatically by the estab-lished management systems like Environ-mental Management System (EMS) and Health and Safety Management System (HSMS).
There is seldom reporting (<40 %) about broad sensitisation of employees for safety
compatible and environmentally friendly behaviour.
Indicator Group: Social Human Resources Management
The indicators of the last group concern the social responsibility of a company referring to its employ-ees. Here in the foreground is the social behaviour of the companies towards their employees and the support of their social behaviour. An equal treatment, protection of the rights of the employees, com-patibility of a career (with a responsible position, i. a. as a manager) and family, the HR strategy and the training of the employees for healthy and social behaviour are the indicators of this group.
5 Companies report on all indicators, no company achieved 100% in this group. The average is 61% of the points.
By way of example, Peugeot reports on its performance and was clear ahead with 97%. This is followed by BMW (86%) and Renault (79%). Volvo, Ford, Honda, Nissan, and VW present themselves with 40 to 50% and are below average. In last place is GM with 28%.
Reporting on their employee representation in the full management cycle are BMW, Daimler, Peugeot and Renault. GM, Toyota and VW do not get past the announcement of objectives and for Nissan any comments whatsoever are missing.
Programs for career development and professional development are part of everyday life. Howev-er, the reports of Toyota and Ford include only declarations of intent without any additional in-formation.
Health support is usually an integral part of work safety. Therefore, the majority reported in detail on this. Only Volvo provides no information and Toyota only marginally.
In half of the reports, localization policy is discussed with local association. In this, Fiat, Peugeot Toyota and VW describe in detail the local distribution of their employees.
-
It is a challenge for employers to organize the work in a way that work and family are consistent for all employees, and so that a work-life balance is kept. BMW, Daimler, Peugeot and Toyota re-port extensively about respective programs and name KPI for this. GM rere-ports at least targets for this indicator, Volvo nothing.
What strikes positively is that great attention is paid to the subject of Diversity. As a component of strategy, diversity is anchored in the principles of all participants. Training is carried out, complaint mechanisms are established and awards granted for this. But the communication on the subject also often limits itself to this, and concrete figures on this subject lack in the reports of GM, Toyo-ta, Honda, VW.
-
Further information
That is the extent of the results of our investigation. On the following pages graphic summaries of the company-related results are found in detail. It becomes clear how different the strategies and efforts of the companies are even if their results are similar summarizing figures.
This clearly shows the strength of the GUTcert-SustainabilityCheck©
. It gives companies an overview on the strengths and potential of their Sustainable Development concerning the essential sustainability indicators used today. On this result a promising strategy for Sustainable Development can be built in balance with the overall strategic orientation of the company.
GUTcert will be glad to send companies detailed results of the investigation on request, or present them during a meeting on site with detailed explanations.
Company-related "profiles" are available for anyone interested. Also companies not included in the investigation can request these.
On request GUTcert can produce detailed, individual studies of any sustainability or CSR reports - as a single investigation or in industry comparison.
Presentation of Results
In case of interest the authors will present the results of the present investigation to the affected com-panies included on site. The focus here is mainly on peculiarities of individual indicators and evaluation priorities, apart from the general study design. The strengths and the potential are assessed according to company and industries. If requested Best Practice examples are introduced and a strategy is com-piled for further steps on the path to Sustainable Development.
Assessment on Site
Companies get more and better information from Assessment on site. Here, not only the corporate communication, e.g. of the existing reporting, is examined: In intensive talks the availability and the depth of the anchorage of all indicators of the GUTcert-SustainabilityCheck© is analysed in small groups and evaluated. Results are summarised into an extensive report.
The execution of an Assessment is the ideal basis for the formulation or intensification of a sustainabil-ity strategy. The results report, building on it, supports the company efficiently in the publication of sound, honest (next) sustainability report and/or CSR report.
Report Evaluation
GUTcert examines sustainability reports of companies with its tool. In addition, GUTcert offers the in-dependent expert's evaluation of existing and emerging sustainability reports or CSR reports according to the still valid GRI 3 and 3.1, to be able to identify the report according to GRI levels C+, B+, or A+. Of course we assess reports now also according to the new GRI 4, according to Type I as well as Type II.
-
Graphic Short Analysis: Corporate Results in the Automotive Industry
Following is the short evaluation of the 12 companies according to the indicator groups, listed de-scending by the points result. The orange line displays the average of 12 reports of the automotive in-dustry.
Fiat Group incl. Chrysler Sustainability Report 2012 A+ GRI Application Level Check
Number of points: 868
Peugeot
CSR Report 2011
A+ GRI Application Level Check
Number of points: 834
Renault
Sustainability Report 2011 with reference to GRI with index, but without Applica-tion Level
-
Ford
Sustainability Report 2011-2012
A GRI Application Level Number of points: 790
BMW Group
Sustainable Value Report 2010 and KPI-2011 A+ GRI Application Level Check
Number of points: 790
Daimler
Sustainability Report 2011 and environmental guide-lines
A+ GRI Application Level Check
-
Volkswagen
Sustainability Report 2011 A+ GRI Application Level Check
Additional Links Number of points: 756
Nissan
Sustainability Report 2012 and environmental indicators report
with reference to GRI with index, but without Applica-tion Level
referred to ISO 26000 Number of points: 739
Toyota
Sustainability Report 2012 and report on environmental facts and figures
referred to ISO 26000 no GRI reference Number of points: 681
-
General Motors (GM) Sustainability Report 2012 with reference to GRI with index, but without Applica-tion Level
Number of points: 671
Volvo
Sustainable Value Report 2012
B GRI Application Level Reference to the Business Annual Report
Number of points: 605
Honda
CSR Report 2012 and Environmental Report with reference to GRI but-without index and but-without Application Level