ContentslistsavailableatScienceDirect
Virus
Research
jo u r n al hom e p ag e :w w w . e l s e v i e r . c o m / l o c a t e / v i r u s r e s
High-resolution
mapping
of
resistance
to
cassava
mosaic
geminiviruses
in
cassava
using
genotyping-by-sequencing
and
its
implications
for
breeding
Ismail
Y.
Rabbi
a,∗,
Martha
T.
Hamblin
b,
P.
Lava
Kumar
a,
Melaku
A.
Gedil
a,
Andrew
S.
Ikpan
a,
Jean-Luc
Jannink
b,c,
Peter
A.
Kulakow
aaInternationalInstituteforTropicalAgriculture(IITA),Ibadan,Nigeria bDepartmentofPlantBreedingandGenetics,CornellUniversity,Ithaca,NY,USA cUSDA-ARS,R.W.HolleyCenterforAgricultureandHealth,Ithaca,NY,USA
a
r
t
i
c
l
e
i
n
f
o
Articlehistory:
Availableonline31December2013 Keywords:
Cassavamosaicdisease Breeding Phenotyping Monogenicresistance Genotyping-by-sequencing QTL
a
b
s
t
r
a
c
t
Cassavamosaicdisease(CMD),causedbydifferentspeciesofcassavamosaicgeminiviruses(CMGs),isthe mostimportantdiseaseofcassavainAfricaandtheIndiansub-continent.Thecultivatedcassavaspecies isprotectedfromCMDbypolygenicresistanceintrogressedfromthewildspeciesManihotglazioviiand adominantmonogenictypeofresistance,namedCMD2,discoveredinAfricanlandraces.Theabilityof themonogenicresistancetoconferhighlevelsofresistanceindifferentgeneticbackgroundshasled recentlytoitsextensiveusageinbreedingacrossAfricaaswellaspre-emptivebreedinginLatin Amer-ica.However,mostofthelandracescarryingthemonogenicresistancearemorphologicallyverysimilar andcomefromageographicallyrestrictedareaofWestAfrica,raisingthepossibilitythatthediversity ofthesingle-generesistancecouldbeverylimited,orevenlocatedatasinglelocus.Severalmapping studies,employingbulksegregantanalysis,indifferentgeneticbackgroundshavereportedadditional molecularmarkerslinkedtosupposedlynewresistancegenes.However,itisnotpossibletotellifthese areindeednewgenesintheabsenceadequategeneticmapframeworkorallelismtests.Toaddressthis importantquestion,ahigh-densitysinglenucleotidepolymorphism(SNP)mapofcassavawasdeveloped throughgenotyping-by-sequencingabi-parentalmappingpopulation(N=180)thatsegregatesforthe dominantmonogenicresistancetoCMD.VirusscreeningusingPCRshowedthatCMDsymptomsand presenceofviruswerestronglycorrelated(r=0.98).Genome-widescanandhigh-resolutioncomposite intervalmappingusing6756SNPsuncoveredasinglelocuswithlargeeffect(R2=0.74).Projectionof thepreviouslypublishedresistance-linkedmicrosatellitemarkersshowedthattheyco-occurredinthe samechromosomallocationsurroundingthepresentlymappedresistancelocus.Moreover,theirrelative distancetothemappedresistancelocuscorrelatedwiththereporteddegreeoflinkagewiththe resis-tancephenotype.Clusteranalysisofthelandracesfirstshowntohavethistypeofresistancerevealed thattheyareverycloselyrelated,ifnotidentical.Thesefindingssuggestthatthereisasinglesourceof monogenicresistanceinthecrop’sgenepooltracingbacktoacommonancestralclone.Intheabsence offurtherresistancediversification,thelong-termeffectivenessofthesinglegeneresistanceisknown tobeprecarious,giventhepotentialtobeovercomebyCMGsduetotheirfast-pacedevolutionaryrate. However,combiningthequantitativewiththequalitativetypeofresistancemayensurethatthis resis-tancegenecontinuestoofferprotectiontocassava,acropthatisdependeduponbymillionsofpeople inAfricaagainstthedevastatingonslaughtofCMGs.
©2013TheAuthors.PublishedbyElsevierB.V.
∗Correspondingauthorat:IITA,Headquarters&WestAfricaHub,PMB5320,Oyo Road,Ibadan200001,OyoState,Nigeria.Tel.:+23427517472x2719;
fax:+442087113785.
1. Introduction
1.1. Cassavamosaicdisease
Cassava(ManihotesculentaCrantz,familyEuphorbiaceae)isa
starchyrootcropthatsuppliescarbohydrateenergytomillionsof
peopleinthetropics (Ceballosetal.,2004)andit isbeingused
increasingly asanindustrialcrop(Janssonet al.,2009).Though
itsremarkableabilitytotolerateunfavourableconditionssuchas
0168-1702 ©2013TheAuthors.PublishedbyElsevierB.V. http://dx.doi.org/10.1016/j.virusres.2013.12.028
Open access under CC BY-NC-ND license.
Africa(LeggandFauquet,2004).Thepandemicischaracterizedby
rapidspreadthroughsuper-abundantBemiciatabacivectors(Legg
andOgwal,1998)andisassociatedwitharecombinantstrainofthe
EastAfricancassavamosaicvirus–Uganda(EACMV-UG)alongwith
Africancassavamosaicvirus(ACMV)belongingtothegenus Bego-movirus,withintheGeminiviridiaefamily(Harrisonetal.,1997).
Important control measures against CMD include rogueing
ofsymptomatic plants,useof virus-freeplanting materialsand
deploymentofresistantvarieties.Thefirsttwooptionsarenotonly
labourintensiveanddifficulttoimplementbutalsorequire
contin-uousandlong-termintervention.Useofresistantvarietiesisthe
mosteffectivesolutioninmitigatingthenegativeeffectofCMDin
farmers’fieldsbecausethisapproachnotonlyreducesyieldlosses
duetothedisease,butalsoreduceslevelsofthevirusinoculum
inthefarmingsystemparticularlyinvarietiesthatsuppressvirus
accumulation.
1.2. Sourcesofresistancetothedisease
CurrentlydeployedresistanceagainstCMDinAfricaisoftwo
types:(i)quantitativeresistancederivedfromManihotglaziovii;
and (ii) qualitative resistance conferred by a single resistance
gene(s). The quantitative resistance was introgressed into
cul-tivatedcassava followinganunsuccessful worldwidesearch for
resistant clones in the 1930s (Nichols, 1947; Jennings, 1976).
Genetic studies reveal that the polygenic resistance from M.
glazioviiis recessive witha heritabilityof about 60%(Jennings,
1976).Thesecondtypeofresistance, whichisconditionedbya
single-genewithadominanteffect,wasdiscoveredinthe1980s
inlandracesfromNigeriaandotherWestAfricancountries(Akano
etal.,2002;Fregeneetal.,2001).Theselandraces,whichdisplay
near-immunityagainstnearlyallspeciesofCMGs,arecurrently
maintainedinthe IITAgermplasmcollection referred toasthe
Tropical Manihot esculenta (TMe) series.Diversitystudies using
molecularmarkershavepreviouslyshownthatmostoftheoriginal
landracesbearing thisqualitative resistancetoCMDare
geneti-callyverysimilarifnotidentical(Fregeneetal.,2000;Lokkoetal.,
2006).Thissuggeststhatthegeneticbaseofthistypeofresistance
intheAfricancassavagenepoolmaybenarrow,orevenjustasingle
locus.Incontrast,therelativeeasewithwhichthehighly
herita-blemonogenicresistancecanbetransferredbetweengermplasm
throughsimplecrosses,hasresultedinitsextensiveusagein
breed-ingacrossAfricaaswellaspre-emptivebreedinginLatinAmerica
(Okogbeninetal.,2007).Thelong-termstabilityofthissingle-gene
typeofresistanceindiversegeographicalregionswith
heteroge-neousspeciesandrecombinantsofCMGsisuncertaingiventhe
highevolutionaryrateofgeminiviruses(DuffyandHolmes,2009).
Severalgeneticmappingstudieshavebeenconductedtofind
molecularmarkerslinkedtothequalitativeresistanceintheAfrican
germplasm.Thefirststudyidentifiedtwomarkers,a
microsatel-lite(SSRY28)andanRFLP(GY1)thatflankasinglelocusnamed
CMD2atdistancesof9and8cM,respectively(Akanoetal.,2002).
SubsequenttothediscoveryoftheCMD2locus,laterstudieshave
just45 markers,ofwhichonly threewereinthelinkagegroup
containingtheresistancelocus.
Theobjective of thisstudy wastoprovide acomprehensive
frameworkfordescribingthebreadthofthegeneticbaseofthe
single-generesistancetoCMDintheAfricancassavagermplasm.
Firstly, a full-sib mapping population segregating for
qualita-tiveresistancetoCMDwasdevelopedandphenotypedforthree
growingseasons.Thepopulationwasgenotypedusing
genotype-by-sequencing(GBS),andadensegeneticlinkagemapwithmore
than8000singlenucleotidepolymorphism(SNPs)wasconstructed.
Usingthisresource,ahigh-resolutiongeneticmappingoftheCMD
resistancelocuswascarriedout.Themarkerspreviouslyreported
tobelinkedtoCMDresistancewerethenprojectedontothenewly
generatedgeneticmap.Thisrevealedtheirgenomiclocations,and
thespatialrelationshipbetweenthemandthemappedresistance
locusfromthepresentstudy.Toconfirmtherelationshipamong
theCMDresistantlandraces,clusteranalysiswascarriedoutusing
genome-wideSNPmarkers.
2. Materialsandmethods
2.1. Mappingpopulationdevelopment,phenotypingand genotyping
Afull-sibmappingpopulationsegregatingfordominant
mono-genicresistancetoCMDwasgeneratedbycrossingtwonon-inbred
clones.BothparentsareelitelinesdevelopedbyIITAinNigeria.
Thefemaleparent,IITA-TMS-011412,ishighlyresistanttoCMD
andalsorichinpro-vitaminA.Clonedin1974,themaleparent,
IITA-TMS-4(2)1425,isanimprovedvarietyfromacrossbetweena
landracefromNigeria(TME109,locallyknownasOyarugbafunfun)
andvariety58308,ahybridderiveddirectlyfromrecombinationof
theM.glaziovii×M.esculentatriple-backcrosses(Jennings,1976).
Variety 58,308 was the main source of the quantitative
resis-tancetoCMDandproducedsomeofthefirstgenerationTropical
ManihotSelectionlines(seethediscussionsectionformore
back-ground).IITA-TMS-4(2)1425showsconsiderablesusceptibilityto
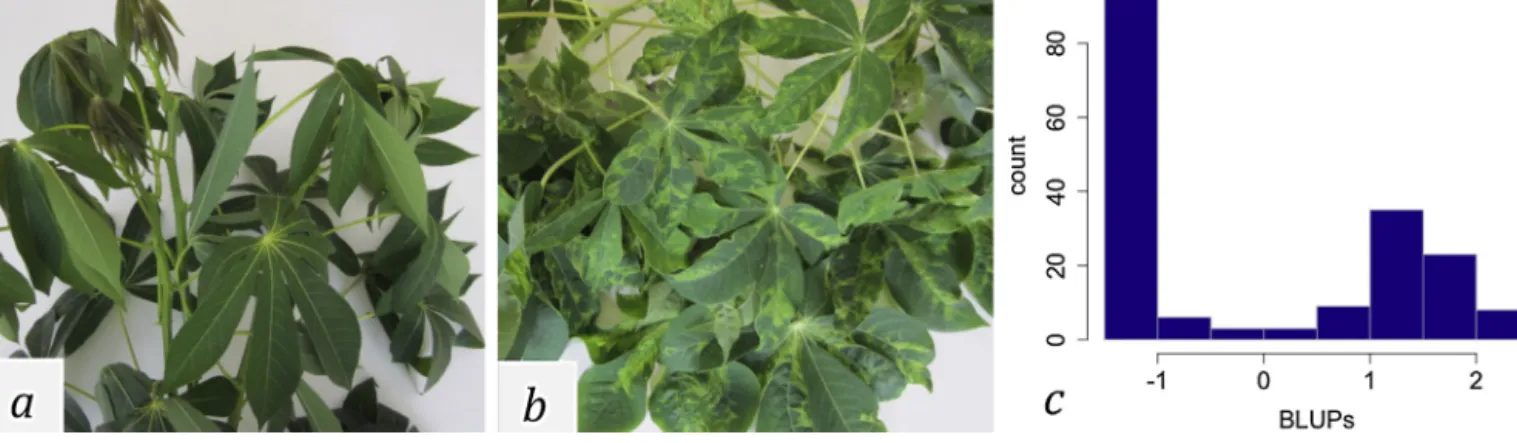
CMD(Fig.1).
The180F1seedsproducedweregerminatedinsterilized
gar-densoilandtransplantedonemonthaftersowing.Atmaturity,the
seedlingswerecloned,regardlesswhethertheywereinfectedor
not,andplantedatIbadan,Nigeria(7.40◦Northlatitude,3.90◦East
longitude)usingarandomizedcompleteblockdesign.Eachclone
wasplantedintworeplicated plotsoffivestandsperplotwith
plantspacingof1m×0.5mforthree12-monthlongcropping
sea-sonsestablishedin2011,2012and2013.Generation-to-generation
propagationthroughcloningwasbasedonuseof12-cmlongstem
cuttingsinboththeinfectedandnon-infectedF1s.Alocallandrace
thatishighlysusceptibletoCMD,TME117,wasplantedasspreader
roweveryfifthplotandasborderrowsurroundingthe
experi-mentalfieldtofacilitatewhitefly-mediatedinoculationoftheF1
Fig.1. CMDsymptomonthemappingpopulationparents,(a)IITA-TMS-011412and(b)IITA-TMS-4(2)1425;(c)ThefrequencydistributionofCMDscoresusingtheBLUPs calculatedfromthethree-yeardata.
theplantingperiodcoincidewithhighwhiteflyactivityproviding
highprobabilityofnaturalexposureofplantpopulationtoCMD
inoculum.IndividualplantswereevaluatedforCMDsymptomsat
oneandthreemonthsafterplantingusingascalerangingfrom1
to5,withoneforsymptomlessplantswhilefiveisgivenformost
severesymptoms(severemosaicanddistortionofleaves).
The entire population was screened for presence of CMGs,
particularly for the presence of ACMV and EACMCV, the two
predominantspeciesprevailinginWestAfrica, toconfirmvirus
infectionintheinfectedplants.Thethirdfullyexpandedleaffrom
thetop was sampledfrom each of the 5 plants per plot; they
werepooledandDNAwasextractedandanalyzedforACMVand
EACMCVusingamultiplexPCRprotocol(Alabietal.,2008).
2.2. Genotyping-by-sequencing
DNAwasextractedfrom180F1individualsandthetwo
par-entsusingamodifiedDellaportamethod(Dellaportaetal.,1983).
Genotyping-by-sequencingasdescribedbyElshireetal.(2011)was
carriedoutattheInstituteofGenomicDiversity,CornellUniversity.
Briefly,DNAsfromtheF1individualsandparentsweredigested
individually withApeKIrestrictionenzyme, whichrecognizes a
fivebase-pairsequence(GCWGC,whereWiseitherAorT).This
enzymewaschosenbecauseofitspartialsensitivitytoDNA
meth-ylation,thusavoidingrepetitiveelementsregions,andfrequency
ofDNA-cutting(Elshireetal.,2011).Two95-plexGBS
sequenc-inglibrarieswerepreparedbyligatingthedigestedDNAtounique
nucleotideadapters(barcodes)followedbystandardPCR.
Sequenc-ingwasperformedusingIlluminaHiSeq2000.Thesequencingreads
fromdifferentgenotypeswerede-convolutedusingthebarcodes
andaligned totheversion4.1 ofthecassavareferencegenome
(www.phytozome.org/cassava)byusingBurrowWheelers
Align-menttool(LiandDurbin,2009).SNPswereextractedusingtheGBS
pipelineimplementedinTASSELsoftware(Bradburyetal.,2007),
andgenotypeswerecalledusingacustomRscript.
2.3. Dataanalysis
Thepseudo-testcrosslinkagemappingstrategythatisemployed
intheanalysisoffull-sibmappingpopulationsrequires
unambigu-ousscoringoftheparentalgenotypesateachmarker.Toensure
this,theparentalDNAsweresequencedredundantlyfourtimesand
theirIlluminareadswerepooledtoincreasethenumberand
accu-racyofthecalledSNPs.Followingalignmentofthereadsagainst
thereferencegenome,theSNPsthatsegregatedintheparentsas
ab×ab(bothparentsheterozygous),aa×ab(maleparent
heteroy-gous),andab×aa(femaleparentheterozygous)wereextracted.
Priortolinkageanalysis,standardqualitycontrolwasusedtofilter
outSNPsfromparalogoussequences(i.e.lociwhichappearas
het-erozygousinbothparentsandallprogenies).Alsofilteredwereloci
showingsignificantdeviationfromexpectedgenotypicfrequencies
basedonchi-squaretest(thresholdforremoval:P≤0.05)aswellas
thosewithmissinginformationinmorethan20%ofthegenotyped
individualsinthemappingpopulation.
2.3.1. MappingofGBS-derivedApeKISNPs
GeneticlinkagemapswereconstructedusingJoinMapversion
4.1(VanOoijen,2006).Followingcalculationofpair-wise
recom-bination frequencies, linkage groups were identified using the
logarithmofodds(LOD)scoreofindependencebetweenpairsof
lociatathresholdof10.Duetothelargenumberofmarkersper
linkagegroup,themaximum-likelihoodmappingalgorithm
imple-mentedinJoinmap4.1wasusedtofindtheorderofthemarkersin
thelinkagegroups.Thismethodissuitablefordealingwithlarge
datasetscomparedtotheregressionmappingmethod(Cheemaand
Dicks,2009)andincorporatesseveralnumericalmethods:
simu-latedannealingforestimatingthebestmaporderbyminimizing
thesumofrecombinationfrequenciesinadjacentsegments;Gibbs
samplingforestimationof multipointrecombinationfrequency,
giventhecurrentmaporder;andspatialsamplingoflocitoreduce
theinfluenceofunknownordominantgenotypesaswellas
poten-tialerrors.Simulatedannealingwascarriedoutusingachainlength
of30,000withanacceptanceprobabilitythresholdof0.25.Gibbs
samplingformaximumlikelihoodestimationofmultipoint
recom-binationfrequencies (Jansen etal., 2001)wasdoneusingchain
lengthof50,000afteraburn-inlengthof20,000.
2.3.2. Phenotypicdataanalysis
Becausethecategoricaldiseaseseverityscoresfittedabi-modal
distribution,forstatisticalanalyses(ANOVAandQTLmapping)the
traitwasconvertedtoabinaryvariable(eitherresistantor
suscep-tible).IndividualswithcategoricalCMDseverityscorelargerthan
onewereclassifiedasAffected;allotherswereclassifiedas
Unaf-fected.Alogisticregressionmodelusinggeneralizedlinearmodel
wasusedtoestimatetheeffectofthegenotype,replication,
envi-ronmentandgenotype-by-environmentinteractionasfollows:
yijkl=+ˇi+Rij+Gk+ˇ∗iGk+eijkl
whereyijklwasthephenotype;themean,ˇitheyeareffect;Rij
thereplicationeffect; Gk thecloneeffect;ˇi*Gk isthe
interac-tionbetweencloneandyearandeijklistheresidual.Mixedmodel
wasusedtoobtainbestlinearunbiasedpredictors(BLUPs)foreach
genotypeforthecombinedthree-yeardata.Themixedmodelwas
computedusingtheRpackagelme4(Vazquezetal.,2010),
consid-eringtheeffectsofthegenotypesasrandom,whilereplications
tionwascarriedoutwiththeBLUPsobtainedforeachyear,and
acrossthecombinedanalysisofthe2011,2012and2013data.QTL
analysiswasperformedusingthreecomplementaryapproaches.
Becauseofhighmarkerdensity,singlemarker-traitassociationfor
all6756SNPswascarriedout.Themarkerswereconsideredasfixed
effectsinalinearmodelimplementedintheGLMfunctionTASSEL
(Bradburyetal.,2007).Thegenome-widesignificancethresholdfor
theF-statisticwasdeterminedbytheBonferronimethod(Bland
andAltman, 1995).Secondly, standard interval mapping
(inter-valsstepof2.5cM)wascarriedoutusingtheregressionmapping
function“scanone”implementedinR/qtlpackage(Bromanetal.,
2003).Thegenome-widesignificance(˛=1%)fordeclaringa
sig-nificantQTLlocuswasdeterminedusing1000permutations.The
95%BayesiancredibleintervalfortheCMDresistancelocuswas
determinedusingthefunction“bayesint”implementedinR/QTL.
Theproportionofphenotypicvarianceexplainedbytheresistance
locuswasobtainedbyfittingalinearmodel.Thirdly,QTLanalysis
usingtheCompositeIntervalMapping(CIM)methodwascarried
outwiththenumberofmarkercovariatessettothree.The
num-berof markers foruse asco-factors wasdetermined usingthe
automaticco-factorselectionfunction(stepwiseqtl)implemented
inR/qtl.TheCIMmethodenabledareductionin residual
varia-tionandtherebyincreasestheresolutionoftheQTLlocationand
withitthepossibilityofdetectinganyadditionalgenomicregions
thatunderlyresistancetoCMD.AnchoringCMD-resistance-linked
markersinthepresenthigh-densitygeneticmap
Thehigh-densitySNPmapdevelopedinthis studywasused
toanchorpublishedlociassociatedwithqualitativeresistanceto
CMD(Table1).Primersequencesthat flankfive ofthese
mark-ers(viz.SSRY28,NS198,SSRY106,NS158andNS169)wereused
in BLAST searches of the cassava reference genome sequence
(www.phytozome.org/cassava). Marker positions were
interpo-latedontothegeneticmaponthebasisofthescaffoldsharbouring
them(Table1).
landracesandfiveTMScloneswiththequantitativeresistance(as
anout-group),wereobtainedfromapreviousstudy(Lyetal.,2013),
andusedtoperformhierarchicalclusteringusingtheEuclidean
distancebetweenthegenotypes.Thesedistanceswereusedto
con-structarelationshipdendrogramoftheclones.
3. Results
3.1. SegregationforresistancetoCMDinthemappingpopulation
ThefrequencydistributionoftheCMDseverityscoresinthe
mappingpopulationrevealedabi-modalpatternwithtwopeaks
(Fig.1):nearlyhalfoftheprogeniesandthefemaleparent
(IITA-TMS-011412)wereresistanttoCMDand showednosymptoms
whiletheremainderoftheF1individualsshoweddisease
symp-tomsrangingfrommild(score2)tosevere(score5).Resistance
to CMD foundin the female parent is therefore likely to be a
singlegenewithdominanteffect.Therewasverylittlevariation
withinplotswithrespecttoCMDsymptomexpression:allstands
eithershowedsimilarsymptomsininfectedsusceptibleplotsor
nosymptomsatallintheresistantplots.Theconsistencyin
symp-tomexpressionislargelyduetotheclonaloriginfrominfected
cuttings which ensures transmissionof virusesacrosscropping
cycles. Moreover,there wasverylittleyear-to-yearvariation in
termsofCMDincidences:Thediseaseratingsinthe2011,2012and
2013growingseasonswerehighlycorrelated(Pearson’s
correla-tioncoefficient,r>0.91).Thiswasreflectedinthelargebroad-sense
heritabilityoftheresistancetraitasmeasuredatoneandthree
monthsafterplanting(H2of0.89and0.93,respectively).Analysis
ofvarianceusingthelogisticregressionmodelshowedahighly
significanteffectfor clone(p=<2E−16),while theotherfactors
suchasenvironment(year),clone×environmentinteractionand
replicationwerenotsignificant.
Table1
SummaryoftheknownmarkerstaggingCMDresistanceincassavaandtheirlinkagegroup.
Marker Primersequence Linkagegroup Scaffold(v4.1) Study Resistancesource
S5214780931 GBS-SNP 16 scaffold05214 Presentstudy IITA-TMS-011412
S521430911 GBS-SNP 16 Scaffold05214 Rabbietal.(inpress) IITA-TMS-961089A
SSRY28(CMD2) Fw:TTGACATGAGTGATATTTTCTTGAG Rev:GCTGCGTGCAAAACTAAAAT
16 scaffold05214 Akanoetal.(2002), Lokkoetal.(2005), Okogbeninetal.(2012)
TME3;TME7;IITA-TMS-972205
SSRNS158 Fw:GTGCGAAATGGAAATCAATG Rev:TGAAATAGTGATACATGCAAAAGGA
16 scaffold06906 Okogbeninetal.(2007) TME3
SSRNS169 Fw:GTGCGAAATGGAAATCAATG Rev:GCCTTCTCAGCATATGGAGC
16 scaffold06906 Okogbeninetal.(2007) TME3
RFLPRME-1 Fw:ATGTTAATGTAATGAAAGAGC Rev:AGAAGAGGGTAGGAGTTATGT
16 Nomatch Okogbeninetal.(2007) TME3
SSRNS198 Fw:TGCAGCATATCAGGCATTTC Rev:TGGAAGCATGCATCAAATGT
16 Scaffold04175 Okogbeninetal.(2012) IITA-TMS-972205
SSRY106 Fw:GGAAACTGCTTGCACAAAGA
Rev:CAGCAAGACCATCACCAGTTT
Table2
ScreeningresultsofthemappingpopulationforthepresenceofACMVandEACMV.
Diseasestatus Virusnotdetected ACMVonly ACMV+EACMV
Symptomatic 1 65 15
Asymptomatic 92 6 1
3.2. Screeningofthepopulationforcassavamosaicgeminiviruses
usingPCR
ThePCR-basedscreeningofthemappingpopulationdetected oneor moreof theCMGs in87 of 180plotsassayed,while 93 plotswerenegative(Table2).OnlytwospeciesofCMGs,ACMV
andEACMCV,weredetectedinthetrial,whichisconsistentwith
knownCMGsprevalenceinWestAfrica.ACMVwasdetectedinall
the87virus-positiveplots,whereasEACMCVwasdetectedasa
co-infectionwithACMVin16plots(17%incidence).Nocaseofsingle
infectionbyEACMCVwasdetected.CMGsweredetectedin79of81
symptomaticplotsindicatingastrongpositivecorrelationbetween
thevisualscoringofdiseaseandthePCRresults.Inaddition,PCR
alsodetectedoccurrenceof ACMVin7 asymptomaticplots and
ACMVandEACMCVinoneplot.MeanseverityofCMDsymptoms
inACMVinfectedplantswas3.1andplantsinfectedwithACMV
andEACMCVwas3.2,whichsuggestapparentlackofsynergistic
effectinheighteningsymptomseverityinduallyinfectedplants.
3.3. GenotypingofSNPmarkersandconstructionofadense geneticmap
Inall,17,682SNPswereobtainedfromtheSNPcallingpipeline.
TheSNPdataweresubsequentlyfilteredformarkerswithmore
than20% missingvalues acrossthegenotypedindividuals. Also
removedwerelocithatdeviatedfromtheexpectedgenotypic
fre-quenciesatChi-squaresignificancethresholdofP<0.05.Linkage
analysiswasdoneusing8704SNPsthatpassedthesetwoQCfilters.
A high-density genetic linkage map was constructed using
theMaximum-LikelihoodapproachimplementedinJoinmap4.1
(Table3).A totalof 6756SNPmarkersweremappedacross19
linkagegroupswithbetween115and559SNPs(average=256).
Withanaverageinter-SNPdistanceof0.52cM,thisisthedensest
mapdevelopedforcassavasofar(Fig.2).Despitethehighdensity
oftheGBS-derivedSNPsmapped,severalregionswithout
mark-erswereobserved.Mostnotablewereasingleregiononlinkage
250 200 150 100 50 0 Chromosome Location (cM) 1 2 2.2 3 4 5 6 7 8 9 10 11 12 13 14 15 16 17 18 Genetic map
Fig.2. Overviewofgeneticmapdevelopedfromthe6756ApeKI-derivedSNPs.
group4andtworegionsinlinkagegroup18. Apossiblereason
forsuchgapscouldbelackofpolymorphicmarkersasaresultof
identity-by-descentofthisregioninthetwoparents.
Mostofthe12,977scaffoldsthatconstitutethecurrent533Mb
oftheversion4.1cassavagenomeassemblyarefairlysmall;nearly
95%ofthemare200Kborsmaller.Atotal of1093unique
scaf-foldswereanchoredinthepresentmap,andrangedfrom19to
89inthedifferentlinkagegroups.Despitetheirrelativelysmall
number,theanchoredscaffoldscoveredatotalsizeof313.3Mb,
andaccountedfor58.7%ofthecurrentcassavagenomeassembly.
Thecompletegeneticmapdevelopedfromthisworkisavailablein
SupplementaryTable1.
3.4. High-resolutionmappingofCMDresistancelocus
Based onthequalitative natureof theresistanceto CMDin
thepresentmappingpopulation,a singlelocuswasexpectedto
underlietheresistancephenotype.Thehigh-densitygeneticmap
developedwith6756GBSSNPspermittedagenome-widesearch
Table3
SummarystatisticsofthegeneticlinkagemapdevelopedfromApekISNPmarkers.
Linkagegroup NumberofSNPs Length(cM) Averagedistances(cM) Numberofscaffoldsanchored Cumulativescaffoldsize(base-pairs)
1 473 242 0.51 66 30,226,735 2 344 195 0.57 52 20,822,503 2.2 366 175 0.48 59 20,298,754 3 419 168 0.40 55 12,608,655 4 255 194 0.76 57 13,843,915 5 543 230 0.42 61 15,175,445 6 275 182 0.67 73 15,911,788 7 559 256 0.46 66 21,949,504 8 454 222 0.49 78 18,054,518 9 207 72 0.35 19 6,148,875 10 299 148 0.50 55 15,132,961 11 304 203 0.67 41 13,797,633 12 115 99 0.87 21 6,111,492 13 302 200 0.67 60 17,048,413 14 543 242 0.45 89 19,282,711 15 451 225 0.50 49 18,831,996 16 281 152 0.54 64 16,048,872 17 275 156 0.57 70 17,372,231 18 291 154 0.53 58 14,665,500 Total 6756 256a 0.52a 1093 313,332,501
Fig.3. Single-markerassociationwithqualitativeresistancetoCMD.(a) Genome-wideP-valuesfor6756SNPsacross19linkage groupsshowingthestrongest associationsignalwaslocatedinlinkagegroup16.Thex-axisshowstheSNPsalong eachchromosome;y-axisisthe−log10(P-value)fortheassociation.(b)An asso-ciationplotforlinkagegroup16showingSNPsthatareinformativeinresistant (IITA-TMS-011412)andsusceptible(IITA-TMS-4(2)1425)parents.TheSNPsfrom scaffold5214withstrongestassociationtoresistancephenotypearehighlighted.
forthelocusunderlyingthequalitativeresistancetoCMD.Astrong
associationwasdetectedinlinkagegroup16thatpeakedataround
69.12cM(Fig.3).Thisassociationdecreasesonbothsidesofthe
peakasaresultofincreasingrecombinationbetweenthe
mark-ersandtheunderlyingresistancegene.MostSNPsshowinghighly
significantassociation (P<1E−40) came from the1.46Mb-long
scaffold5214,withmarkerS5214780931atthepeak;thismarker
explained74%ofthediseaseresistancevariance.Additionally,only
thoseSNPsthatareinformativeintheCMD-resistantfemaleparent
showthesignificantassociationswhilethosesegregatingonlyin
thesusceptiblemaleparentdonot(Fig.3).Thepresentlymapped
resistancelocusoccursin thevicinityofthepreviouslymapped
CMD2locus (Akano et al., 2002); marker S5214780931 is just
623.24kbaway froma microsatellitemarker,SSRY28(between
157,470bpto157,616bp), thatwasfirst reportedtobe closely
linkedtotheCMD2locus(Akanoetal.,2002),indicatingthatthe
samegenemayaccountfortheobservedresistancetoCMDinthe
presentmappingpopulation.
The results from the interval-mapping based QTL analysis
recapitulated those from single-marker trait associations, and
uncovered a singlepeak witha maximum LOD valueof 43 on
linkage group 16 (Supplementary Fig. 1). Despite employing
the Composite Interval Mapping method, no additional peaks
exceedingthe significance thresholdwere detected,confirming
thatonlyasinglelocusconferredthequalitativeresistanceinthe
presentpopulation.TheSNPmarkerS5214780931isflankedby
S5214472282andS52141084049wastheclosesttotheQTLpeak
qualitativeresistanceagainstCMD
Amajorobjective ofthepresentstudywastousethe
high-density SNP genetic map to anchor seven molecular markers
previouslyreportedtobelinkedtosingledominantgeneresistance
toCMDinfourothergeneticbackgrounds(Table1).TheSSRand
RFLPmakersusedinthosestudieswerethereforeanchoredinthe
presentmapviatheirharbouringscaffolds.Thesemarkerscame
fromscaffold05214(SSRY28),scaffold06906(NS158andNS169),
scaffold04175(NS198)andscaffold07933(SSRY106)allofwhich
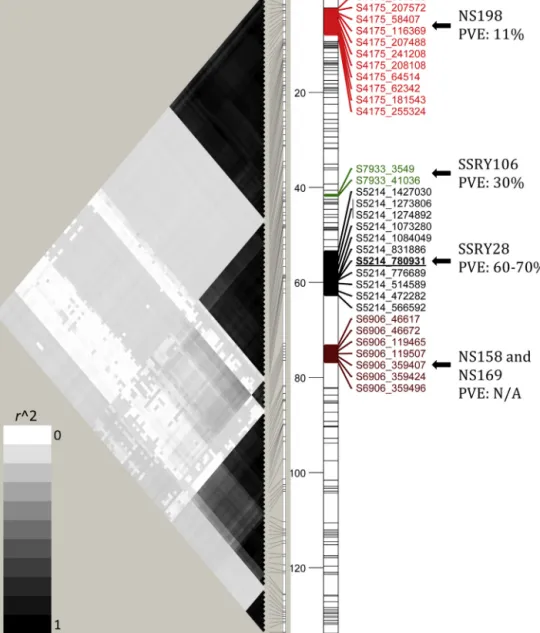
fallwithinthesamegenomicregionoflinkagegroup16ofthe
presentmap(Fig.4).TheprimersequencesfortheRFLPmarker
RME-1didnotidentifyasuitablematchinthereferencegenome.
Inaparallelstudyusinganotherbi-parentalmappingpopulation
derived froma crossbetweenanotherimprovedvarietythat is
nearlyimmunetoCMD(IITA-TMS-961089A)andasusceptible
lan-drace(TME117),anotherSNPmarkerwasidentifiedfromthesame
scaffold(S521430911).It wasstrongly associatedwiththe
dis-easeresistanceandexplained60%ofphenotypicvariation(Rabbi
etal.,inpress).Thereportedpercentageofvariationexplainedby
thesemarkersshowsagradientthatpeaksaroundscaffold05214,
theregionthatislikelytocontaintheconcernedresistancegene
(Fig.4).Markersawayfromthisregionhavebeenreportedtobeless
linkedtotheresistancegenebythelowpercentageofvariationthat
theyexplain,atrendthatagreeswiththeGWAresults,particularly
consideringthesegregatingmarkersfromthefemaleparent(Fig.3).
3.6. Recombinationpatterninlinkagegroup16
Tovisualizethedegreeoflinkageandrecombinationpattern
betweenthepresentlymappedCMDresistancelocusandother
previously publishedSSRmarkers along the linkagegroup,the
chromosome-widepatternofLDonlinkagegroup16wasexamined
(Fig.4).Theresultinghaplotypemapisusefulinprovidinga
frame-workforinterpretingtheresultsofthepreviousmappingstudies,
particularlytheproportionofphenotypicvariationexplainedby
the various microsatellite markers and their relative locations
in the present map. Though different parents are used in the
presentandpreviousmappingstudies,thesepopulationshaveall
Table4
MarkersflankingthepresentlymappedCMDresistancelocuscalculatedfromdiseaseseverityscoredatone-andthree-monthsafterplanting.Thetablealsopresentsthe linkagegroup,positionandintervalmapping-basedpercentageofphenotypevariationexplainedbytheclosestmarker.
Trait SNP Linkagegroup Position(cM) PeakLODa R2 H2
CMD1Sb S52141084049 16 68.88 45.37 0.708 0.892 S5214780931 16 70.00 45.59 S5214472282 16 70.74 44.99 CMD3Sb S52141084049 16 68.88 42.98 0.696 0.928 S5214780931 16 69.31 43.20 S5214 472282 16 70.74 42.33
aLogarithmofoddsscoreforpresenceofQTL.
Fig.4.Graphicaldisplayofthevariationinthelinkagedisequilibrium(r2)alonglinkagegroup16calculatedforeverypairofSNPsinthebi-parentalmappingpopulation (left);andthegeneticmap(right).ThelocationofthemappedCMDresistancelocus(underlinedSNP,viz.S5214780931)inscaffold05214relativetoSSRsotherscaffolds (S7933,S4175andS6906)containingmicrosatellitemarkersreportedtobelinkedtoresistancetoCMDisshownontheright.Thepercentageofphenotypicvariation explainedbythe(PVE,measuredbyr2)arealsopresented.ThedarkshadingcorrespondstostrongerLD(higherr2).NamesofotherSNPsinthelinkagegroupwereomitted duetospaceconstraints;butareavailableintheSupplementary(SupplementaryTable1).
undergoneasingleroundofmeiosisandarethusexpectedtohavea
similarextentoflinkagedisequilibriumacrosstheirchromosomes.
TheregionbearingtheCMDresistancelocuswascharacterized
bytwolargehaplotypeblocks(dark-greyshadingbetween0to
32cMand36to62cM,respectively).ModerateLDwasdetected
betweentheseblocks(light-greyshading).Thefirstblock
encom-passesscaffold4175,whichharboursmicrosatellitemarkerNS198,
reportedbyOkogbeninetal.(2012)toexplain11%ofvariationin
CMDresistanceinabi-parentalpopulation.SNPsfromthis
scaf-foldandthoseneartheCMD2locusinscaffold05214alsoshow
moderateLD(r2∼0.10).
TheCMDresistancelocusoccursinthesecondLDblock.
Scaf-fold5214harbourstheSNPsthatwerestronglyassociatedtothe
resistanceaswellasthemicrosatellitemarkerSSRY28reported
previously(Akano etal., 2002).Thoughdiscovered from
differ-entgeneticbackgrounds,theresistance-linkedSNPsandSSRY28
explainbetween60%and70%ofthediseaseresistancevariance.
Thesemarkersarejust 623.24kbapart.Anotherscaffoldin this
block(07933)whichharboursmicrosatellitemarkerSSRY106,was
reported to explain nearly 40% of variation in CMD resistance
(Lokkoetal.,2005).
3.7. GeneticrelatednessofCMD-resistantlandracesusing genome-wideSNPs
Inadditiontogeneticmappingofthebi-parentalpopulation,
cluster analysis was performed with key landraces known to
possessstrongresistancetoCMD(Fig.5).Toestimatethe“residual
geneticdistance”betweenidenticalclonesresultingfrom
genotyp-ingerror,severalclones–someofwhichhavedifferentnamesas
aresultofadoptionindifferentregions–wereredundantly
geno-typed.Thesepairsincludethemaleparent(IITA-TMS-4(2)1425)
and“Kibandameno-white”;IITA-TMS-30572knownas“Migyera”
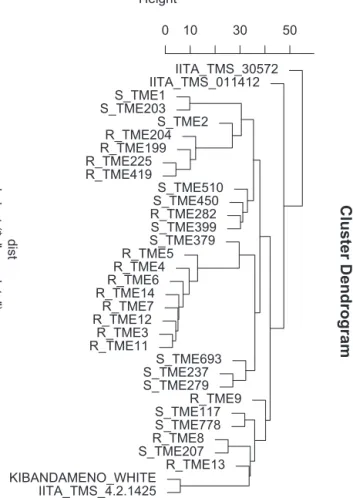
in Uganda; and TME12 (A and B). Most of the CMD resistant
landraces,includingthosethat werefirstdiscovered inNigeria,
areclearlyverycloselyrelated,orevenperhapsidentical,based
oncomparison ofthe distancebetween them and theresidual
R_TME282 S_TME399 S_TME379 R_TME5 R_TME4 R_TME6 R_TME14 R_TME7 R_TME12 R_TME3 R_TME11 S_TME693 S_TME237 S_TME279 R_TME9 S_TME117 S_TME778 R_TME8 S_TME207 R_TME13 KIBANDAMENO_WHITE IITA_TMS_4.2.1425 dist
Fig.5.Ahierarchicalclusteringtreebasedondissimilaritiesbetweenaselectionof landracesusingof2069SNPmarkers.MostofthelowerTMEserieslandracesthat areresistanttoCMDformasingle,tightcluster(bottom).Theprefix“R”denotes CMD-resistantand“S”denotesCMD-susceptiblevarieties.
previousstudiesusingAFLPs(Fregeneetal.,2000).Theselandraces
(TME3,TME4,TME6,TME7,TME11,TME12and TME14)have a
verysimilarmorphologicalappearance,mostprominentofwhich
isredpetioles.
4. Discussion
4.1. Ahistoricalperspectiveofdevelopmentanddiffusionofearly CMDresistantvarietiesacrossofAfrica
BreedingforresistancetoCMDhasbeenamajorgoalofcassava
improvementprogrammesinAfricaformorethan70years.Priorto
thediscoveryofthesingle-generesistance(Akanoetal.,2002),the
primarydefenceagainstthediseasewasthepolygenicresistance
introgressedintocultivatedcassava(M.esculenta)fromM.glaziovii
afterthreecyclesofbackcrossing(Nichols,1947).Examiningthe
breedinghistoryofimprovedvarietieswiththequantitative
resis-tancetoCMDrevealsaverynarrowgeneticbasetracingbacktoa
singlederivativeoftheM.glaziovii×M.esculentacrosses(Jennings,
2003). None of these descendants is immune to infection by
CMGs(Nichols,1947)althoughsomeexpressmildandsometimes
transientsymptomsasaresultofincompletesystemicinfection
thatleadstoreversionofsymptoms(Jennings,1976;Fargetteetal.,
1994),whileothersarequitesusceptibletothedisease.TheseTMS
varietiesthattracebacktoM.glazioviihavebeenwidelyadopted
inAfricaandhelpedrevivecassavafarmingfollowingthe
devas-tationofmany locallandracesin EastAfrica(Leggand Fauquet
2004).Someof theadopted TMSvarietiesare IITA-TMS-60142,
densegeneticmapobtainedfromGBShasenabledahigherlevelof
mappingresolutionoftheCMDresistancelocus.Linkagegroup16
hasatotalof281SNPs,andtheapproximate95%Bayesiancredible
intervalaroundthemappedlocusisjust1.1cM.Thisresolutionwas
notobtainableusingthetraditionalmarkerfrompreviousmapping
efforts.
4.3. Allmarkerslinkedtoqualitativeresistanceoccurinthesame chromosomeregion
Thehigh-densitySNPgeneticmapwasusedtoanchormarkers
previouslyreportedtobelinkedtothedominantmonogenic
resis-tancetoCMD.Thesemarkers(Table1)wereinterpolatedinthe
presentmapviathescaffoldsthatharbourthem.Allofthem(except
RME1andRME4forwhichasuitablematchesinthecurrent
ref-erencegenomewerenotfound)camefromscaffoldsoccurringin
thesameregionoflinkagegroup16.Overall,thereisageneral
con-gruencebetweentheproportionofgeneticvariationreportedfor
thesemicrosatellitemarkers,themarker-traitassociationprofilein
linkagegroup16(Fig.3)andthepatternoflinkagedisequilibrium
(measureasr2)betweenmicrosatellitelocationsandtheputative
positionoftheresistancelocusinthepresentpopulation(Fig.4).
Thispatternsupportstheideathatmostofthemicrosatellite
mark-ersreportedtobelinkedtovaryingdegreeswithCMDresistance
areassociatedwithasingleresistancelocusthatismostlikelythe
CMD2gene.Moreover,thestrengthofthelinkagedecreasedwith
increasingdistancefromthegenelocation.Inaparallelmapping
studyusinganotherimprovedvarietythat isnearlyimmuneto
CMD(IITA-TMS-961089A)andasusceptiblelandrace(TME117),a
strongQTLsignalwasfoundinscaffold05214thatalsoexplained
60%ofresistancevariation,implicatingthesameCMD2locus(Rabbi
etal.,inpress).Consideringtheresultsofthepresentstudyand
thoseofAkanoetal.(2002),Okogbeninetal.(2012),andLokko
etal.(2005),itishighlylikelythatathereisasinglegene,ora
clusterofresistancegenes(MichelmoreandMeyers,1998).
Indeed,theconservationofQTLpositionsamongthedifferent
sourcesofCMDresistanceisnotsurprisinggiventhatthemajority
ofthehighlyresistantcultivarsdevelopedrecentlyinAfricatrace
toafewlandraceaccessionsfromNigeriathatwereusedoverthe
last12orsoyearsofresistancebreedinginwhichthemeritsof
theTMEmaterialswereappreciated.Accordingtothephylogeny
(Fig.5)itwasconfirmedthatseverallandracesthatwerefirst
dis-coveredtobenearlyimmunetoCMDweregeneticallyverysimilar.
Thesefindingsagreewithapreviousstudy(Fregeneetal.,2000).
Otherduplicates,whicharealsomorphologicallyverysimilar,were
identified.TheselandraceswerecollectedfromSouthWestand
CentralNigeriaandhavedifferentlocalnames.Theresistanceinthe
landraceTME9,whichalsooccursinaseparatecladeonthe
phy-logenetictree,islikelytobeCMD2.Thislandracesisfoundinthe
pedigreeofIITA-TMS-961089Athatwasusedinaparallelmapping
study;resistance-linkedmarkersalsocamefromscaffold05214
(Rabbietal.,inpress).Itispostulatedthatalloftheselandraces,
mutantthatwasselectedbyfarmersandrapidlydiffusedinthe
regionthroughvarietaldisseminationefforts.
4.4. Screeningofcassavamosaicgeminivirusesinthemapping population
TheCMGscreening resultsshowedthatACMVwasthe
pre-dominantspeciesinthefield,whereasEACMVoccurredatlower
frequencyandonlywithACMVasadualinfection.The
preponder-anceofACMVreflectstheknownproportionsofthetwovirusesin
WestAfricaandcontrastswiththepredominanceofEACMV-UGin
thepandemicregionsofEasternAfrica(LeggandFauquet,2004).
ThesevereformofEACMV-UGhasdisplacedotherCMGspeciesand
strainsduringtherecentpandemicthatsweptthroughtheregion
(Leggetal.,2006).Animportantquestioniswhetherthe
CMD2-typeofresistanceavailableintheWest-Africancassavagermplasm
canprotectagainstthesemorevirulentstrainsofCMGthatdoes
notcontributetothediseasepressureinWestAfrica.Germplasm
screeninginUgandahavedemonstratedthatthequalitative
resis-tancelocusintheTMElandracesishighlyeffectiveagainstthisvirus
(Kawukietal.,2011).Similarresultshavebeenobtainedthrough
biolisticinoculationmethodsusing-pseudorecombinantsofACMV
and EACMV(Sserubombwe et al.,2008).Some of thescreened
clonesincludeTME5andTME14,whichclustertogetherwithTME3,
theoriginalsourceoftheCMD2locus(Fig.5).Theevidencesuggests
thatCMD2locusisamonogenicresistancewithbroadspecificity
againstcassava-infectinggeminiviruses.
4.5. Prospectsforlong-termefficacyofCMD2resistancegene
Despite the apparent broad specificity of the CMD2 gene,
whetherthelocuscanconferdurableresistanceaccordingtothe
classical definition(Johnson, 1984) depends onwhetherit will
remaineffectiveoveraprolongedperiodofwidespreaduseunder
conditionsconducivetothedisease.Itiswellknownthat
mono-genicresistancecanbeephemeralandsubjectedtothewellknown
boom-and-bustcycles(McDonaldandLinde,2002)asaresultof
therapidgeneticevolutioninthepathogenthoughthereis
evi-dence of durable resistancefrom singlegene actions (Johnson,
1984;Stuthmanetal.,2007).Sinceitsdiscoveryinthe1980sand
subsequentextensiveuseinbreedingprogrammesinsub-Saharan
Africa,therehasbeennoreportofbreakdownoftheCMD2-type
ofresistanceinthefield,indicatingthatthelocuscouldbedurable
againstCMGs.Still,thelong-termeffectivenessoftheresistance
locusneedstobeaugmentedbycombiningitwiththe
quantita-tiveresistancederivedfromM.glaziovii.Indeed,crossescombining
thesetwotypesofresistancehavegiven risetoprogeny which
arenearimmunetoallknownCMGspecies,includingthevirulent
EACMV-Uganda(LeggandFauquet,2004;Mondeetal.,2012).
Addi-tionally,moreeffortsareneededforacomprehensivescreeningof
theresistantlandracestoidentifyanyadditionalsourcesthatmay
exist.Thoughincreasedresolutionwasachievedinthemapping
analysis,alargermappingpopulationisrequiredforfine-mapping
andcloningoftheconcernedlocus.Thiswillprovideinsightsonthe
mechanismoftheresistancethatsofarseemstobehighlyeffective
againstvariousCMGspecies.
Acknowledgments
ThisresearchwassupportedbytheCGIAR-ResearchProgramme
onRoots,TubersandBananasandthe“NextGenerationCassava
BreedingProject”,throughfundingfromtheBill&MelindaGates
Foundation and theDepartment for International Development
of theUnitedKingdom. We acknowledgethehelp of Charlotte
Acharya for preparation of GBS libraries and sequencing, and
OluwafemiAlabaforsamplepreparationandDNAextraction.
AppendixA. Supplementarydata
Supplementarymaterial related tothis articlecan befound,
in the online version, at http://dx.doi.org/10.1016/j.virusres.
2013.12.028.
References
Akano,A.,Dixon,A.,Mba,C.,Barrera,E.,Fregene,M.,2002.Geneticmappingofa dominantgeneconferringresistancetocassavamosaicdisease.Theor.Appl. Genet.105,521–525.
Alabi,O.J.,Kumar,P.L.,Naidu,R.A.,2008.MultiplexPCRmethodforthedetectionof AfricancassavamosaicvirusandEastAfricancassavamosaicCameroonvirusin cassava.J.Virol.Met.154,111–120.
Barrett,J.C.,Fry,B.,Maller,J.D.M.J.,Daly,M.J.,2005.Haploview:analysisand visual-izationofLDandhaplotypemaps.Bioinformatics21,263–265.
Bland,J.M.,Altman,D.G.,1995.Multiplesignificancetests:theBonferronimethod. Br.Med.J.310,170.
Bradbury,P.J.,Zhang,Z.,Kroon,D.E.,Casstevens,T.M.,Ramdoss,Y.,Buckler,E.S.,2007. TASSEL:softwareforassociationmappingofcomplextraitsindiversesamples. Bioinformatics23,2633–2635.
Broman,K.W.,Wu,H.,Sen, ´S.,Churchill,G.A.,2003.R/qtl:QTLmappingin experi-mentalcrosses.Bioinformatics19,889–890.
Ceballos,H.,Iglesias,C.A.,Pérez,J.C.,Dixon,A.G.,2004.Cassavabreeding: opportu-nitiesandchallenges.PlantMol.Biol.56,503–516.
Cheema,J.,Dicks,J.,2009.Computationalapproachesandsoftwaretoolsforgenetic linkagemapestimationinplants.Brief.Bioinform.10,595–608.
Dellaporta,S.L.,Wood,J.,Hicks,J.B.,1983.AplantDNAminipreparation:versionII. PlantMol.Biol.Rep.1,19–21.
Duffy,S.,Holmes,E.C.,2009.Validationofhighratesofnucleotidesubstitutionin geminiviruses:phylogeneticevidencefromEastAfricancassavamosaicviruses. J.Gen.Virol.90,1539–1547.
Elshire,R.J.,Glaubitz,J.C.,Sun,Q.,Poland,J.A.,Kawamoto,K.,Buckler,E.S.,Mitchell, S.E.,2011.Arobust,simplegenotyping-by-sequencing(GBS)approachforhigh diversityspecies.PLoSOne6,e19379.
Fargette,D.,Jeger,M.,Fauquet,C.,Fishpool,L.D.C.,1994.Analysisoftemporaldisease progressofAfricancassavamosaicvirus.Phytopathology84,91–98. Flint-Garcia,S.A.,Thornsberry,J.M.,Buckler,I.V.E.S.,2003.Structureoflinkage
dis-equilibriuminplants.Annu.Rev.PlantBiol.54,357–374.
Fregene,M.,Bernal,A.,Duque,M.,Dixon,A.,Tohme,J.,2000.AFLPanalysisofAfrican cassava(ManihotesculentaCrantz)germplasmresistanttothecassavamosaic disease(CMD).Theor.Appl.Genet.100,678–685.
Fregene,M.,Okogbenin,E.,Mba,C.,Angel,F.,Suarez,M.C.,Janneth,G.,etal., 2001.Genomemappingincassavaimprovement:challenges,achievementsand opportunities.Euphytica120,159–165.
Harrison,B.D.,Zhou,X.,Otim-Nape,G.W.,Liu,Y.,Robinson,D.J.,1997.Roleofanovel typeofdoubleinfectioninthegeminivirus-inducedepidemicofseverecassava mosaicinUganda.Ann.Appl.Biol.131,437–448.
Herrera-Campo,B.V.,Hyman,G.,Belloti,A.,2011.Threatstocassavaproduction: knownandpotentialgeographicdistributionoffourkeybioticconstraints.Food Sec.3,329–345.
Jansson,C.,Westerbergh,A.,Zhang,J.,Hu,X.,Sun,C.,2009.Cassava,apotential biofuelcropin(the)People’sRepublicofChina.Appl.Energy86,S95–S99. Jennings,D.L.,1976.BreedingforResistancetoAfricanCassavaMosaicDisease:
ProgressandProspects.In:InterdisiplinaryWorkshop.IDRC,Muguga(Kenya). Jennings,D.L.,2003.Historicalperspectiveonbreedingforresistancetocassava
BrownStreakVirusDisease.In:Hillocks,R.J.(Ed.),CassavaBrownStreakVirus Disease:Past,Present,andFuture.ProceedingsofanInternationalWorkshop. Mombasa,Kenya,27–30October2002.NaturalResourcesInternationalLimited, Aylesford,UK,p.100.
Jansen,J.,deJong,A.G.,vanOoijen,J.W.,2001.Constructingdensegeneticlinkage maps.Theor.Appl.Genet.102,1113–1122.
Johnson,R.,1984.Acriticalanalysisofdurableresistance.Annu.Rev.Phytopath.22, 309–330.
Kawuki,R.S.,Pariyo,A.,Amuge,T.,Nuwamanya,E.,Ssemakula,G.,Tumwesigye,S., Bua,A.,Baguma,Y.,Omongo,C.,Alicai,T.,Orone,J.,2011.Abreedingschemefor localadoptionofcassava(ManihotesculentaCrantz).J.PlantBreed.CropSci.3, 120–130.
Legg,J.P.,Fauquet,C.M.,2004.CassavamosaicgeminivirusesinAfrica.PlantMol. Biol.56,585–599.
Legg,J.P.,Ogwal,S.,1998.ChangesintheincidenceofAfricancassavamosaic gemi-nivirusandtheabundanceofitswhiteflyvectoralongsouth–northtransectsin Uganda.J.Appl.Entomol.122,169–178.
Legg,J.P.,Owor,B.,Sseruwagi,P.,Ndunguru,J.,2006.Cassavamosaicvirusdiseasein EastandCentralAfrica:epidemiologyandmanagementofaregionalpandemic. Adv.VirusRes.67,355–418.
Li, H., Durbin, R., 2009. Fast and accurate short read alignment with Burrows–Wheelertransform.Bioinformatics25,1754–1760.
Pfl.45,2189–2201.
Nichols,R.F.W.,1947.Breedingcassavaforvirusresistance.EastAfr.Agric.J.12, 184–194.
Okogbenin,E.,Egesi,C.N.,Olasanmi,B.,Ogundapo,O.,Kahya,S.,Hurtado,P.,etal., 2012.Molecularmarkeranalysisandvalidationofresistancetocassavamosaic diseaseinelitecassavagenotypesinNigeria.CropSci.52,2576–2586.
Amsterdam,pp.319–367.
VanOoijen,J.W.,2006.JoinMap4.SoftwarefortheCalculationofGeneticLinkage MapsinExperimentalPopulations.KyazmaBV,Wageningen,Netherlands. Vazquez,A.I.,Bates,D.M.,Rosa,G.J.M.,Gianola,D.,Weigel,K.A.,2010.Technicalnote:
anRpackageforfittinggeneralizedlinearmixedmodelsinanimalbreeding.J. Anim.Sci.88,497–504.