Article
Analysis of Particulate Matter (PM) Emissions in
Diesel Engines Using Palm Oil Biodiesel Blended
with Diesel Fuel
Ahmad Fitri Yusop1,*, Rizalman Mamat1, Talal Yusaf2, Gholamhassan Najafi3, Mohd Hafizil Mat Yasin1and Akasyah Mohd Khathri1
1 Faculty of Mechanical Engineering, University Malaysia Pahang, Pekan 26600, Malaysia;
rizalman@ump.edu.my (R.M.); akasyah.mk@gmail.com (A.M.K.); mohdhafizil80@gmail.com (M.H.M.Y.) 2 Faculty of Engineering and Surveying, National Center for Engineering in Agriculture University of
Southern Queensland, Toowoomba, QLD 4350, Australia; yusaft@usq.edu.au
3 Faculty of Engineering, Tarbiat Modares University, 14115-143, Tehran, Iran; najafi14@gmail.com * Correspondence: fitriy@ump.edu.my
Received: 1 February 2018; Accepted: 17 April 2018; Published: 24 April 2018 Abstract:This study has focused on the PM emissions of diesel engines. Diesel engines are attractive power units that are used widely in many fields and have become one of the larger contributors of total petroleum consumption. However, diesel engines are among the main contributors of emissions into the air, especially particulate matter (PM) and nitrogen oxides (NOx). PM is one of the major pollutants emitted by diesel engines and has adverse effects on human health. Accordingly, many studies have been conducted to find alternative fuels that are clean and efficient. Biodiesel, which produces less PM than diesel fuel, is preferred as an alternative source for diesel engines. Therefore, using palm oil methyl ester (POME) for diesel engines would be a more economical and sustainable solution. This study has focused on the PM emissions of diesel engines fuelled by a diesel and POME blend (B5, B10, B20, and B100). A comparison between diesel and the POME blend has been made which involves PM mass concentration and its components (soluble organic fraction (SOF) and dry soot (DS)). Combustion characteristics, such as in-cylinder pressure and rate of heat release of the engine, as well as gaseous emissions, have also been observed at different operating engine loads (0.05 MPa 20%, 0.4 MPa 40%, and 0.7 MPa 60%). The results show that PM emissions of B100 are lower than those of diesel fuel owing to the oxygen content of POME. With regard to the SOF concentration, B100 has a higher SOF value than diesel fuel at all engine loads. Meanwhile, the DS for B100 is lower than that of diesel fuel. Moreover, as the engine load increased, PM and SOF concentrations increased, while DS concentration decreased. The observation of in-cylinder pressure showed that the increment of pressure with the increasing POME blend, as well as the increasing engine load due to the high cetane number for B100, led to a short ignition delay. The engine brake thermal efficiency between the POME blend and mineral diesel was comparable. Furthermore, B100 fuels showed lower engine power at higher brake-specific fuel consumption compared to other tested fuels. In terms of gaseous emissions, increasing POME blends led to an increase in NOx emissions. Meanwhile, as the engine load increased, NOx also continued to increase. The effect of the POME blend on the PM-NOx trade-off observation showed that B100 simultaneously increased the NOx and decreased the PM emissions. It can be concluded that POME creates a lower PM concentration while giving some negative feedback to NOx.
Keywords:particulate matter (PM); biodiesel; palm oil methyl ester (PME); diesel engine; NOx
Energies2018,11, 1039 2 of 25
1. Introduction
Owing to the significant growth of the population, transportation, and the basic industry sectors, the demand for fossil fuel continues to increase [1]. Its growth began as the Industrial Revolution took off in the 18th century, when vast quantities of fossil fuel were used to power the economy. However, based on the report, it is becoming a global problem as crude oil stock is depleting and its price is increasing. Therefore, significant environmental problems can be seen as the consumption of fossil fuel increases. Based on a British Petroleum (BP) Statistical Review of World Energy in June 2014, the global primary energy consumption in 2013 accelerated by approximately 2.3% over 2012 despite stagnant global economic growth. Moreover, the consumption and production of all fuels increased, reaching record levels for every fuel type except nuclear power. Global consumption rose more rapidly than the production of each type of fossil fuel. In 2013, the data suggests that growth in global carbon dioxide (CO2) emissions from energy use also accelerated, although it remained below average [2]. On the
other hand, global energy consumption will rise by 37% by 2040, whereas crude oil consumption is expected to rise from the current 90 million barrels a day to 104 million barrels a day. However, demand for oil will plateau by 2040 according to the International Energy Agency (IEA) in its latest World Energy Outlook released on 12 November 2014, in London. Interestingly, the report also stated that the global supply of crude oil, other liquid hydrocarbons, and biofuels is expected to be sufficient to meet world demand for liquid fuel for at least the next 25 years. However, there is substantial uncertainty about the levels of future liquid fuel supply and demand. After the oil crises in the 1970s and 1980s, much of the debate about world oil markets focused on the limitations of supply [3].
One of the main contributors to air pollution is the diesel engine. However, diesel engines are attractive power units used widely in many fields because of their great advantages over gasoline engines such as lower fuel consumption, lower carbon monoxide emissions, better torque characteristics, and higher reliability [4–9]. These characteristics make diesel engines the main contributor to total petroleum consumption. In contrast, owing to its lean-burning nature and high temperatures and pressures in the combustion process, diesel engines are the main contributors to air pollution for a large amount of emissions, especially particulates and nitrogen oxides (NOx). Thus, controlling these emissions is one of the most important aspects of modern air quality management.
Research has shown that diesel engines fuelled with palm oil could decrease the emissions produced in terms of smoke, PM, hydrocarbon, sulfur oxide, and carbon monoxide [10,11]. However, there are growing concerns surrounding the negative impact of PM emissions from diesel engines on human health and the environment. Moreover, since the great smog of 1952 in London, tremendous research on adverse health effects of air pollution have been recorded and have led to several changes in practices and regulations, including Clean Air Acts in most countries [12]. Thus, many scientists and policy-makers have worked together to solve the problems from different perspectives. The investigation has included the epidemiological and the toxicological effect of airborne pollutants. Diesel vehicles contribute significantly to the particulate air pollution problem, especially in metropolitan areas of developing Asian countries [13]. The size of the particle determines where it will deposit in the human respiratory tract when inhaled [14]. Moreover, Peng et al. reported that PM with a size of 10µm (PM10) can enter the lungs and cause health problems ranging from coughing and
wheezing, to asthma attacks and severe bronchitis, to high blood pressure and heart attacks. Similarly, PM that is 2.5µm (PM2.5) or smaller tends to penetrate the lungs, causing damage to the alveoli tissues
and resulting in coughing and other severe respiratory problems for individuals with asthma or heart diseases. Smaller particles with a diameter less than 100 nm may pass through the lungs and affect other vital organs such as the brain [15,16]. Many toxicological and epidemiological studies have reported that adverse health effects of PM (PM10, PM2.5) have been established [17]. There is significant evidence
of health effects associated with ultrafine particles with a diameter less than 100 nm [18], some of which can penetrate cell membranes, enter the blood, and even reach the brain [19].
Thus, reducing PM concentration in diesel exhaust gas has become crucial among industrial societies and researchers at universities [20,21]. On the other hand, it is important to investigate the
PM concentration of biodiesel and other alternative fuels, which is likely to have a different chemical composition [20,22]. Many researchers have reported that the main factor affecting PM emissions is the fuel oxygen content. However, some researchers have concluded that the differences depend on the chemical structure or volatility of a given oxygenate [23]. Diesel PM can be divided into two main components: dry soot or solid carbon material and volatile or soluble organic compound, commonly described as soluble organic fraction (SOF). According to the conceptual model by [24], PM can be divided into non-volatile—which is mainly generated in the engine—and volatile/soluble—which forms later in the exhaust. Generally, dry soot is highly agglomerated solid carbonaceous material and ash. The typical chemical formula is C8H, C9H, and C10H. Approximately 5–10% oxygen and
0.5% nitrogen by mass are also present. Dry soot results from several processes, such as pyrolysis, dehydrogenation, and condensation of fuel molecules. Meanwhile, SOF, which originates from fuel and oil hydrocarbons, can be extracted by a solvent such as dichloromethane. SOF comes from a tiny fraction of the fuel comprising atomized and evaporated lube oil that escapes oxidation and appears in the exhaust. The SOF contains polycyclic aromatic compounds containing oxygen, nitrogen, and sulfur [25].
Most of the sulfur in the fuel is oxidized to SO2. However, a small fraction is oxidized to SO3,
which leads to sulfuric acid and sulfates in the exhaust particles. In addition to SOF, sulfates originating from fuel sulfur, NO2, and water are also absorbed on the particle core to form soot. Typically, SOF has
an empirical formula of CH1.65O0.1N0.007. The concentration mass content of SOF varies depending
on engine design and operating conditions, and the range is mostly from 20 to 45%. SOF values are increased with light engine loads when the exhaust temperature is low.
According to National Biodiesel Board (NBB), biodiesel is the only alternative fuel to have fully completed the health effects testing requirements of the Clean Air Act [26]. Thus, the aim for using biodiesel is to reduce petroleum consumption and greenhouse gas effects [27,28]. However, there are many important advantages and disadvantages to using POME compared to diesel fuel. The real advantages are the greater cetane number for POME compared to diesel fuel because it is free of sulfur and aromatics. Furthermore, the absence of sulfur prevents sulfur poisoning of after-treatment systems and reduces corrosion. Moreover, the high viscosity and low energy content are the main disadvantages of biodiesel fuel. In addition, it has higher pour point and cloud points, limiting operation; lower oxidative stability, shortening storage life; and higher organic carbon emissions. In order to address these problems, many studies have focused on diesel-biodiesel blends [29].
Biodiesel fuel is well known to be biodegradable and nontoxic, and its use provides a reduction of many harmful exhaust emissions. A nearly complete absence of sulfur oxide (SOx) emissions, PM and soot, and reduced unburned hydrocarbon emissions can be achieved by using biodiesel [30]. Moreover, biodiesel contains substantially more energy than what is required for its production and also significantly reduces net carbon dioxide (CO2) emissions. However, using biodiesel blends
in unmodified engines typically emit higher levels of nitrogen oxides (NOx) [31]. Furthermore, the “biodiesel NOx and PM effect” continues to be a main subject of a great deal of scientific research in which a consensus for the reasons behind this increase has not yet been reached.
Buyukkaya investigated the performance, combustion, and emission trends of biodiesel from rapeseed oil and its blend. It was found that CO emissions of B5 and B100 were 9% and 32% lower than diesel fuel, respectively. The brake specific fuel consumption (BSFC) of biodiesel at maximum torque and rated power conditions were found to be 8.5% and 8% higher than that diesel fuel, respectively. The study also found that the combustion characteristics of biodiesel and its blends were quite similar to those of petroleum diesel [32]. Biodiesel also reduce PM, visible smoke, odor, and polyaromatic hydrocarbon emissions. Furthermore, biodiesel does not contain undesirable elements, such as sulfur, compared to petro-diesel, which may have sulfur content [33]. Numerous studies to investigate the effect of biodiesel fuel for diesel engines with different types of feedstock have been conducted worldwide. There are many potential feedstocks, which include various types of vegetable oils, as well as animal fats available to be used as biodiesel. The common sources for biodiesel currently under widespread
Energies2018,11, 1039 4 of 25
research by many researchers around the world are soybeans, sunflowers, jathropa [8,34–36], peanuts, rapeseed [37], palm [38], corn, canola [39], cottonseed, tallow [40], and waste cooking oil [41,42].
Moreover, a high cetane number generally results in a shorter ignition delay. The shorter ignition delay for B100 fuel results in a higher premixed peak pressure. In addition, an increase in fuel viscosity, specifically for petroleum-derived fuels, results in poor atomization, slower mixing, reduced cone, and increased penetration angle. These phenomena lead to longer ignition delay. However, biodiesel is not derived from crude petroleum, and the opposite trend is seen in the cases of biodiesel and its blends [43]. These results are in line with previous studies [44,45]. B100, or biodiesel fuel with a higher oxygenated nature content similar to other biodiesel blends compared to mineral diesel, results in complete burning of air-mixed fuel in the cylinder and increases the maximum cylinder pressure [45].
On the other hand, one possible explanation for the decrease in the production of PM is the oxygen content of biodiesel. Moreover, the oxygen content in the fuel helps increase the temperature and pressure inside the combustion chamber, thus reducing PM formation and enhancing PM oxidation during the diffusion stage of combustion [46]. This phenomenon can be interpreted as extending the combustion timing and causing a complete combustion reaction when using biodiesel, which could be a result of a higher combustion temperature that triggers PM concentration as well. Therefore, less PM in the exhaust gas can be achieved as the percentage of biodiesel blend increases. This effect has been illustrated in many papers, and it is believed that the high cetane number for B100 resulted in the lower PM concentration. Moreover, the reduction of PM with increased biodiesel in the fuel blend can be attributed to the decrease in carbon content and the increase of oxygen content in the blended fuel [47].
In term of SOF, it is increasingly produced in the exhaust gas as the percentage of biodiesel blend increases. This is due to the unburned or partially burned hydrocarbon emissions. These hydrocarbon emissions will condense and be absorbed on the PM surface, thus resulting in increased SOF, which is the main component of PM [48]. The higher SOF value of POME fuel is also due to its lower volatility compared to diesel fuel. However, the increased mass is mainly a result of unburned esters in the fuel itself. Since biodiesel is nontoxic, the increased SOF concentration may not be hazardous [49]. Moreover, the present study is in agreement with the research conducted by Lapuerta et al. [50], in which the SOF increased as the biodiesel percentage increased.
In summary, most researchers have reported a slight decrease in PM emissions for biodiesel. It is quite obvious that with biodiesel, owing to the improved combustion, the temperature in the combustion chamber can be expected to be higher, and a higher amount of oxygen is also present, which leads to the formation of less PM in POME-fuelled engines. In this study, a POME-fuelled engine plays an important role in terms of the performance, combustion, emission, and PM formation. Based on the fuel property results, engine performance, combustion, and emissions characteristics of the diesel engine, it is a critical indicators to determine the suitability of the fuel for engine operation to improve PM emissions. Thus, most of the studies on this subject indicate that the increase of biodiesel concentration in diesel engine operation affects PM formation. Controlling PM emissions requires the development of more efficient diesel engines and better fuel. In order to achieve this, a better understanding of the chemical and physical aspects of the diesel combustion process is needed. In this study, the performance (brake power, BSFC, and BTE), trade off PM-NOx emissions, PM components, and combustion characteristics of a diesel engine were investigated in engines with the same type of injection system and fuelled with mineral diesel, pure palm oil biodiesel (B100), and their B5, B10, B20 blends.
2. Methodology 2.1. Test Fuels
Two base fuels were used during the engine testing. The first fuel was mineral diesel procured from a commercial petrol station, and the second fuel was B100, which was palm diesel provided by
Mission Biotechnologies Sdn. Bhd (located at seksyen 19, 46300 Petaling Jaya, Selangor, Malaysia). All fuels provided by the respective companies complied with EN14214. During the experimental study, palm diesel blend fuels were labelled as BXX, where XX signifies the volumetric blending percentage of palm methyl ester content mixed with mineral diesel. Table1lists the fuel properties of the base fuels, including mineral diesel, B5, B10, B20, and B100. All the nomenclature is listed in Table2.
Table 1.Physiochemical properties of the tested mineral diesel, B5, B10, B20, and B100.
Properties Diesel B5 B10 B20 B100
Density (kg/m3) 837.0 854.7 855.3 858.8 879.9
Viscosity (mm2/s) 4.24 4.36 4.40 4.49 4.74
Heating Value (MJ/kg) 45.72 41.44 41.08 39.92 37.92
Cetane Number 46 47 48 50 57
Table 2.Specifications of the filter paper.
Name Filter Paper Specifications
Material Composite filter (PTFE coated)
Trademark ADVANTEC
Type PG-60
Size 47 mm2
Quantity 100 leaf
Lot Number 20919702
Manufacturer Toyo RoshiKaisya, Ltd. (Toyo, Japan) 2.2. PM Procedure
In order to analyses the PM concentration and its components, SOF and soot, gravimetric analysis was applied. The difference in mass of the filter paper before and after each test was determined In order to extract the soluble organic fraction (SOF) from the PM, dichloromethane was used as a solvent. Therefore, the total mass concentration of PM, SOF, and soot can be calculated as shown below [51]: (a) Particulate Matter (PM)
Mass of filter (before) =A (g)
Mass of filter (after) =B (g)
PM (C) =A−B (g)
PM (C/20 L)×1000 =D (g/m3)
(b) Soluble Organic Fraction (SOF)
Dichloromethane solution =E (g)
SOF (F) = B – E (g)
SOF (F/20 L)×1000 = G (g/m3)
(c) Soot
Soot (H) =D−G (g/m3)
The filter paper was placed in the filter holder to trap the PM from the exhaust tailpipe as illustrated in Table2. The filter paper used in this study was Advantec composite filter paper with a size of 47 mm. This filter paper was made of glass fibers covered with poly-tetra-fluoroethylene (PTFE). The moisture absorption was very low because the surface was coated with PTFE. Therefore, the measurement of PM concentration was not affected by humidity in the air. The absorption of gaseous acid, such as SOx or NOx, was very low because fluoropolymer was used as a binder. PM samples were collected at the exhaust pipe using a 50 cm length of stainless steel probe, which was
Energies2018,11, 1039 6 of 25
connected to a constant speed vacuum pump system. In each sampling, one new filter was used with a total of six filters used for each test fuels. Filters were weighted under controlled conditions. 2.3. Test Bed Configuration and Test Procedure
The experimental studies were primarily conducted using a Mitsubishi 4D68 diesel engine, which was naturally aspirated, water-cooled, and equipped with a distributor-type fuel injection system. Engine characteristics and specifications are given in Figure1and Table3, respectively.
Energies 2017, 10, x FOR PEER REVIEW 6 of 25
2.3. Test Bed Configuration and Test Procedure
The experimental studies were primarily conducted using a Mitsubishi 4D68 diesel engine, which was naturally aspirated, water-cooled, and equipped with a distributor-type fuel injection system. Engine characteristics and specifications are given in Figure 1 and Table 3, respectively.
Table 3. Technical specifications of the test engine.
Description Specification
Number of cylinders 4 in-line
Combustion chamber type Swirl chamber
Total displacement (dm3) 1.998
Cylinder bore (mm) 82.7
Piston stroke (mm) 93
Compression ratio 22.4
Maximum torque 177 Nm @ 2500 rpm
The intake valve opens (BTDC) 20°
The intake valve closes (ABDC) 48°
The exhaust valve opens (BBDC) 54°
The exhaust valve closes (ATDC) 22°
Cooling system Water cooled
Lubrication system Pressure feed, full flow filtration
Fuel system Mechanically control distributor type injection pump
Figure 1. Schematic diagram of the test cell for the experimental setup. Figure 1.Schematic diagram of the test cell for the experimental setup.
Table 3.Technical specifications of the test engine.
Description Specification
Number of cylinders 4 in-line
Combustion chamber type Swirl chamber
Total displacement (dm3) 1.998
Cylinder bore (mm) 82.7
Piston stroke (mm) 93
Compression ratio 22.4
Maximum torque 177 Nm @ 2500 rpm
The intake valve opens (BTDC) 20◦
The intake valve closes (ABDC) 48◦
The exhaust valve opens (BBDC) 54◦
The exhaust valve closes (ATDC) 22◦
Cooling system Water cooled
Lubrication system Pressure feed, full flow filtration
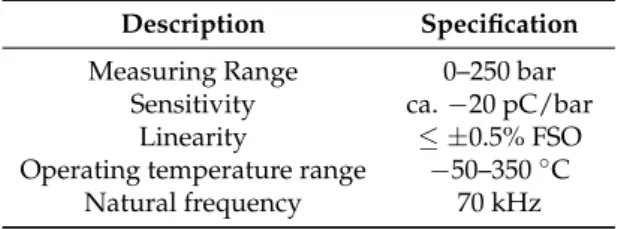
A 150 kW eddy-current dynamometer model ECB-200F SR No. 617 from Dynalec Controls was utilized to load the engine. This dynamometer was a water-cooled type. A Dynalec dynamometer controller with torque and speed indication was used to control the dynamometer system. The operating conditions of the engine and the dynamometer brake are characterized by the speed and torque. Engine combustion characteristics were determined and computed with the use of in-cylinder pressure measurement. By using a Kistler 6041A ThermoComp (Kistler USA, Kistler Instrument Corp., 75 John Glenn Drive, 14228-2171 Amherst, NY, USA) water-cooled piezoelectric transducer for pressure measurement, the in-cylinder pressure trace was instantaneously measured as depicted in Table4. This sensor was connected with a cable from Kistler Model 1929A1 (Kistler USA, Kistler Instrument Corp., 75 John Glenn Drive, 14228-2171 Amherst, NY, USA) to the charge module to convert the analogue signal into a digital signal. A DAQP-Charge B was consigned to condition the charge signals from the pressure transducer. The module was placed in a PC DEWE-800 (DEWETRON GmbH, Parkring 4, 8074 Grambach, Austria) containing an Orion 1624 DAQ card. The in-cylinder pressure transducer together with the charge module was calibrated according to the application in the DEWETRON hardware and displayed using DEWESoft software (DEWETRON GmbH, Parkring 4, 8074 Grambach, Austria). A crank angle encoder was used to specify the crankshaft position during the combustion process, with comparisons drawn to the differential cylinder pressures. A Kistler CAM type 2613B1 (Kistler USA, Kistler Instrument Corp., 75 John Glenn Drive, 14228-2171 Amherst, NY, USA) crank angle encoder was mounted in alignment with the pulley of the crank shaft at the side of the engine and connected via a 1.5 m long cable to the signal conditioner type 2613B2, which contained the signal conditioning electronic circuit that converted the encoder analogue signal into digital crank angle pulses. The engine was equipped with 19 units of thermocouple probes to measure the temperatures of the engine, exhaust gas, fuel tank, fuel line, cooling water at both intake and exit, and air intake. The locations of these thermocouples were strategically placed to ensure the accuracy of the measurements because these measurements were used for the combustion model and real-time monitoring to remain within testing constraints and engine limitations. A Kane gas analyzer was used to take the measurements of the exhaust flue gas constituents as illustrated in Table5. A Kane Automotive Model Kane 4-3 (Kane International Ltd, Kane House, 11 Bessemer Road, Welwyn Garden City, Hertfordshire, AL7 1GF, UK) was used in this study. Using an integrated fuel delivery system, the engine was equipped with test fuel as illustrated schematically in Figure1. The fuel system consisted of two stainless steel tanks with a 10 L capacity to store fuel and was labelled according to its content. In order to deliver the fuel from the fuel tanks to the engine fuel injection system, stainless steel tubing was used. The fuel supply was transferred to the desired fuel tank using ball-type valves that were connected to the fuel tubing. The AIC 3033 fuel flow meter was connected to the fuel tubing after the valves to measure the fuel consumption during the engine operation. The Meriam (model 50MY15-6F) air intake system from the Meriam Process Technologies, 10920 Madison Avenue, Cleveland, OH 44102, USA) was used to create a laminar intake air flow to the engine. The air intake was supplied from the air intake filter to the engine manifold through the assembly. The pressure drop across the air intake elements was measured with an airflow manometer.
Table 4.In-cylinder pressure transducer specifications.
Description Specification
Measuring Range 0–250 bar
Sensitivity ca.−20 pC/bar
Linearity ≤ ±0.5% FSO
Operating temperature range −50–350◦C
Energies2018,11, 1039 8 of 25
Table 5.Kane gas analyzer specifications.
Specification Description
Oxygen (O2) Specified Range 0–21% @±5% accuracy Carbon monoxide (CO) Specified Range 0–10% @±5% accuracy Carbon dioxide (CO2) Specified Range 0–16% @±5% accuracy Nitrogen oxides (NOx) Specified Range 0–5000 ppm @±5% accuracy (O2/NOx) measuring principle Electro-Chemical Cells
(CO/CO2) measuring principle NDIR bench
The engine was allowed to warm up before the experiments were conducted to ensure parameters were being analyzed at steady-state. After the conditions of the engine stabilized, the data was recorded. The test cycles were manually controlled using engine speeds and engine throttle positions as variable parameters. In the first test condition, the engine was operated with the test fuels at a 50% throttle position with engine speeds ranging from 1500 to 3500 rpm. Mineral diesel was scheduled to be the first fuel to be tested with the diesel engine, followed by B100 (palm-diesel), B20, B10, and B5.
For the second test condition, the test fuels were investigated with the engine operating at a constant speed of 2500 rpm with three different engine loads: 20%, 40%, and 60%. The time interval was 10 min from the engine load transition until completion of the final point. The sequence of test fuels for the second test condition followed that of the first test condition. The torque, fuel consumption, exhaust temperatures, relative humidity, ambient temperature, and cylinder pressure were measured and recorded instantaneously. For the start of both test operating conditions, the engine was idled for an average of 30 min to ensure that the engine operated at steady-state conditions and a constant engine cooling water temperature. Furthermore, the engine fuel tests were repeated five times for each fuel at the specified operating conditions to ensure accurate and reliable measurements. On the other hand, continuous cylinder pressure measurements were taken at 1000 consecutive cycles on average. 3. Results and Discussion
3.1. Analysis of Fuel Properties
Fuel density is a function of the chemical composition of the fuel. The density of blended fuel varies in the range of 837.0 to 879.9 kg/m3for B0 (diesel) and B100 (POME), respectively, as shown in Table1. Thus, it is obvious that increases in the density of the blended fuel are due to the increased biodiesel content in the blend mixture. According to Moraes et al., biodiesel and mineral diesel have very similar densities [52]. In contrast, Atabani et al. mentioned that the density of biodiesel is affected by the sources of raw material (feedstock) used in their production processes [53]. Moreover, as a comparison, the difference in density between mineral diesel (B0) and biodiesel (B100) is approximately 4.8%. From the analysis, the density of POME is the highest; the density of the blended fuels B5, B10, and B20 are 2.9%, 2.8%, 2.4% respectively, lower than that of B100 owing to the effect of blending with diesel.
The lubricity of oil or fuel is mainly related on kinematic viscosity. The viscosity of blended fuel varies in the range of 4.24–4.74 mm2/s for B0 (diesel) and B100 (POME), respectively, as shown in Table1. Thus, as the viscosity of the blend increases, the methyl ester amounts also increase in the fuel mixture. The viscosity of the blended fuel B100 is 4.74 mm2/s, which is higher than that of diesel fuel by 10.5%. From the analysis, the density of POME is the highest; accordingly, the viscosity of the blended fuels B5, B10, B20 are 8.0%, 7.2%, 5.3%, respectively, lower than that of B100 due to the effect of blending with diesel.
Previous studies concluded that fuel viscosity and lubricity play a crucial role in the lubrication of fuel injection systems, especially those utilizing rotary distributor injection pumps that fully rely on the fuel lubrication level in the high-pressure pumping mechanism. Fuel with lower viscosities contribute to the maximum fuel delivery reduction and engine power output decrease owing to injector and
pump leakage. Fuel viscosity also influences the atomization and spray characteristics within the combustion chamber. Smaller Sauter mean droplet diameters are affected by the lower fuel viscosities, leading to increased droplet surface area and influencing the evaporation characteristic duration.
Table1shows that a lower heating value (HV) is recorded for POME while mineral diesel fuel has the highest HV; the difference between the two is approximately 17.1%. The heating value of any fuel is the energy released per unit mass or per unit volume of the fuel when the fuel is completely burned. Thus, it is obvious that the HV decreases as the biodiesel fraction increases in the blend. This is due to the relative composition of the fuel, in which biodiesel has oxygen present in the structure, which is not a component of conventional diesel and results in a reduction in carbon and hydrogen content. By depending on the raw material source (biodiesel feedstock), biodiesel fuels have different HVs [54]. Typically, the HV of biodiesel is 9.4–17.1% lower than that of conventional diesel. The measured HVs of the blended fuels B5, B10, B20, and B100 are lower than that of the diesel fuel by 9.4%, 10.1%, 12.7%, and 17.1%, respectively, owing to the effect of blending with POME.
The prime indicator of the quality of diesel or biodiesel fuel is the cetane number or CN, which is related to the ignition delay time of a fuel upon injection into the combustion chamber. The calculated cetane number formula represents a means for directly estimating the ASTM cetane number of distillate fuels from API gravity and mid-boiling point [55]. A higher CN produces a shorter ignition delay duration, which results in an easy cold start and low idling noise. Conversely, when the ignition occurs late in the expansion process the result is an incomplete combustion, as well as power output reduction, fuel conversion inefficiency, and increased engine noise. The CN of blended fuel varies in the range of 46–57 for B0 (diesel) and B100 (POME), respectively, as shown in Table1. Thus, as the CN of the blend increases, the methyl ester amounts also increase in the fuel mixture. The CN of blended fuel B100 is 57, which is higher than that of diesel fuel by 19.3%. From the analysis, the CN of POME is the highest. The CNs of blended fuels B5, B10, and B20 are 17.5%, 15.8%, and 12.3%, respectively, lower than that of B100, owing to the effect of blending with diesel.
3.2. Analysis of Engine Performance
In this research, brake power can be calculated by using engine torque for each speed. Thus, a correction factor is considered according to SAE J1349—Engine Test Code for Diesel Engines [56]. Five types of fuel were used during the experiments: mineral diesel, B100, B5, B10, and B20. The engine was tested under the operating conditions of the first test. The maximum brake power produced by mineral diesel was observed at an engine speed of 2500 rpm. The effect of different blended fuels on brake power seems to be clear at a high blending ratio, which is higher than 11.5%, at 2500 rpm. This difference lies in the effect of the blending ratio on the engine power owing to the effect of two conflicting factors: the effect of blended fuel on reducing the fuel viscosity and the effect of blended fuel on reducing the fuel energy content. This difference was due to the higher viscosity (10.5%) and lower HV (17.1%) of B100 fuel compared to diesel fuel. The low viscosity at lower percentages of blended fuel will improve the blended fuel viscosity and, thus, enhance the droplet evaporation and improve the fuel combustion. The higher oxygen content in B100 leads to low peak brake power, which is in agreement with Sharon et al. [44].
Figure2presents the engine brake power at increasing engine speeds under a half load for mineral diesel, B5, B10, B20, and B100. Generally, the results show that brake power increased with increasing speed for all tested fuels. The maximum brake power was achieved at roughly 2500 rpm. The brake power available at each speed depended on the torque generated by the engine at the corresponding speeds. Moreover, from the tested fuels, mineral diesel had the maximum brake power at all engine speeds. The brake torques obtained in this test ranged from 50.77 Nm to 117.9 Nm with corresponding speeds from 1500 to 3500 rpm. It can be seen clearly from the figure that mineral diesel has higher brake power compared to other test fuels with a maximum brake power of 25.28 kW at 2500 rpm. The performance of POME is observed to not surpass the performance generated by mineral diesel. However, the performance of B5, B10, B20, and B100 were comparable to the mineral diesel in terms of
Energies2018,11, 1039 10 of 25
their thermal efficiencies, which were improved and shown to fuel the engine without any difficulty. This is concrete evidence that biodiesel fuel originating from organic sources can be a replacement for mineral diesel.
Energies 2017, 10, x FOR PEER REVIEW 10 of 25
the engine without any difficulty. This is concrete evidence that biodiesel fuel originating from organic sources can be a replacement for mineral diesel.
BSFC is described as the fuel flow rate per unit of power output. Most diesel engines have their own optimum speeds, which provide the minimal BSFC at the minimal usage. BSFC can also be used to measure engine efficiency through the usage of fuel. Moreover, BSFC is a key to evaluate engine performance using several fuels by calculating the brake power and mass flow rate of the fuel for each test speed. Generally, if the engine speed is higher or lower than the optimum speed, it will result in a larger BSFC because the initial engine speed requires more fuel to overcome the mechanical friction, whereas at higher engine speeds, the heat losses are greater, resulting in higher fuel consumption [57]. From the results obtained, mineral diesel had the lowest BSFC over all engine speeds, which was observed at 2500 rpm. This is approximately 5.1% lower than B100 fuel at the same engine speed. This difference was due to higher the HV (20.5%) of mineral diesel fuel compared to B100. Thus, to maintain the brake power output, the BSFC of B100 must be increased in order to compensate for the lower energy content in the fuel.
Figure 2. Engine brake power at increasing engine speeds.
The variations of BSFC are depicted in Figure 3 for mineral diesel, B5, B10, B20, and B100 at zero engine loads. It shows that the BSFC for B5, B10, B20, and B100 are comparable, but slightly higher, than that of mineral diesel. The increase of BSFC is understandable because of the lower HVs of pure B100 compared to mineral diesel. Most studies have found that biodiesel with lower HVs powering light-duty and heavy-duty engines caused significant increases in BSFC [58,59]. Thus, more fuel must be injected to attain a comparable power output to mineral diesel when operating with biodiesel fuels and their lower HVs. It is clearly observed that HV and the engine speed play a significant role in the increase or decrease of BSFC.
Brake thermal efficiency (BTE) is an indicator of how well an engine operates with the test fuels. Thus, different BTEs affect the ratio of thermal power inside the fuel to the power the engine delivers to the crankshaft. Different properties in test fuels have a significant effect on the BTE of the engine and, thus, lead to better combustion and lower emissions. Since fuel HV is used in thermal efficiency, it depends on how the energy is converted. BTE calculations are determined based on the calculated brake power and measured energy content at a certain speed with a tested fuel. Generally, as engine speed increases to 2500 rpm, BTE increases. In the tested fuels, the BTE of B100 was 12.79% higher than that of mineral diesel fuel at 2500 rpm. The high oxygen content of B100 compared to mineral diesel enhances the combustion process. A previous study found that increasing the biodiesel in fuel blends improved the BTE in diesel engines [32]. However, by increasing the engine speed higher than 2500 rpm, the BTE decreased for all tested fuels. This was due to insufficient air, which caused incomplete combustion [32].
15
17
19
21
23
25
27
1000
1500
2000
2500
3000
3500
4000
E
n
gi
ne
b
ra
ke
p
ow
er
, k
W
Engine speed, rpm
Diesel B5 B10 B20 B100Figure 2.Engine brake power at increasing engine speeds.
BSFC is described as the fuel flow rate per unit of power output. Most diesel engines have their own optimum speeds, which provide the minimal BSFC at the minimal usage. BSFC can also be used to measure engine efficiency through the usage of fuel. Moreover, BSFC is a key to evaluate engine performance using several fuels by calculating the brake power and mass flow rate of the fuel for each test speed. Generally, if the engine speed is higher or lower than the optimum speed, it will result in a larger BSFC because the initial engine speed requires more fuel to overcome the mechanical friction, whereas at higher engine speeds, the heat losses are greater, resulting in higher fuel consumption [57]. From the results obtained, mineral diesel had the lowest BSFC over all engine speeds, which was observed at 2500 rpm. This is approximately 5.1% lower than B100 fuel at the same engine speed. This difference was due to higher the HV (20.5%) of mineral diesel fuel compared to B100. Thus, to maintain the brake power output, the BSFC of B100 must be increased in order to compensate for the lower energy content in the fuel.
The variations of BSFC are depicted in Figure3for mineral diesel, B5, B10, B20, and B100 at zero engine loads. It shows that the BSFC for B5, B10, B20, and B100 are comparable, but slightly higher, than that of mineral diesel. The increase of BSFC is understandable because of the lower HVs of pure B100 compared to mineral diesel. Most studies have found that biodiesel with lower HVs powering light-duty and heavy-duty engines caused significant increases in BSFC [58,59]. Thus, more fuel must be injected to attain a comparable power output to mineral diesel when operating with biodiesel fuels and their lower HVs. It is clearly observed that HV and the engine speed play a significant role in the increase or decrease of BSFC.
Brake thermal efficiency (BTE) is an indicator of how well an engine operates with the test fuels. Thus, different BTEs affect the ratio of thermal power inside the fuel to the power the engine delivers to the crankshaft. Different properties in test fuels have a significant effect on the BTE of the engine and, thus, lead to better combustion and lower emissions. Since fuel HV is used in thermal efficiency, it depends on how the energy is converted. BTE calculations are determined based on the calculated brake power and measured energy content at a certain speed with a tested fuel. Generally, as engine speed increases to 2500 rpm, BTE increases. In the tested fuels, the BTE of B100 was 12.79% higher than that of mineral diesel fuel at 2500 rpm. The high oxygen content of B100 compared to mineral diesel enhances the combustion process. A previous study found that increasing the biodiesel in fuel blends improved the BTE in diesel engines [32]. However, by increasing the engine speed higher
than 2500 rpm, the BTE decreased for all tested fuels. This was due to insufficient air, which caused incomplete combustion [Energies 2017, 10, x FOR PEER REVIEW 32]. 11 of 25
Figure 3. Brake-specific fuel consumption (BSFC) for increasing speeds.
Figure 4 presents the variation of BTE. BTE is an indicator of how well an engine operates with the test fuels. Thus, different BTEs affect the ratio of thermal power inside the fuel to the power the engine delivers to the crankshaft. Different properties in test fuels have a significant effect on the BTE of the engine and, thus, lead to better combustion and lower emissions. Since fuel HV is used in thermal efficiency, it depends on how the energy is converted. BTE calculations are determined based on the calculated brake power and measured energy content at a certain speed with a tested fuel. Generally, as engine speed increases to 2500 rpm, BTE increases. Increasing engine speeds increase the BTE up to 2500 rpm but decrease the BTE beyond 2500 rpm. Mineral diesel has a lower BTE, owing to its lower combustion efficiency. More oxygenated fuels—including B5, B10, B20, and B100— had better BTE than mineral diesel in all test modes at engine speeds up to 3500 rpm. From the graph, B5 exhibited comparable BTE results to B10 for all tested engine speeds. The variation of BTE is understood to be caused by the oxygenation of B100 and other blends, which improves the combustion in the engine and increases the BTE significantly. Moreover, the use of biodiesel fuel helps extend the ignition delay, which causes a larger amount of fuel to be burned in the premixed mode, which could increase the BTE. Furthermore, the performance of B5, B10, and B20 was comparable to B100, thus proving that biodiesel can improve the BTE of diesel engines without any engine modifications.
Figure 4. Brake thermal efficiencies (BTE) relative to increasing speeds.
300
320
340
360
380
400
420
1000
1500
2000
2500
3000
3500
4000
BS FC , g /k W .h r Engine speed, rpm Diesel B5 B10 B20 B10015
17
19
21
23
25
27
29
1000
1500
2000
2500
3000
3500
4000
BT E, % Engine speed, rpmDiesel
B5
B10
B20
B100
Figure 3.Brake-specific fuel consumption (BSFC) for increasing speeds.
Figure4presents the variation of BTE. BTE is an indicator of how well an engine operates with the test fuels. Thus, different BTEs affect the ratio of thermal power inside the fuel to the power the engine delivers to the crankshaft. Different properties in test fuels have a significant effect on the BTE of the engine and, thus, lead to better combustion and lower emissions. Since fuel HV is used in thermal efficiency, it depends on how the energy is converted. BTE calculations are determined based on the calculated brake power and measured energy content at a certain speed with a tested fuel. Generally, as engine speed increases to 2500 rpm, BTE increases. Increasing engine speeds increase the BTE up to 2500 rpm but decrease the BTE beyond 2500 rpm. Mineral diesel has a lower BTE, owing to its lower combustion efficiency. More oxygenated fuels—including B5, B10, B20, and B100—had better BTE than mineral diesel in all test modes at engine speeds up to 3500 rpm. From the graph, B5 exhibited comparable BTE results to B10 for all tested engine speeds. The variation of BTE is understood to be caused by the oxygenation of B100 and other blends, which improves the combustion in the engine and increases the BTE significantly. Moreover, the use of biodiesel fuel helps extend the ignition delay, which causes a larger amount of fuel to be burned in the premixed mode, which could increase the BTE. Furthermore, the performance of B5, B10, and B20 was comparable to B100, thus proving that biodiesel can improve the BTE of diesel engines without any engine modifications.
Energies 2017, 10, x FOR PEER REVIEW 11 of 25
Figure 3. Brake-specific fuel consumption (BSFC) for increasing speeds.
Figure 4 presents the variation of BTE. BTE is an indicator of how well an engine operates with the test fuels. Thus, different BTEs affect the ratio of thermal power inside the fuel to the power the engine delivers to the crankshaft. Different properties in test fuels have a significant effect on the BTE of the engine and, thus, lead to better combustion and lower emissions. Since fuel HV is used in thermal efficiency, it depends on how the energy is converted. BTE calculations are determined based on the calculated brake power and measured energy content at a certain speed with a tested fuel. Generally, as engine speed increases to 2500 rpm, BTE increases. Increasing engine speeds increase the BTE up to 2500 rpm but decrease the BTE beyond 2500 rpm. Mineral diesel has a lower BTE, owing to its lower combustion efficiency. More oxygenated fuels—including B5, B10, B20, and B100— had better BTE than mineral diesel in all test modes at engine speeds up to 3500 rpm. From the graph, B5 exhibited comparable BTE results to B10 for all tested engine speeds. The variation of BTE is understood to be caused by the oxygenation of B100 and other blends, which improves the combustion in the engine and increases the BTE significantly. Moreover, the use of biodiesel fuel helps extend the ignition delay, which causes a larger amount of fuel to be burned in the premixed mode, which could increase the BTE. Furthermore, the performance of B5, B10, and B20 was comparable to B100, thus proving that biodiesel can improve the BTE of diesel engines without any engine modifications.
Figure 4. Brake thermal efficiencies (BTE) relative to increasing speeds.
300
320
340
360
380
400
420
1000
1500
2000
2500
3000
3500
4000
BS FC , g /k W .h rEngine speed, rpm
Diesel B5 B10 B20 B10015
17
19
21
23
25
27
29
1000
1500
2000
2500
3000
3500
4000
BT
E,
%
Engine speed, rpm
Diesel
B5
B10
B20
B100
Energies2018,11, 1039 12 of 25
3.3. Experimental Analysis of Fuel Combustion
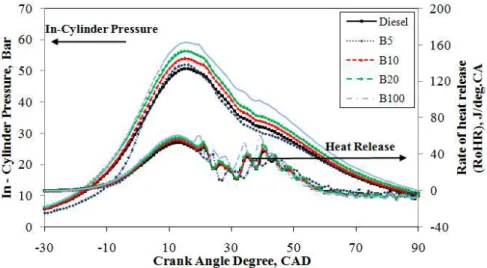
Figure5depicts the traces of the in-cylinder pressure curves averaged from 1000 consecutive cycles of mineral diesel, B5, B10, B20, and B100 against the crank angle with an engine load of 20% at 2500 rpm. Under the same engine operating conditions, it is obvious that the in-cylinder pressure traces are identical for the compression and expansion strokes. However, in the combustion stroke, it is slightly different. It can be seen from the figure that, under the same operating conditions, the peak in-cylinder pressure of mineral diesel reached 48.7 bar at 15◦ATDC whereas B100 achieved 56.3 bar at 15◦ ATDC. Thus, the increase of peak pressure is due to the high oxygen content and CN in B100 fuel; the peak pressure was approximately 13.5% higher than that of mineral diesel fuel. A higher CN generally results in a shorter ignition delay. The shorter ignition delay of the B100 fuel results in a higher premixed peak pressure. Moreover, an increase in fuel viscosity, specifically for petroleum-derived fuels, results in poor atomization, slower mixing, reduced cone, and increased penetration angle. These phenomena lead to longer ignition delays. However, biodiesel is not derived from crude petroleum, and the opposite trend is seen in the case of biodiesel and its blends [43]. These results are consistent with previous studies [44,45]. The peak in-cylinder pressure curves of B5, B10, and B20 blends are comparable to those of mineral diesel. Moreover, the enriched oxygen content in the fuels increases the pressure as well as the cylinder temperature after the combustion and along the expansion stroke.
Energies 2017, 10, x FOR PEER REVIEW 12 of 25
3.3. Experimental Analysis of Fuel Combustion
Figure 5 depicts the traces of the in-cylinder pressure curves averaged from 1000 consecutive cycles of mineral diesel, B5, B10, B20, and B100 against the crank angle with an engine load of 20% at 2500 rpm. Under the same engine operating conditions, it is obvious that the in-cylinder pressure traces are identical for the compression and expansion strokes. However, in the combustion stroke, it is slightly different. It can be seen from the figure that, under the same operating conditions, the peak in-cylinder pressure of mineral diesel reached 48.7 bar at 15° ATDC whereas B100 achieved 56.3 bar at 15° ATDC. Thus, the increase of peak pressure is due to the high oxygen content and CN in B100 fuel; the peak pressure was approximately 13.5% higher than that of mineral diesel fuel. A higher CN generally results in a shorter ignition delay. The shorter ignition delay of the B100 fuel results in a higher premixed peak pressure. Moreover, an increase in fuel viscosity, specifically for petroleum-derived fuels, results in poor atomization, slower mixing, reduced cone, and increased penetration angle. These phenomena lead to longer ignition delays. However, biodiesel is not derived from crude petroleum, and the opposite trend is seen in the case of biodiesel and its blends [43]. These results are consistent with previous studies [44,45]. The peak in-cylinder pressure curves of B5, B10, and B20 blends are comparable to those of mineral diesel. Moreover, the enriched oxygen content in the fuels increases the pressure as well as the cylinder temperature after the combustion and along the expansion stroke.
Figure 5. In-cylinder pressure and heat release curve under engine load of 20% at 2500 rpm.
The first law of thermodynamics was applied to the closed part of the engine cycle to compute the net rate of heat release figures from the measured in-cylinder pressure. Heat release refers to the amount of heat needed to be added to the cylinder in order to produce the pressure variation. The net rate of heat release is used to characterize the combustion for the used engine. Heat release analysis computes the heat that must be added to the cylinder contents in order to produce the observed pressure variations. The value of heat release is useful to investigate the combustion characteristics of diesel engines and as an indicator of the fuel usage. This related considerably to the sensible enthalpy corresponding per unit time resulting from the conversion of the chemical energy of a fuel to heat in a combustion duration. The start of combustion (SOC) is defined as the start of the heat release, and the end of combustion (EOC) is defined as at the degree of crank angle at which the heat release rate exceeds 95% of the total heat release [60]. The time interval from the SOC to the EOC along the crank angle degrees can be defined as the combustion duration. The basis of the heat release rate calculation was found by Krieger and Borman [61]. Extended work on the calculation of heat release rates has being investigated by many researchers. Since fuel vaporization begins during the ignition delay, a negative heat release rate is observed at the beginning, before the start of combustion, at which point the heat release rate becomes positive. The ignition time is the beginning
Figure 5.In-cylinder pressure and heat release curve under engine load of 20% at 2500 rpm.
The first law of thermodynamics was applied to the closed part of the engine cycle to compute the net rate of heat release figures from the measured in-cylinder pressure. Heat release refers to the amount of heat needed to be added to the cylinder in order to produce the pressure variation. The net rate of heat release is used to characterize the combustion for the used engine. Heat release analysis computes the heat that must be added to the cylinder contents in order to produce the observed pressure variations. The value of heat release is useful to investigate the combustion characteristics of diesel engines and as an indicator of the fuel usage. This related considerably to the sensible enthalpy corresponding per unit time resulting from the conversion of the chemical energy of a fuel to heat in a combustion duration. The start of combustion (SOC) is defined as the start of the heat release, and the end of combustion (EOC) is defined as at the degree of crank angle at which the heat release rate exceeds 95% of the total heat release [60]. The time interval from the SOC to the EOC along the crank angle degrees can be defined as the combustion duration. The basis of the heat release rate calculation was found by Krieger and Borman [61]. Extended work on the calculation of heat release
rates has being investigated by many researchers. Since fuel vaporization begins during the ignition delay, a negative heat release rate is observed at the beginning, before the start of combustion, at which point the heat release rate becomes positive. The ignition time is the beginning of the heat release during combustion. The time interval from the beginning of the heat release to the end of the heat release can be called the total combustion duration.
The averaged heat release rate over 1000 consecutive cycles for the test fuels are compared in Figure5under an engine load of 20% at 2500 rpm. It can be seen that under the same operating conditions, the heat release rates for the test fuels are identical during the compression and expansion strokes. The combustion process consists of a premixed combustion phase followed by a diffusion combustion phase. In the diffusion combustion phase, there is a significant difference in the rate of heat release. It can be found that the rate of heat release in the diffusion combustion phase increased from 50.4 J/deg.CA at 13◦ATDC for mineral diesel fuel to 57.6 J/deg.CA at 12◦ATDC for B100 fuel owing to the higher oxygen content of B100 fuel [44]. However, B10 and B20 exhibit the maximum heat release rate of 53.9 J/deg.CA at 13◦ATDC and 55.0 J/deg.CA at the same ATDC angle. For B5 blended fuel, the rate of heat release increases and reaches 52.2 J/deg.CA at 16◦ATDC, which is farther away from TDC compared to mineral diesel. This is because the higher oxygen content has improved the diffusion combustion phase and decreased the combustion duration.
The averaged in-cylinder pressure trace curves over 1000 consecutive cycles for the test fuels are compared in Figure6at a constant speed of 2500 rpm under an engine load of 40%. The in-cylinder pressure traces are identical for the compression and expansion strokes. However, in the combustion stroke, it is slightly different. The peak in-cylinder pressure increased as the engine load increased for all tested fuels. It can be seen clearly from the figure that mineral diesel and B100 reached their maximum cylinder pressures at 15◦ATDC with 50.5 bar and 59.0 bar, respectively, a difference of 14.4%. An improvement in complete combustion was achieved by the higher oxygen content in B100 compared to that of mineral diesel. Moreover, the peak pressure increased compared to the diesel fuel at 15◦ATDC for all blended fuels. Furthermore, the peak pressures of B5, B10, and B20 were 2.7%, 6.3%, and 10.1%, respectively, higher than that of mineral diesel fuel. This shows that the presence of biodiesel with the mineral diesel helps increase the maximum cylinder pressure during combustion and increases the power stroke significantly.
Energies 2017, 10, x FOR PEER REVIEW 13 of 25
of the heat release during combustion. The time interval from the beginning of the heat release to the end of the heat release can be called the total combustion duration.
The averaged heat release rate over 1000 consecutive cycles for the test fuels are compared in Figure 5 under an engine load of 20% at 2500 rpm. It can be seen that under the same operating conditions, the heat release rates for the test fuels are identical during the compression and expansion strokes. The combustion process consists of a premixed combustion phase followed by a diffusion combustion phase. In the diffusion combustion phase, there is a significant difference in the rate of heat release. It can be found that the rate of heat release in the diffusion combustion phase increased from 50.4 J/deg.CA at 13° ATDC for mineral diesel fuel to 57.6 J/deg.CA at 12° ATDC for B100 fuel owing to the higher oxygen content of B100 fuel [44]. However, B10 and B20 exhibit the maximum heat release rate of 53.9 J/deg.CA at 13° ATDC and 55.0 J/deg.CA at the same ATDC angle. For B5 blended fuel, the rate of heat release increases and reaches 52.2 J/deg.CA at 16° ATDC, which is farther away from TDC compared to mineral diesel. This is because the higher oxygen content has improved the diffusion combustion phase and decreased the combustion duration.
The averaged in-cylinder pressure trace curves over 1000 consecutive cycles for the test fuels are compared in Figure 6 at a constant speed of 2500 rpm under an engine load of 40%. The in-cylinder pressure traces are identical for the compression and expansion strokes. However, in the combustion stroke, it is slightly different. The peak in-cylinder pressure increased as the engine load increased for all tested fuels. It can be seen clearly from the figure that mineral diesel and B100 reached their maximum cylinder pressures at 15° ATDC with 50.5 bar and 59.0 bar, respectively, a difference of 14.4%. An improvement in complete combustion was achieved by the higher oxygen content in B100 compared to that of mineral diesel. Moreover, the peak pressure increased compared to the diesel fuel at 15° ATDC for all blended fuels. Furthermore, the peak pressures of B5, B10, and B20 were 2.7%, 6.3%, and 10.1%, respectively, higher than that of mineral diesel fuel. This shows that the presence of biodiesel with the mineral diesel helps increase the maximum cylinder pressure during combustion and increases the power stroke significantly.
Figure 6. In-cylinder pressure and heat release curve under engine load of 40% at 2500 rpm.
The rate of heat release against the crank angle for all test fuels under an engine load of 40% is presented in Figure 6. It can be seen from the figure that there is a significant increase in the rate of heat release for the test fuels when the engine load changes from 20% to 40%. The maximum rate of heat release for B100 is 60.5 J/deg.CA at 13° ATDC, which is higher than that of the other test fuels. The heat release rate of mineral diesel under the same operating conditions was 50.9 J/deg.CA at 15° ATDC. However, there was a significant ignition delay and a shorter combustion duration for B100 compared to mineral diesel. This is because, with a higher density and viscosity, B100 fuel vaporizes more slowly compared to mineral diesel, resulting in less air-fuel mixture for the combustion.
Figure 6.In-cylinder pressure and heat release curve under engine load of 40% at 2500 rpm.
The rate of heat release against the crank angle for all test fuels under an engine load of 40% is presented in Figure6. It can be seen from the figure that there is a significant increase in the rate of heat release for the test fuels when the engine load changes from 20% to 40%. The maximum rate of heat release for B100 is 60.5 J/deg.CA at 13◦ATDC, which is higher than that of the other test fuels. The heat
Energies2018,11, 1039 14 of 25
release rate of mineral diesel under the same operating conditions was 50.9 J/deg.CA at 15◦ATDC. However, there was a significant ignition delay and a shorter combustion duration for B100 compared to mineral diesel. This is because, with a higher density and viscosity, B100 fuel vaporizes more slowly compared to mineral diesel, resulting in less air-fuel mixture for the combustion. Moreover, a 7.3%, 5.7%, and 9.8% increase in the maximum rate of heat release for B5, B10, and B20, respectively, under a medium engine load compared to mineral diesel fuel is reasonable. This is because an increase in engine load results in increased cylinder pressure. Compared to mineral diesel, there is a significant influence by the maximum heat release rate of B100 fuel on the cylinder pressure.
Figure7demonstrates the in-cylinder pressure trace curves of the diesel engine corresponding to the crank angle operated with mineral diesel, B5, B10, B20, and B100 at 2500 rpm under an engine load of 60%. It is observed that the in-cylinder pressure traces are identical in the compression and expansion strokes. However, in the combustion stroke, it is slightly different. The maximum peak in-cylinder pressure for B100 is observed to reach 66.1 bar at 15◦ATDC whereas for the mineral diesel the peak in-cylinder pressure reaches 56.1 bar at 15 CAD, which is 15.1% lower compared to the B100 fuel. For B5, B10, and B20, the test fuels reached the maximum cylinder pressures of 59.0 bar, 60.4 bar, and 63.5 bar at 18◦ATDC, 15◦ATDC, and 15◦ATDC, respectively. It can be concluded that biodiesel blends cause a significant increase in maximum cylinder pressure. An increase in the cylinder pressure curve results in an increase in the cylinder temperature. These results prove that B100—or biodiesel fuel with a high oxygen content similar to other biodiesel blends compared to mineral diesel—results in complete burning of air-mixed fuel in the cylinder and increases the maximum cylinder pressure [45]. It can be concluded from the overall results that there is an increase in the maximum cylinder pressure with an increase in engine load at 20%, 40%, and 60%. Furthermore, B100 produces a higher maximum cylinder pressure curve compared to other test fuels with an increase in engine load. Moreover, the biodiesel-diesel blend fuels B5, B10, and B20 exhibit higher maximum cylinder pressure compared to mineral diesel with an increase in engine load. Higher oxygen content in the biodiesel is among the major factors that contribute to the increase in maximum cylinder pressure [44].
Energies 2017, 10, x FOR PEER REVIEW 14 of 25
Moreover, a 7.3%, 5.7%, and 9.8% increase in the maximum rate of heat release for B5, B10, and B20, respectively, under a medium engine load compared to mineral diesel fuel is reasonable. This is because an increase in engine load results in increased cylinder pressure. Compared to mineral diesel, there is a significant influence by the maximum heat release rate of B100 fuel on the cylinder pressure. Figure 7 demonstrates the in-cylinder pressure trace curves of the diesel engine corresponding to the crank angle operated with mineral diesel, B5, B10, B20, and B100 at 2500 rpm under an engine load of 60%. It is observed that the in-cylinder pressure traces are identical in the compression and expansion strokes. However, in the combustion stroke, it is slightly different. The maximum peak in-cylinder pressure for B100 is observed to reach 66.1 bar at 15° ATDC whereas for the mineral diesel the peak in-cylinder pressure reaches 56.1 bar at 15 CAD, which is 15.1% lower compared to the B100 fuel. For B5, B10, and B20, the test fuels reached the maximum cylinder pressures of 59.0 bar, 60.4 bar, and 63.5 bar at 18° ATDC, 15° ATDC, and 15° ATDC, respectively. It can be concluded that biodiesel blends cause a significant increase in maximum cylinder pressure. An increase in the cylinder pressure curve results in an increase in the cylinder temperature. These results prove that B100—or biodiesel fuel with a high oxygen content similar to other biodiesel blends compared to mineral diesel—results in complete burning of air-mixed fuel in the cylinder and increases the maximum cylinder pressure [45]. It can be concluded from the overall results that there is an increase in the maximum cylinder pressure with an increase in engine load at 20%, 40%, and 60%. Furthermore, B100 produces a higher maximum cylinder pressure curve compared to other test fuels with an increase in engine load. Moreover, the biodiesel-diesel blend fuels B5, B10, and B20 exhibit higher maximum cylinder pressure compared to mineral diesel with an increase in engine load. Higher oxygen content in the biodiesel is among the major factors that contribute to the increase in maximum cylinder pressure [44].
Figure 7. In-cylinder pressure and heat release curve under an engine load of 60% at 2500 rpm. Figure 7 illustrates the averaged maximum rate of heat release over 1000 cycles relative to the crank angle for mineral diesel, B5, B10, B20, and B100 at a high engine load of 60% with a constant engine speed of 2500 rpm. It can be seen that the increase in engine load increases the rate of heat release for all test fuels. With regard to B100, the maximum rate of heat release is 67.7 J/deg.CA at 12° ATDC, and the diffusion combustion phase is higher than that of mineral diesel, which is 58.1 J/deg.CA at 13° ATDC, owing to the increases in the reaction zone pressure, as well as temperature. Compared to mineral diesel, B100 achieves an earlier start of the combustion and shorter combustion duration owing to its oxygen content, which burns rapidly during combustion. The increase in rate of heat release for B5, B10, B20, and B100 under a high engine load is understandable given their higher oxygen content. Therefore, the start of combustion is delayed, which causes more fuel to be combusted, resulting in a higher maximum cylinder temperature. It can be concluded from the results
Figure 7.In-cylinder pressure and heat release curve under an engine load of 60% at 2500 rpm.
Figure7illustrates the averaged maximum rate of heat release over 1000 cycles relative to the crank angle for mineral diesel, B5, B10, B20, and B100 at a high engine load of 60% with a constant engine speed of 2500 rpm. It can be seen that the increase in engine load increases the rate of heat release for all test fuels. With regard to B100, the maximum rate of heat release is 67.7 J/deg.CA at 12◦ ATDC, and the diffusion combustion phase is higher than that of mineral diesel, which is 58.1 J/deg.CA at 13◦ATDC, owing to the increases in the reaction zone pressure, as well as temperature. Compared to mineral diesel, B100 achieves an earlier start of the combustion and shorter combustion duration
owing to its oxygen content, which burns rapidly during combustion. The increase in rate of heat release for B5, B10, B20, and B100 under a high engine load is understandable given their higher oxygen content. Therefore, the start of combustion is delayed, which causes more fuel to be combusted, resulting in a higher maximum cylinder temperature. It can be concluded from the results that the maximum rate of heat release for the test fuels increases with the increase in engine load. Moreover, the diffusion combustion phase for mineral diesel is longer than that of B5, B10, B20, and B100. This is because the higher CN for biodiesel results in a decreased ignition delay and higher fuel consumption for combustion after the start of ignition.
Additionally, observation of exhaust temperature in this study is important because it is an indication of the amount of energy released during combustion [62]. The exhaust temperature of the diesel fuel and POME blend was measured at different blends and engine loads. All fuel blends under all engine loads had significantly different exhaust temperatures from diesel fuel. Figure8depicts the variation of exhaust temperature for the fuels blends under different engine loads. As depicted, at every engine load—20%, 40%, and 60%—B100 recorded the highest exhaust temperature among the tested fuels at 239◦C, 446◦C, and 641◦C, respectively. Moreover, as the load increases, a sharp slope in the exhaust temperature can be seen clearly in Figure8. This indicates that higher loads produce high temperatures and, thus, affect the performance of the engine, as well as the PM components.
Energies 2017, 10, x FOR PEER REVIEW 15 of 25
that the maximum rate of heat release for the test fuels increases with the increase in engine load. Moreover, the diffusion combustion phase for mineral diesel is longer than that of B5, B10, B20, and B100. This is because the higher CN for biodiesel results in a decreased ignition delay and higher fuel consumption for combustion after the start of ignition.
Additionally, observation of exhaust temperature in this study is important because it is an indication of the amount of energy released during combustion [62]. The exhaust temperature of the diesel fuel and POME blend was measured at different blends and engine loads. All fuel blends under all engine loads had significantly different exhaust temperatures from diesel fuel. Figure 8 depicts the variation of exhaust temperature for the fuels blends under different engine loads. As depicted, at every engine load—20%, 40%, and 60%—B100 recorded the highest exhaust temperature among the tested fuels at 239 °C, 446 °C, and 641 °C, respectively. Moreover, as the load increases, a sharp slope in the exhaust temperature can be seen clearly in Figure 8. This indicates that higher loads produce high temperatures and, thus, affect the performance of the engine, as well as the PM components.
Figure 8. Variation of exhaust temperature with different fuels under all engine loads.
Under an engine load of 20%, the exhaust temperatures of B5, B10, B20, and B100 were 4.1%, 6.7%, 12.4%, and 23.8%, respectively, higher than that of mineral diesel fuel. This is because of oxygen content, which contributed to complete combustion, thus improving the diffusion combustion rate. As a result, the in-cylinder pressure increased as discussed earlier. As the engine load increased to 40%, the exhaust temperatures of B5, B10, B20, and B100 were 2.1%, 3.6%, 6.9%, and 14.7%, respectively, higher than that of mineral diesel fuel. Moreover, as the engine load increased, the exhaust temperature continued to increase. This is due to the oxygen content, which contributed to complete combustion, thus improving the diffusion combustion rate. As a result, the in-cylinder pressure increased as discussed earlier. Moreover, at the engine load of 60%, the exhaust temperatures of B5, B10, B20, and B100 were 1.0%, 3.0%, 5.2%, and 7.7%, respectively, higher than that of mineral diesel fuel. As the engine load increased, the exhaust temperature continued to increase. This is due to the oxygen content, which contributed to complete combustion, thus improving the diffusion combustion rate. As a result, the in-cylinder pressure increased as discussed earlier. High engine load results in increasing exhaust temperature, owing to the rising in-cylinder pressure.
Figure 8.Variation of exhaust temperature with different fuels under all engine loads.
Under an engine load of 20%, the exhaust temperatures of B5, B10, B20, and B100 were 4.1%, 6.7%, 12.4%, and 23.8%, respectively, higher than that of mineral diesel fuel. This is because of oxygen content, which contributed to complete combustion, thus improving the diffusion combustion rate. As a result, the in-cylinder pressure increased as discussed earlier. As the engine load increased to 40%, the exhaust temperatures of B5, B10, B20, and B100 were 2.1%, 3.6%, 6.9%, and 14.7%, respectively, higher than that of mineral diesel fuel. Moreover, as the engine load increased, the exhaust temperature continued to increase. This is due to the oxygen content, which contributed to complete combustion, thus improving the diffusion combustion rate. As a result, the in-cylinder pressure increased as discussed earlier. Moreover, at the engine load of 60%, the exhaust temperatures of B5, B10, B20, and B100 were 1.0%, 3.0%, 5.2%, and 7.7%, respectively, higher than that of mineral diesel fuel. As the engine load increased, the exhaust temperature continued to increase. This is due to the oxygen content, which contributed to complete combustion, thus improving the diffusion combustion rate. As a result, the in-cylinder pressure increased as discussed earlier. High engine load results in increasing exhaust temperature, owing to the rising in-cylinder pressure.