Root response to temperature extremes: association mapping of
temperate maize (Zea mays L)
Regina Reimer
1, Benjamin Stich
2, Albrecht E Melchinger
3, Tobias A Schrag
3, Anker
P Sørensen
4, Peter Stamp
1, Andreas Hund
1*
1ETH Zurich, Institute of Plant, Animal and Agroecosystem Sciences, 8092 Zurich, Switzerland 2Max Planck Institute for Plant Breeding Research, 50829 Cologne, Germany
3Institute for Plant Breeding, Seed Science and Population Genetics, University of Hohenheim, 70593 Stuttgart, Germany 4Keygene NV, PO.Box 216, 6700 AE Wageningen, The Netherlands
*Corresponding author: E-mail: [email protected]
Keywords: corn, root growth, cold, heat, QTL
Little is known about the genetic control of the root architecture of maize (Zea mays L) and its response to tem-perature extremes. An association mapping panel, including 32 flint and 42 dent inbred lines, was characterized for root traits. The growth of axile and lateral roots was assessed non-destructively in growth pouches at 16°C (chilling), 28°C (control) and 36°C (heat). Association mapping was done using the PKOpt mixed-model association-mapping approach. Heat slowed down the development of seedling roots to a lesser extent than chilling, but differences between the heterotic groups were observed mainly at optimal temperature. Of 1,415 AFLP markers, 70 showed significant marker-trait associations and 90 showed significant marker-trait associations with tempera-ture interaction effects. Compared to the flint lines, the dents showed stronger growth of axile roots, especially under optimal conditions, and carried more of the trait-increasing alleles for the length of axile roots. In contrast, the flints accumulated more root dry weight at low temperature and exclusively carried the alleles favoring toler-ance to chilling. A combination of inbreds carrying alleles positive for performtoler-ance under contrasting temperature conditions should lead to a complementary effect in the hybrid and would increase adaptation to a wider range of temperature.
Abstract
Introduction
The adaptation of maize to a wide range of envi-ronmental conditions including temperature remains a central target of breeding programs. Maize breed-ers work with inbred lines that are selected for their ability to produce superior, well adapted commercial hybrids. Temperate hybrids in northern and central Europe are usually a cross of inbred lines from the heterotic groups flint and dent (Shaw, 1988). Both were established in the 1950s, based on European flint landraces and lines of Corn Belt Dent. The flint lines contributed chilling tolerance and the dent lines contributed a high yield potential (Hallauer, 1990). It may be speculated that in the past 60 years breeders improved chilling tolerance in both heterotic groups but little research has been done to evaluate if this was really the case.
In cool temperate climates maize is sown as early as possible when soil temperatures are above 7 to 8°C to ensure a high and consistent yield. However, when temperatures are low for a prolonged period of
time they have severe negative effects on early devel-opment. Chilling decreases the photosynthetic per-formance of maize seedlings (Fracheboud et al, 1999) as well as the root growth and leaf expansion (En-gels, 1994; Hund et al, 2008; Stone et al, 1999). There is not much information how heat stress affect root growth in maize but tropical maize inbred lines differ with respect to the sensitivity of their axile roots to high temperatures (Trachsel et al, 2010a). Temperate maize is rarely affected by high temperature during the seedling stage but maize selected for the coldest areas of northern Europe is known to suffer frequently from heat stress during later stages (Frei, 2000).
Early maize hybrids are considered to be a po-tential second-season crop when winter barley may be harvested earlier in southern regions of central Europe. Accordingly, seedlings may be exposed to chilling stress when sown in spring or to heat stress when sown in summer. A range of physiological and morphological adaptation is required to achieve
ad-Abbreviations: kLat -Relative elongation rate of lateral roots; ERAx - Elongation rate of axile roots; kLat/ERAx - Ratio of lateral to axile root elongation rate
Materials and Methods
We used a set of 74 European maize inbreds of flint (32) and dent (42) lines from a breeding program at the University of Hohenheim. Seeds from all geno-types used in this study were from one seed batch and, thus, are expected to contain similar levels of seed nutrients. Information about population struc-ture and linkage disequilibrium of this germplasm has been described elsewhere (Stich et al 2005; 2006). In short, LD was significant (p < 0.05) for about 15% of the AFLP marker pairs and for about 49% of the SSR marker pairs in each of the two germplasm groups, flint and dent. In both germplasm groups, the ratio of linked to unlinked loci pairs in LD was higher for AFLPs than for SSRs. The LD blocks between SSR markers were on average 30 cM. The LD blocks be-tween AFLPs were about 4cM shorter than those between SSR markers. The observation of LD due to linkage for both marker types suggested that ge-nome-wide association mapping should be possible using either AFLPs or SSRs.
Plant growth
Plants were tested under chilling stress (16°C), close-to-optimal temperature (28°C) and mild heat stress (36°C). The upper and lower temperatures are considered to be temperature extremes. These temperatures were based on preliminary studies of a wide range of favorable and unfavorable conditions. Roots stopped growing at 15°C and 40°C and grew best at 28°C (Hund et al, 2012).
Seeds were imbibed over night at room tempera-ture, surface sterilised with 2.5% sodiumhypoclorite-solution (NaOCl (aq)) for 10 min, rinsed thoroughly with distilled water, and germinated on filter papers (Ø 70 mm, Macherey-Nagel AG, Oensingen, Switzerland) in an incubator at 27 °C. Seedlings with a similar radicle aptation to chilling and heat stress. Physiological
ad-aptation to heat and chilling includes activation of the antioxidant system and the accumulation of soluble carbohydrates. Antioxidants prevent damage to the plant caused by reactive oxygen species (Nietosotelo and Ho, 1986; Timperio et al, 2008). Furthermore, morphological adaptation may be beneficial to plant productivity, for example through the development of more lateral roots (Hund et al, 2008) or an increase in root diameter (Cutforth et al, 1986) at low tempera-ture. Adaptation mechanism of plants to heat and cold may follow either common response pathways or temperature-specific pathways. Furthermore, aptation mechanisms to cold or heat may have ad-verse negative effect under the respective opposite temperature stress. The rapid accumulation of anti-oxidants or soluble carbohydrates is an example for a similar response, which is required under heat and chilling stress. By observing the allele effects that underlie the response to temperature extremes, the reaction type becomes evident. So far, little effort has been made to trace the effect of an allele over the whole range of temperatures, to which a maize plant may be exposed, depending on the environment and developmental stage. There is evidence that inbred lines differ with respect to their temperature optima leading either to greater heat or to greater chilling tolerance. Furthermore, the combination of relatively chilling sensitive inbred lines, with a lower tempera-ture optimum, and relatively heat tolerant inbred lines, with a higher temperature optimum, leads to hybrids combining both parental characteristics, chilling and heat tolerance (Hund et al, 2012). This combination of both, heat and chilling tolerance in hybrids may be explained by concept of ‘marginal overdominance’ in which the hybrid, summed over all situations, ex-presses higher relative fitness than its parents (Wal-lace, 2000).
Yet little is known about the genetic architecture of temperature tolerance of breeding populations used for hybrid maize breeding and there is almost no information about QTLs affecting temperature re-sponses of root growth.
Quantitative trait loci of maize were identified for root traits in relation to early vigor (Hund et al, 2004) as well as for physiological traits and growth under chilling stress (Jompuk et al, 2005). More information exists for seedling root traits at optimal temperature (Hund et al, 2004; Ruta et al, 2010; Trachsel et al, 2009; Tuberosa et al, 2003). All these QTL studies were based on biparental crosses, which have the disadvantage of being limited by the number and the resolution of alleles that can be sampled. Alter-natively, in the mapping of marker-trait associations in plant-breeding populations, a high number of al-leles can be mapped simultaneously at a high resolu-tion (Flint-Garcia et al, 2003). Statistical methods, to account for population structure minimize the risk of false-positive associations (Pritchard et al, 2000) but
may also increase the risk to underestimate the effect of alleles that are confounded with population struc-ture, as shown, for example, for the D8 allele confer-ring earliness (Camus-Kulandaivelu et al, 2006).
We are not aware of any QTL mapping or phe-notyping of root growth in the flint-by-dent heterotic pattern. Our primary goal was to evaluate the groups for differences with regard to the response of root growth to low and high temperatures. We chose to screen a comparably large set of 74 genotypes which allowed not only for a sound phenotypic character-ization of the heterotic groups, but also for a genome-wide association mapping. Our second objective was to identify putative key loci. We used the putative al-leles at these loci to elucidate their type of response, i.e. if they were involved in tolerance to chilling, heat or both, and the degree to which the alleles were fixed within either pool. The degree of fixation was used as indicator for the degree to which the pools are separated with respect to these loci either due to ancient population structure or selection.
choice criterion the lengths of axile and lateral roots were extracted from the root length in diameter-class distribution (RLDD) obtained by WinRHIZO as de-scribed by Hund et al (2009). Accordingly, the length of axile or lateral roots determined by image process-ing includes all three root types, i.e. the primary, sem-inal and crown roots. However, root diameters de-pend on environmental factors such as temperature. Accordingly, axile and lateral roots were separated by temperature-dependent thresholds determined by evaluating the bimodal shape of the RLDD (See Hund et al, 2009) for each temperature.
The elongation rate of the axile roots (ERAx) was linearly modeled, and the elongation rate of the lat-eral roots (kLat) was exponentially modeled (Hund et al, 2009; Ruta et al, 2009). The corresponding models were
x(t)=x(t0)ERAxt; ERAx=x(t)−x(t0)
t (1)
for axile root elongation, where x(t) is the root length at time t after germination, x(t0) is the root length at the first scanning day, and Δt is the lag between t and t0 and
x(t)=x(t0)eklatt; klat=log(x(t)t−x(t0))
(2)
for lateral root elongation rate, where klat is the growth constant for lateral roots. The growth con-stant k is inversely proportional to the doubling time of the length of lateral roots.
In addition to image processing, the numbers seminal roots (i.e. the number of roots emerging from the scutellar node) were counted. All roots are termed and abbreviated according to the terminology described by Hund et al (2011).
Experimental design and statistics
The experimental design within each temperature environment (tj) was an alpha lattice design (Barreto et al, 1997) with eight biological replications, i.e. four independent growth chamber replications per envi-ronment (rjk) and two blocks (bjkl) per growth chamber, each containing a full set of inbred lines (
g
i). The 74 inbred lines in each block were distributed across eight incomplete blocks (ciklm), which were distributed in four sections in each of two growth containers. The final model to obtain the best linear unbiased esti-mates (BLUEs) of genotypes was:Y
ijklm=
µ +
g
i+
t
j+
gt
ij|
gtr
ijk+
r
jk+
b
jkl+
c
jklm+
e
ijklm(3)where Yijklm is the effect of the ith inbred line in the jth
environment, the kth growth chamber run, the lth block
and the mth growth container. eijklm is the residual error and μ the intercept. The terms to the left and right of the vertical line (|) are considered to be fixed and random, respectively. Analysis of variance was done using the asreml-R package (ASReml release 2.0, Gilmour et al, 2006) and the best linear unbiased estimates (BLUEs), extracted for each genotype-by-length were transferred to growth pouches (Hund et
al, 2009) and cultivated until the respective V2 stage, indicated by a fully visible collar on the second leaf. The pouches were made of black plastic sheeting and contained blue germination blotting paper (24 × 29.5 cm; Anchor Paper, St. Paul, MI, USA) and were hung in growth containers (33 cm wide × 132 cm long × 33 cm high). The bottom of the pouch was sub-merged in nutrient solution (0.23% (v/v) of Wuxal®, Aglukon Spezialdünger GmbH, Düsseldorf, Germany; composition per liter: 100 g N, 100 g P2O5, 75 g K2O, 190 mg Fe, 162 mg Mn, 102 mg B, 81 mg Cu, 61 mg Zn, 10 mg Mo). To establish the seedlings, they were grown under optimal conditions (28°C) for two days. The photoperiod throughout the experiment was 12 h, the photosynthetic photon flux density (PPFD) was 350 µmol m-2 sec-1 and the relative humidity 60%. The
temperature treatments were commenced two days after transplanting the seedlings, when lateral roots had appeared. At harvest, the roots were carefully re-moved from the blotting paper. The root material was dried at 60°C to constant weight and the dry matter determined.
Imaging and analyses
Images were taken at three specified times by a flatbed scanner (HP scanjet 4600 series, ‘see-through’, Hewlett-Packard Company): i) before the application of the temperature treatment (t0) to de-termine the initial root length, ii) halfway through the treatment period (t1) to determine the increase of root length as a function of time and iii) at the V2 stage when the plants were harvested (t2) to determine root morphology depending on the stage. To scan the roots, the pouch was placed on a specially built rack. The front of the pouch was opened and the pouch was fixed; the scanner was in a horizontal position in front of the blotting paper. The acquired 24 bit im-ages were subsequently processed by Adobe Pho-toshop 7.0 in three steps (Adobe Systems Inc, San Jose, CA, USA). First, the saturation channel was used to obtain 8-bit images with enhanced contrast between roots and the background. Second, the me-dian filter with a radius of three pixels was used to re-move noise, which may have been present when de-tecting spurious roots by WinRHIZO 2003b (Regent instruments, Montreal, QC, Canada). Third, binary images were obtained by applying a threshold to the tonal value. These images were manually controlled to ensure quality of the data, which was subsequently processed by WinRHIZO, revealing 72 width classes (diameter for roots) ranging from 42.33 μm (1 pixel) to 3.05 mm (72 pixels). The debris removal filter was set to remove objects with an area smaller than 0.02 cm2 and a length/width ratio lower than 5. Axile roots of maize form the major structure of the root system and usually have diameter above 0.8 mm. Their lat-eral roots usually have diameters below that thresh-old and explore the soil at short distance (Hund et al, 2009; McCully, 1999). By using their root diameter as
treatment combination, were the input values for the association mapping.
The analysis of variance of the heterotic groups, flint and dent, and for the heterotic group-by-envi-ronment interaction was made according to the final model:
Y
ijklmn=
µ +
t
j+
h
n+
th
jn|
g
i+
gt
ij+
gtr
ijk+
r
jk+
b
jkl+
c
jklm+
e
ijklmn(4)
where Yijklmn is the effect of the ith inbred line in the nth
heterotic group, in the jth environment, the kth growth
chamber run, the lth block and the mth container. h is
the nth heterotic group (flint or dent); all other
param-eters are the same as in model 3. If not stated, then the effects of the extreme temperatures on traits are given in comparison to close-to-optimum tempera-ture.
The heritability based on an entry means (Holland et al, 2003) for each treatment was calculated as:
h
2=
σ
2gσ
2g+
1jσ
2gt+
1jkσ
2gtr+
jkl1σ
2r
(5)
where
σ
2g is the genetic variance,σ
2gt the variance of the genotype-by-temperature interaction, the variance of the genotype-by-temperature-by-run in-teraction, andσ
2r the residual error variance. j, k, and l denote the number of treatments (3), runs (4), and blocks (2), respectively.σ
2g is the genetic variance after correction for effects of the heterotic group.Association mapping
We conducted genome-wide association map-ping of 74 maize inbred lines, genotyped with 1415 AFLPs, of which 748 were mapped to one of the 10 chromosomes on the Keygene integrated map (un-published). The remaining markers are mapped to pseudo chromosomes. First, we analyzed the popu-lation structure of the lines. Second, the main marker effects and marker-by-temperature interaction
ef-fects were determined for the seedling growth traits. To detect markers linked to genome regions associ-ated with a specific stress response, markers show-ing significant interactions with the environment were classified according to their allele substitution effects. Finally, we attempted to shed light on the distribution of alleles, which increase tolerance in the heterotic groups.
Analysis of population structure
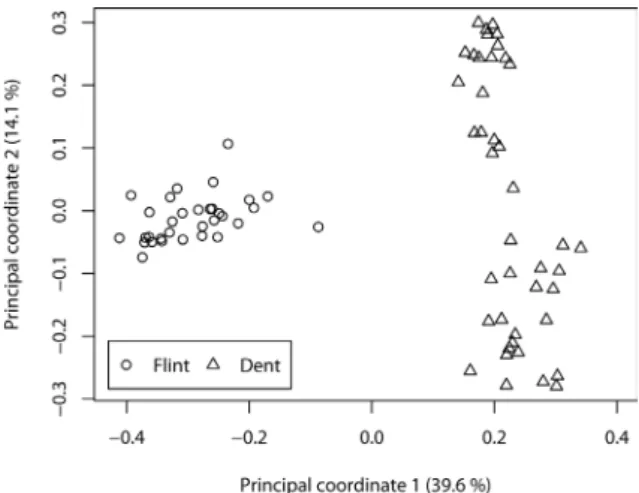
This analysis was performed based on 163 SSRs (Schrag et al, 2010) using the R Statistics Software (R Development Core Team, 2008). The Rogers’ distance (RD) was calculated according to Rogers (1972). Associations among the 74 inbred lines were revealed by a principal coordinate analysis (Gower, 1966) based on RD estimates between pairs of in-breds. Analysis of the first principal coordinate (PC1) explaining 39.6% of the variance revealed a clear separation of the heterotic groups, flint and dent, confirming that they are two distinct groups (Figure 1).
The combined analysis of adjusted entry means (BLUEs) across environments, obtained from model (3), did not enable us to infer entry-by-environment interactions (cf. Piepho, 2000). Nevertheless, the re-sults of Stich et al (2008a) indicate that the power for detection of marker-phenotype associations with a two-step approach based on adjusted entry means for each environment is only slightly lower than with a one-step approach. Therefore, our analyses were based on adjusted entry means for each environment.
The PKopt method described by Stich et al (2008b) was used to detect AFLP phenotype asso-ciations:
M
ijp=
µ +
u=1P
iuv
u z∑
+
l
j+
a
p+
(al)
jp+
g
i+
e
ijp(6) where Mijp is the adjusted entry mean of the ith maizeinbred in the jth environment carrying the pth allele, m
is the intercept, nu the effect of the uth column of the
population structure matrix P, lj the effect of the jth
environment, ap the effect of allele p, (al)jp the inter-action effect of the pth allele with the jth environment,
g
ithe genetic effect of the ith entry except for ap, andeijp the residual.
According to Zhao et al (2007), the first two prin-cipal components (z = 2) of the SSR allele frequen-cy matrix, which explained 53.7 % of the variance (c.f. Figure 1), were used as the P matrix. The vari-ance of the random effects
g
=
g
1,...,
g
74 and e = (e1, 1, 1,..., e74, 3, 2) was assumed to be Var(g
) = 2Koptσ
2g and Var(e) = Rσ
2r, where Kopt is a 74×74matrix of kinship coefficients, defining the degree of genetic covariance between all pairs of entries, and R 222 × 222 the identity matrix. Genetic variance,
σ
2gand residual variance,
σ
2rwere both estimated by REML. For each examined trait, Kopt was calculated according to Stich et al (2008b) using the SSR mark-ers.Figure 1 - Principal coordinate analysis based on Rogers' distance estimates. Flint lines (open circles) dent lines (tri-angles).
To solve the multiple test problem, the Bonfer-roni-Holm procedure (Holm, 1979) was applied to detect AFLPs with significant (P < 0.05) 1) main ef-fects across environments; and 2) AFLP × environ-ment interactions. The proportion of genotypic vari-ance, explained by one marker, was calculated from the reduction of the genetic variance in a model with marker effects compared to the genetic variance in a model without marker effects. The total proportion of genotypic variance explained by all AFLPs with sig-nificant main effects was obtained by fitting a model, which included all markers. All mixed-model calcu-lations were performed with the ASReml release 2.0 (Gilmour et al, 2006).
Test for group specificity
We determined whether the detected associa-tions were partly associated with the heterotic group. Thus, the frequency of alleles in the flint group was assessed for trait-associated markers. The frequency was expressed as the ratio of the number of flints carrying the allele to the total number of genotypes carrying the allele. This ratio flint (c.f. Supplementary Table 1) was 0 when the allele was absent in the flint group, and was 1 when the allele was detected in the flints but not in the dents. A χ2 two sample test was
conducted to determine whether the heterotic groups differed in the frequency of alleles, i.e. whether the alleles were group-specific. The average effect of the flints (Effect flint, Supplementary Table 1 and 2) on the traits of a virtual flint-by-dent hybrid was quali-fied based on the allele substitution effect and the frequency of alleles in the flint pool. In the case of the loci with association-by-temperature interactions, the “effect flint” revealed the relative change in the allele effect at temperature extremes compared to the con-trol. For example, a positive “effect flint” was found
when a½ changed positively from the optimum to the extreme and the trait-increasing allele was more fre-quent in the flints (Supplementary Table 1).
The detected associations were projected on the IBM2 2008 Neighbors Frame (Schaeffer et al, 2008) genetic map (called Neighbors 2008 in the follow-ing), obtained from the Maize Genetics and Genom-ics Database (MaizeGDB, Lawrence et al, 2005) by the BioMercator software (Arcade et al, 2004) using 135 common SSR markers. Association clusters were assigned when multiple associations for the same trait were detected on the same chromosome within a region of ±20 cM on Neighbors 2008. The respective number of detected associations is given in parentheses (Figure 2). Collocation of marker-trait associations of different traits was considered to be positive when the a1/2 had the same algebraic sign (+ or −) and negative when the signs were opposite. Temperature-tolerance genes in the ± 20 cM region around the detected associations were selected from the Neighbors 2008 map to pinpoint the most inter-esting associations.
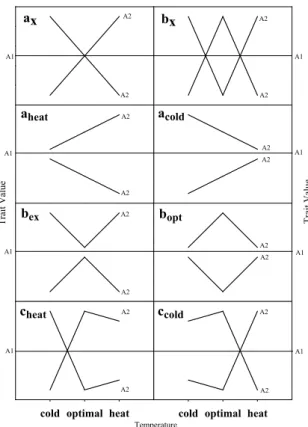
Classification of allele responses
The allele substitution effect (a1/2) is given as the additive effect of replacing allele 1 by allele 2. To ob-tain the relative allele substitution effects, we set the absolute a1/2 relative to the adjusted means (BLUEs). Figure 3 shows the allele responses to temperature. Allele-by-temperature treatment interaction effects are shown for close-to-optimal (here 28°C) and ex-treme (here 16°C and 36°C) temperature. Allele 2 (A2) shows two possible reactions of one allele in relation to the reference allele 1 (A1). The allele confers toler-ance to only one of the temperature extremes (a), both temperature extremes (b), or indifferent (c). Classes are subdivided into those with crossover interactions
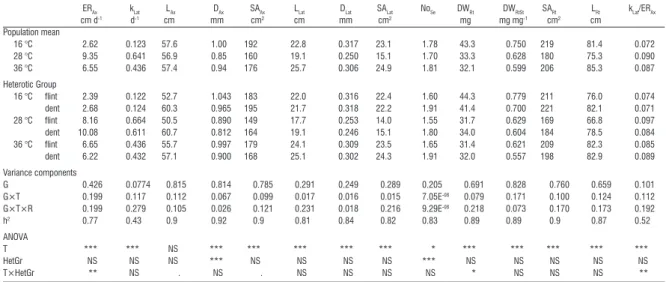
Table 1 - Adjusted means for population and heterotic groups (flint and dent) within temperature treatments for various mea-sured traits. For explanation of the acronyms in the table header, see Table 2. Proportion of total variance of genotype (G), genotype-by-treatment interactions (G×T) and genotype-by-treatment-by-run interactions (G×T×R) as well as heritability estimates (h2). ANOVA results for the effect of treatment (T) heterotic group (HetGr) and their interaction.
ERAx kLat LAx DAx SAAx LLat DLat SALat NoSe DWRt DWRtSt SARt LRt kLat/ERAx cm d-1 d-1 cm mm cm2 cm mm cm2 mg mg mg-1 cm2 cm Population mean 16 °C 2.62 0.123 57.6 1.00 192 22.8 0.317 23.1 1.78 43.3 0.750 219 81.4 0.072 28 °C 9.35 0.641 56.9 0.85 160 19.1 0.250 15.1 1.70 33.3 0.628 180 75.3 0.090 36 °C 6.55 0.436 57.4 0.94 176 25.7 0.306 24.9 1.81 32.1 0.599 206 85.3 0.087 Heterotic Group 16 °C flint 2.39 0.122 52.7 1.043 183 22.0 0.316 22.4 1.60 44.3 0.779 211 76.0 0.074 dent 2.68 0.124 60.3 0.965 195 21.7 0.318 22.2 1.91 41.4 0.700 221 82.1 0.071 28 °C flint 8.16 0.664 50.5 0.890 149 17.7 0.253 14.0 1.55 31.7 0.629 169 66.8 0.097 dent 10.08 0.611 60.7 0.812 164 19.1 0.246 15.1 1.80 34.0 0.604 184 78.5 0.084 36 °C flint 6.65 0.436 55.7 0.997 179 24.1 0.309 23.5 1.65 31.4 0.621 209 82.3 0.085 dent 6.22 0.432 57.1 0.900 168 25.1 0.302 24.3 1.91 32.0 0.557 198 82.9 0.089 Variance components G 0.426 0.0774 0.815 0.814 0.785 0.291 0.249 0.289 0.205 0.691 0.828 0.760 0.659 0.101 G×T 0.199 0.117 0.112 0.067 0.099 0.017 0.016 0.015 7.05E-08 0.079 0.171 0.100 0.124 0.112 G×T×R 0.199 0.279 0.105 0.026 0.121 0.231 0.018 0.216 9.29E-08 0.218 0.073 0.170 0.173 0.192 h2 0.77 0.43 0.9 0.92 0.9 0.81 0.84 0.82 0.83 0.89 0.89 0.9 0.87 0.52 ANOVA T *** *** NS *** *** *** *** *** * *** *** *** *** *** HetGr NS NS NS *** NS NS NS NS *** NS NS NS NS NS T×HetGr ** NS . NS . NS NS NS NS * NS NS NS **
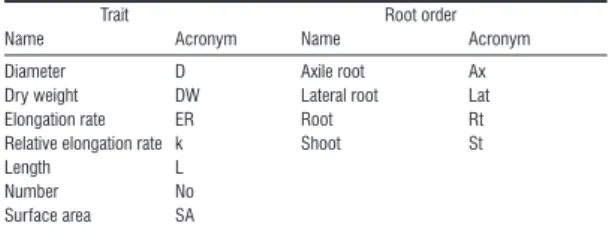
Table 2 - Explanation of acronyms. Acronyms are a com-bination of the measured trait name (e.g. D for diameter) followed by the organ or root type as subscript (e.g. Ax for axile root).
Trait Root order
Name Acronym Name Acronym
Diameter D Axile root Ax Dry weight DW Lateral root Lat Elongation rate ER Root Rt Relative elongation rate k Shoot St Length L Number No Surface area SA
for ERAx, for the ratio of the elongation rates of ax-ile and lateral roots (kLat/ERAx), and for the total root dry weight. Compared to the flints, the dents had a 19% higher ERAx at optimum temperature, which led to axile roots being longer by 17% at the end of the experiment. In contrast, the relative growth rate of the lateral roots of the flints was higher at optimum tem-perature, indicated by a wider kLat/ERAx ratio. Further-more, the flints produced more root dry matter under chilling conditions (+7% weight) and less dry matter under close-to-optimal temperatures (-7% weight).
The association analysis yielded 70 marker-trait associations with main effects for 12 traits ( Supple-mentary Table 1). Using only associations mapped to a chromosome and combining those associations within a window of ±20 cM on the IBM2 map, 43 QTL could be reported (Figure 2). The number QTLs with main effects ranged from one for the surface area of lateral roots (SALat) and total root length to 13 for the median diameter of the axile roots (DAx) (Figure 2). The genetic variance explained by all the markers ranged from about 27% for SALat to 93% for the number of seminal roots (NoSe). The contribution of single mark-ers was highest and lowest for NoSe (77.7 and 7.7%, respectively) and averaged 30.6% for all the mark-ers of all traits. A total of 27 of the 70 associations were observed for AFLPs, which have not yet been mapped to one of the 10 chromosomes on the Key-gene integrated map (NA, Supplementary Table 1).
Dents carried trait-increasing alleles for length and surface area of axile roots
The heterotic groups were compared for the fre-quency of alleles in the detected associations to de-termine whether some alleles were significantly more frequent in one heterotic group than in the other (fur-ther called group-specific alleles). Group specificity was the case for 50% of the associations with main effects, where the frequency of alleles differed among the groups (Supplementary Table 1, χ2). In the flints,
an allele was fixed in six cases; five of the fixed alleles were for the number of seminal roots (Supplementary Table 1). An allele was absent in six cases without trait specificity. The frequency of most of the trait-decreasing alleles at loci controlling axile root length (LAx), surface area of the axile roots (SAAx), and total root surface area (SARt) was significantly higher in the flints.
Alleles effects predominantly showed similar re-sponse to temperature-extremes
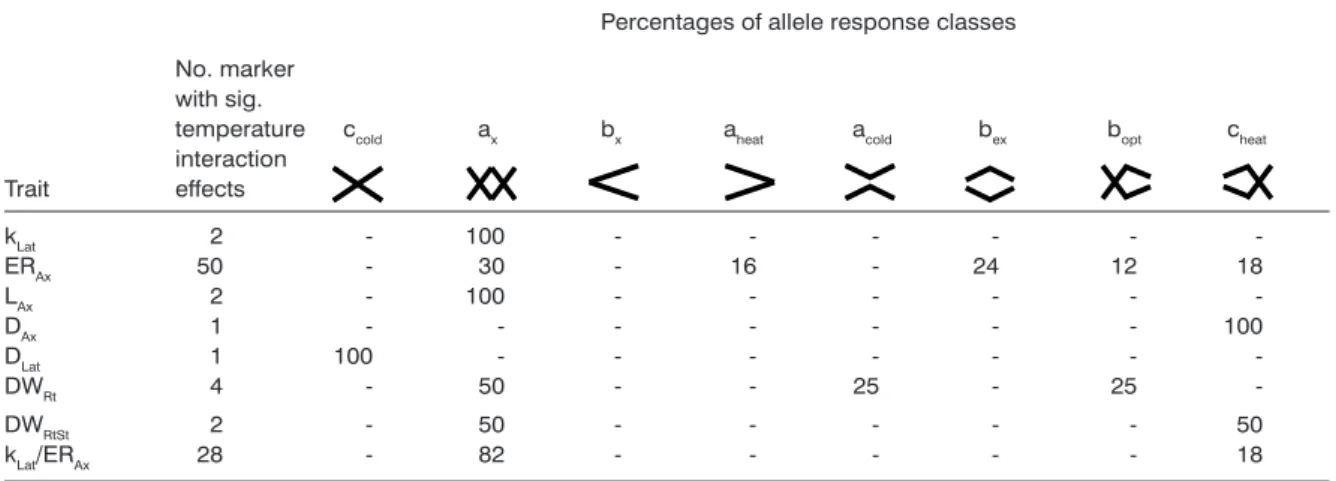
The allele substitution effect (a1/2) among each trait and treatment was of a similar magnitude for most detected associations, with the exception of ERAx (16°C). However, a1/2 differed strongly between the temperature treatments for each trait and within the treatments. We classified the detected marker-by-temperature interactions according to the allele response classes based on a1/2 (Figure 3). The ma-jority of alleles responded with at least one crossover interaction (Table 3, ax, bx, cheat, or ccold). The type of (ax, bx, cheat,ccold) and those without interactions (aheat,
acold, bopt, bex). Class (a) displays the response of an al-lele to either chilling or heat stress while (b) illustrates a similar response to the temperature extremes. Furthermore, the subscript “x” denotes a crossover-interaction. Classes without interactions illustrate a response to heat- (aheat), chilling- (acold), optimal- (bopt) and extreme conditions (bex). Subclasses of c show a crossover-interaction combined with either a similar response to optimal and heat (cheat) or to optimal and chilling (ccold) conditions.
Chilling had the strongest effect on growth
Chilling reduced the elongation of axile and lat-eral roots by 81 and 72%, respectively. Both traits were affected less by heat stress. At the end of the experiment total root length, root diameter, and root surface area had increased in plants grown under extreme temperatures. The root dry weight and the root-to-shoot dry weight ratio decreased from chilling temperature to optimum temperature to high temper-ature. Thus, shoot growth increased more than root growth when temperature increased. The heritability was high for all the traits (average of 0.81), with the exception of kLat (0.43) due to low genotypic variance (Table 1). When heritability was calculated separately for each heterotic group that of the flints increased slightly (average of 0.85), while that of the dents de-creased (average of 0.73). The decrease in heritability in the dents was most apparent for kLat, NoSe and kLat/ ERAx and was caused by lower genotype variance in the dents (data not shown).
Interactions among temperature and heterotic group were due to stronger elongation of axile roots of the dents at optimal temperature
Only differences in the diameter of axile roots and the number of seminal roots for the flint and the dent groups were significant (ANOVA, Table 1). On average, the axile roots of the flints were 0.09 mm (9%) thicker and the number of seminal roots was 15% lower compared to the dents. The number of seminal roots of the dents showed a lower genotypic variance, indicating less diversity among the dent lines for this trait (data not shown). Heterotic group-by-temperature treatment interactions were found
Results
allele response to temperature can be examined best for the two traits with the highest number of detect-ed associations, i.e. ERAx (50 associations) and kLat/ ERAx (28 associations) (Table 3). For ERAx, most of the responses were assigned to scenario ‘b’ indicating similar allele responses to temperature extremes. Among these, 30% showed an interaction (bx) and 24% showed sizable effects at optimal temperature (bopt). There were nine loci, where the change in the relative effect on trait values was above 6% at opti-mal temperatures. These were detected in bins 5.01, 5.03, 7.02, and 10.04, to mention only those mapped to a chromosome. Under chilling, there were four siz-able loci, with only one being mapped to a chromo-some (bin 7.02). Under high temperature, no sizable locus was detected. For kLat/ERAx, all the responses were assigned to bx (82%) and ccold (18%) (Table 3). The effect of most loci was around 20% at the control temperature. A closer look at the ccold-type responses revealed that they were similar to bopt- or bx-type re-sponses with a large effect at the control temperature and small or even negative effects at extreme tem-peratures. Thus, the majority of loci showed a clear effect at the control temperature but weak or invers effects at the extremes. One remarkable locus (bin 10.04) caused a particularly strong change in root morphology at extreme temperatures (bx). A negative collocation was observed for two markers (bin 10.04) for ERAx and kLat/ERAx. Furthermore, the effect flint (Supplementary Table 2) indicated greater tolerance of ERAx to temperature extremes but lesser tolerance of kLat and, accordingly, a decrease in kLat/ERAx.
Flints carried alleles favoring chilling tolerance of root dry weight; dents carried alleles for higher kLat/ ERAx at heat
There were 90 marker-by-temperature interac-tions for 12 traits (Supplementary Table 2). Using only associations mapped to a chromosome and combin-ing those associations within a window of 20 cM on the IBM2 map, 40 QTL could be reported (Figure 2). The number of QTLs ranged from one for the median diameter of both root types (DAx, DLat) to 20 for ERAx (Figure 2). Thirty-two of the 90 associations were ob-served for AFLPs, which have not yet been mapped to one of the 10 chromosomes on the Keygene in-tegrated map (NA, Supplementary Table 2). Group specificity was the case for 83.3% of the marker-by-temperature interactions (Supplementary Table 2, χ2).
At most of the group-specific loci, there was a clear association of the tolerance-increasing allele to one of the heterotic groups. For most marker-trait associ-ations, the flint group carried the allele increasing tol-erance to heat and cold; for kLat/ERAx, the flint group carried the allele decreasing tolerance to heat and cold. Thus, all these associations were clearly trait and group specific. The croup-specificity of these as-sociations is supported by a similar behavior of the mean values of each heterotic group in response to temperature (cf Table 3).
Response of ERAx to temperature altered root mor-phology as indicated by kLat/ERAx
The detected associations were projected onto the IBM2 2008 Neighbors Frame genetic map. Col-locations of marker-trait associations were detect-ed on all chromosomes (Figure 2). Collocations for association-by-temperature interaction effects were found to a greater extent for axile root traits. Eleven collocations between ERAx and kLat/ERAx appeared on different chromosomes (Figure 2). A positive colloca-tion between the ratio kLat/ERAx and kLat was detected in only one case (bin 10.04) (Supplementary Table 2), indicating that a change in ERAx generally influenced this ratio. This is supported by the close negative cor-relation between ERAx and kLat/ERAx (r ~ -0.74), while kLat was not correlated with the ratio and, thus, did not influence the ratio. Two collocations for kLat/ERAx and axile root length (LAx) were detected in bins 2.09 (negative collocation) and 10.04 (positive collocation) (Supplementary Table 2, Figure 2). Collocations for associations with main effects were found for several traits. On chromosome 5, the surface area of axile roots (SAAx) and the total root surface area (SARt) collocated positively with the ratio between the dry weight of the root and the shoot in bin 5.05. In bin 6.08, SAAx and SARt collocated positively with total root dry weight. This is supported by the high cor-relations between these traits (r ~ 0.7). In bin 7.02, the surface area of the lateral roots (SALat), the length of axile roots (LAx), and the total root surface area (SARt) were collocated. Accordingly, the correlation of LAx and SARt was close (r ~ 0.9), but lateral roots also played a major role in determining root surface area (r ~ 0.7).
Linked genes involved in temperature response mechanisms
Genes close to the detected association (± 20 cM region), which are involved in temperature-tol-erance mechanisms, were selected from the IBM2 2008 Neighbors Frame map (MaizeGDB: http://www. maizegdb.org/). In bin 1.05, glutathione S-transferase Gst32 and Gst42 were located ~12 cM and Gst14 was ~5 cM from an association for ERAx. In bin 8.05, Gst15 was 2 cM from a marker-by-temperature inter-action for ERAx. In bin 1.04, sucrose synthase (Sus2) (pos 329.06 cM) was in 13 cM from marker-by-tem-perature interactions for ERAx and kLat/ERAx (Figure 2). In bin 9.04 Sus1 was 8 cM from a cluster of ERAx and kLat/ERAx associations. Vacuolar acid invertase2 (Ivr2) (bin 5.03, 288 cM) was 3 cM from a marker-by-tem-perature interaction for ERAx (type bopt response). The second gene in bin 5.04, cell wall invertase1 (Incw1) (376.4 cM), was 1 cM from a marker-by-temperature interaction for ERAx. Incw3 (bin 10.04, 272.2 cM), from the same gene family, was 7 cM from a cluster of marker-by-temperature interactions for ERAx, kLat, LAx, and kLat/ERAx. Sus, Ivr, and Incw all provide sucrose cleavage mechanisms so that sugars can be trans-ported to and utilized in the sink organs.
In bin 1.08, a gene coding for a glycine-rich pro-tein (Grp1) was only 2 cM from an association for DLat and 4 cM from a marker-by-temperature interaction for ERAx. In bin 5.03, a similar gene, Grp3 (243.5 cM), was 1 cM from a marker-by-temperature interaction for ERAx and 2 cM from an association for NoSe.
0 50 100 150 200 250 300 350 400 450 500 550 600 650 700 750 -50 0 50 100 150 200 250 300 350 400 450 500 550 600 650 700 750 800 850 900 950 1000 1050 1100 -150 -100 -50 0 1 2 3 4 5 6 7 8 DA x SAR t|S AA x|D W R t ERA x 6 0 1 2 Gst23 3 4 5 6 LA x DA x N oSe SAR t N oSe E R A x(3 ) SAA x SAR t(2 ) LA x|S A La t kLa tE R Ax 7 0 1 2 3 4 5 Gst15 6 7 8 9 E R Ax E R A x|k La tE R Ax DA x D W R tSt 8 0 1 2 3 5 Sus1 4 6 7 8 N oSe E R Ax D La t D W R t kLa tE R Ax ER La t 9 0 1 2 3 4 Incw3 5 6 7 E R A x(3 ) kLa tE R A x(3 ) kLa t LAx E R A x(2 ) 10 Title 0 1 2 3 4 Sus2 Gst32 Gst42 5 Gst14 6 7 8 Grp1 9 10 11 12 DA x N oSe kLa tE R Ax E R Ax ERA x D La t kLa tE R Ax N oSe E R Ax DA x D W R t(2 ) E R A x(2 ) 1 0 1 2 3 4 5 6 7 8 9 10 DA x kLa tE R Ax kLa tE R A x(2 ) D W R t E R Ax LAx E R A x|k La tE R Ax N oSe ER La t 2 0 1 2 3 4 5 6 7 8 9 10 kLa tE R A x(2 ) DA x D Ax LR t DA x E R Ax E R Ax DA x(2 ) N oSe 3 0 1 2 3 4 5 6 7 8 9 10 11 E R Ax DA x DA x N oSe kLa tE R Ax E R Ax 4 0 1 2 3 Grp3 Ivr2 4 Incw1 5 6 7 8 9 10 E R Ax D W R t DA x N oSe DA x kLa tE R Ax E R A x(2 ) E R A x(3 ) E R A x(2 ) E R A x(2 ) D W R tSt N oSe SAA x|S AR t 5
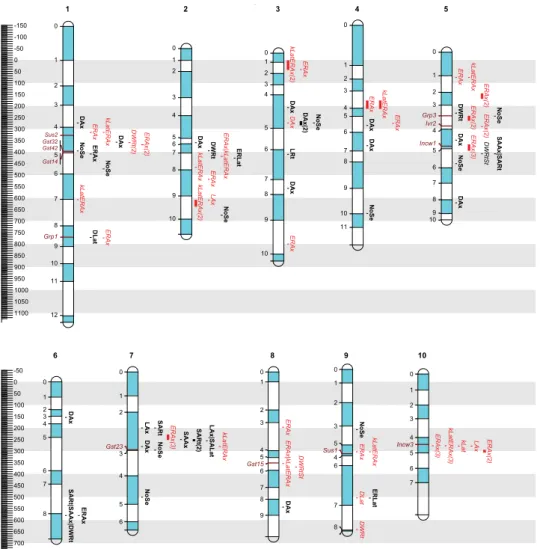
Figure 2 - Detected QTLs projected on the on the IBM2 2008 Neighbors Frame reference map (MaizeGDB: http://www.maize-gdb.org/). The scale indicates the position on the reference map in cM. Labels to the left of each chromosome indicate the bin numbers (shaded areas) as well as candidate genes mentioned in the text. Candidate genes are glutathione S-transferase (Gst),
sucrose synthase (Sus), Vacuolar acid invertase (Ivr) and cell wall invertase (Incw). Marker-by-trait associations are listed at the
right of the chromosomes. In case several association of the same trait fell within a window of ±20 cM, these associations were combined and the interval between the first and the last association was given. The number of combined associations is given in brackets. Marker-trait associations with main effects are indicated in bold type; marker-by-temperature interactions are italicized. For trait abbreviation see Table 2.
Root growth and Morphology
Fewer seminal roots and a larger median diam-eter of axile roots was associated with the flints, as observed too by Wiggans (1916). Wiggans also found that flints had only one to two seminal roots, whereas the dents had three to four seminal roots. This dif-ference was also described by Hoecker et al (2006). Seedlings grown at 15°C had thicker roots with
Discussion
considerably fewer hairs than roots grown at higher temperature (Cutforth et al, 1986). Therefore, the in-creased diameter of the flints may be a strategy to achieve tolerance to chilling, because thicker roots enable better water transport under chilling stress due to xylem vessels with a greater diameter (Varney et al, 1991).
Root elongation vs. final root length
We found a greater number of marker-by-temper-ature interactions for traits related to root elongation rates than was found for measurements at the end of the experiment. For example, ERAx yielded 50 as-sociations compared to LAx, which had only two. The detection of fewer associations for LAx may be due to unaccounted differences in germination. These differ-ences can result in large errors and can be overcome
Figure 3 - Classification of AFLP allele response based on the relative allele substitution effects (a1/2) in each tempera-ture treatment. A2 shows two possible reactions of one allele in relation to the reference allele (A1 zero line). Alleles confer tolerance to temperature extreme (a), or to both temperature extremes (b), and indifferent (c). Classes are subdivided into crossover interactions (ax, bx) and no crossover interactions but responsive to heat (aheat), chilling (acold), optimal (bopt) and extreme conditions (bex). Subclasses of c show either a similar response to optimal heat (cheat) or to optimal chilling (ccold) conditions. Tr ai t V al ue
cold optimal heat cold optimal heat
ax bx bex bopt A1 A2 A2 A2 A2 A2 A2 cheat ccold Tr ai t V al ue aheat A2 acold A2 A2 Temperature A2 A2 A2 A2 A1 A1 A1 A1 A1 A1 A1 A2 A2 A2
by measuring elongation rates (Hund et al, 2009). The detection of a greater number of marker-by-environ-ment interactions resulting from the measuremarker-by-environ-ment of elongation rates is corroborated by a QTL study of the response of root elongation to water deficit (Ruta et al, 2010).
The response was alleles is similar at both tem-perature extremes
The relative allele effects were usually strongest at the optimum temperature, decreased towards the extremes (bopt), and sometimes reverted into the op-posite effect (bx). The pattern of allele response of bx and the subclasses (Figure 3) indicates that geno-types are ‘equipped’ with alleles that are superior or inferior at both temperature extremes in contrast to the optimum. Thus, relative differences in growth rates at extreme temperatures might be due to the activation of stress-response pathways. These may help to maintain organ growth or, alternatively, stop organ growth as we observed. The effect of the
larg-est genetic differences at optimal temperature is con-firmed again by the differences between the heterotic groups. The contribution of the alleles to temperature tolerance is best explained by kLat/ERAx and ERAx, which showed most marker-by-temperature interac-tions. In the case of kLat/ERAx, the inversion of the rela-tive allele effect from the extremes to the close-to-optimal temperature was strong and affected many loci. Furthermore, an increase in kLat/ERAx was fre-quently collocated with a decrease in ERAx. The rela-tive increase at these loci might be due to the effect of temperature on the growing meristem of the axile root, not on the lateral root. Hund et al (2008) also found that the overall length of the lateral roots was not influenced by temperature. This may be related to apical dominance and to compensation for stress ef-fects on the axile root meristem by subsequent lateral roots. An increase in lateral roots was also observed when roots grew at very high concentrations of PEG, which caused a very low water potential (Trachsel et al, 2010b). Longer lateral roots have been associated with better plant performance at low temperature (Hund et al, 2007) and are considered to be a key fac-tor in improving early vigor (Hund et al, 2008).
In the case of ERAx, the majority of alleles showed the strongest effects under chilling stress and weaker effects at optimum temperature. This might suggest that alleles responsible for cold tolerance can have a negative effect on plant growth at optimal tem-perature. This phenomenon has been described for photosynthesis-related traits (Jompuk et al, 2005), but not yet for root elongation.
Allelic composition of heterotic groups
We decided to report also markers for which the alleles were not detected as polymorphic in the stan-dard mapping populations of Keygene. Since we do not know if these markers map to the same or dif-ferent haplotype blocks, the numbers give only an upper estimate of the true number of associations. However, for almost all traits, the alleles were clearly group-specific, i.e. all trait-increasing alleles tended to be more abundant in one of the heterotic groups. This is remarkable, because these associations were detected, despite the fact that the population struc-ture was taken into account. Thus, only those asso-ciations were detected, for which the marker was not fully associated with the heterotic group. If popula-tion structure is not considered, then the detecpopula-tion of false positive associations cannot be avoided (An-dersen et al, 2005; Camus-Kulandaivelu et al, 2006). On the other hand, fixed alleles for the target trait are closely associated with population structure (heter-otic group) and might not be detected if population structure were considered (Andersen et al, 2005; Camus-Kulandaivelu et al, 2006). When population structure was not taken into account, there was an increase in the number of detected main marker-trait associations with main effects (142 compared to 70), probably due mainly to a high number of false
posi-Table 3 - List of allele response classes for marker-by-temperature interactions. See Table 2 for abbreviations of traits. Symbols refer to the list of classes in Figure 3.
Percentages of allele response classes
No. marker with sig.
temperature ccold ax bx aheat acold bex bopt cheat
interaction Trait effects kLat 2 - 100 - - - - -ERAx 50 - 30 - 16 - 24 12 18 LAx 2 - 100 - - - - -DAx 1 - - - - 100 DLat 1 100 -DWRt 4 - 50 - 25 25 -DWRtSt 2 - 50 - - - - - 50 kLat/ERAx 28 - 82 - - - - - 18
tives. In the case of marker-trait associations, which interacted with temperature, taking the population structure into account did not increase the number of detections (90 vs 89). Thus, it is unlikely that true response alleles were discarded when accounting for population structure.
The detected group specificity is remarkable since it is unlikely that it would happen by chance. But what causes a “synchronized” unequal distribution of the trait-increasing alleles in both heterotic groups? Our results indicate that the heterotic groups may have been selected to allow for a wider adaptation to tem-perature by the resulting hybrid. The flint contributed alleles for chilling tolerance, and the dent lines con-tributed to productivity under optimal conditions and, thus, to a high yield potential (Hallauer, 1990). How-ever, little is known about how modern flint and dent lines differ with respect to their allelic contribution to temperature tolerance. Mc William and Griffing (1965) evaluated the temperature-dependence of heterosis in maize and its contribution to hybrid vigor. They compared a northern flint inbred line with a southern dent inbred line and did not find strong differences among them. One reason for this might have been the reported genetic defect in the flint line due to in-breeding, which affected the formation of chlorophyll, especially in the cold. Hund et al (2012) provided the prove-of-concept that hybrids of flint and dent inbred lines with different temperature-behavior perform better across the sum of all temperatures the hybrid is exposed to. However, they evaluated only a small set of reciprocal crosses between two flint and two dent inbred lines. Based on the study of Hund et al (2012), it cannot be generalized that the combina-tion of genotypes with different temperature behavior will lead to improved hybrids. However, the results obtained here suggest that different temperature behavior is the case in the flint-dent heterotic breed-ing pool: While the dents are characterized by an in-creased root growth at optimal temperature, the flints show slightly increased root growth at
temperature-extremes. It will be interesting to evaluate, if the most contrasting inbred lines will lead to superior hybrids better adapted to various temperature regimes.
Candidate pathways and their genes
A high proportion of genes located around the detected associations are related to glycolysis, sug-gesting that this pathway plays a key role in response to temperature. It is striking that three out of six in-vertase genes (soluble Ivr1 and Ivr2, insoluble Incw1, 2, 3, and 4) and two of out of three sucrose synthase genes (sus1, sus2, and sh1) known in maize mapped close to root loci controlling the response of roots growth to temperature. Invertase and sucrose syn-thase are the starting enzymes of the cytosolic gly-colysis pathway, which enables essential metabolic adaptability facilitating plant development (Fernandes et al, 2008; Ruan, 2012) and acclimation to environ-mental stress (Fernandes et al, 2008). This network seems to play a pivotal role in regulating the response to multiple types of abiotic stress. The expression of stress-specific isozymes may be regulate this path-way (Fernandes et al, 2008) with glucose being the potential signaling molecule (Roitsch and Gonzalez, 2004). The accumulation of sugars like sucrose is one of the most commonly observed responses to abiotic stress (Lunn and Furbank, 1999) and is also observed under chilling (Verheul et al, 1995). The root tips ac-cumulate assimilated carbon to a greater extent than at optimal temperature, indicating that they cannot utilize the carbohydrates for growth and respiration (Nagel et al, 2009). An important regulatory role of invertase and sucrose synthase has already been shown for the root elongation of Arabidopsis (Serge-eva et al, 2006). One of our candidate genes, Ivr2, was identified as a candidate gene in a study on the genetic control of acclimation of the photosynthetic apparatus to low temperature at night (Guerra-Peraza et al, 2010).
Genes encoding for glycine-rich proteins were closely linked with root traits like DLat and ERAx. Glycine-rich proteins are root-tissue specific and
References
Andersen JR, Schrag T, Melchinger AE, Zein I, Lub-berstedt T, 2005. Validation of Dwarf8 polymor-phisms associated with flowering time in elite Eu-ropean inbred lines of maize (Zea mays L). Theor Appl Genet 111: 206-217
Arcade A, Labourdette A, Falque M, Mangin B, Char-don F, Charcosset A, Joets J, 2004. BioMerca-tor: integrating genetic maps and QTL towards discovery of candidate genes. Bioinformatics 20: 2324-2326
Barreto HJ, Edmeades GO, Chapman SC, Crossa J, 1997. The alpha lattice design in plant breeding and agronomy: Generation and analysis, pp. 544-551 In: Developing drought and low N-tolerant maize. Edmeades GO, Bänziger M, Mickelson HR, Peña-Valdivia CB, eds. Proceedings of a symposium, El Batan, Mexico
Camus-Kulandaivelu L, Veyrieras JB, Madur D, Combes V, Fourmann M, Barraud S, Dubreuil P, Gouesnard B, Manicacci D, Charcosset A, 2006. Maize adaptation to temperate climate: Relation-ship between population structure and polymor-phism in the Dwarf8 gene. Genetics 172: 2449-2463
Cutforth, HW, Shaykewich CF, Cho CM, 1986.
Ef-fect of Soil-Water and Temperature on Corn (Zea Mays L) Root-Growth During Emergence. Can J Soil Sci 66: 51-58
De Oliveira DE, Seurinck J, Inze D, Van Montagu M, Botterman J, 1990. Differential Expression of Five Arabidopsis Genes Encoding Glycine-Rich Pro-teins. Plant Cell 2: 427-436
Engels C, 1994. Effect of root and shoot meristem temperature on shoot to root dry matter partition-ing and the internal concentrations of nitrogen and carbohydrates in maize and wheat. Ann Bot 73: 211-219
Fernandes J, Morrow DJ, Casati P, Walbot V, 2008. Distinctive transcriptome responses to adverse environmental conditions in Zea mays L. Plant Biotechnol J 6: 782-798.
Flint-Garcia SA, Thornsberry JM, Buckler ES, 2003. Structure of linkage disequilibrium in plants. An nu Rev Plant Biol 54: 357-374.
Fracheboud Y, Haldimann P, Leipner J, Stamp P, 1999. Chlorophyll fluorescence as a selection tool for cold tolerance of photosynthesis in maize (Zea mays L). J Exp Bot 50: 1533-1540
Frei OM, 2000. Changes in yield physiology of corn as a result of breeding in northern Europe. Maydi-ca 45: 173-183
Gilmour A, Gogel B, Cullis B, Thompson R, 2006. ASReml user guide release 2.0. VSN International Ltd, Hermel Hempstead.
Goddemeier ML, Wulff D, Feix G, 1998. Root-specific expression of a Zea mays gene encoding a novel glycine-rich protein, zmGRP3. Plant Mol Biol 36: 799-802
Godoy JA, Pardo JM, Pintortoro JA, 1990. A Tomato Cdna Inducible by Salt Stress and Abscisic-Acid - Nucleotide-Sequence and Expression Pattern. Plant Mol Biol 15: 695-705
Gower JC, 1966. Some distance properties of latent root and vector methods used in multivariate analysis. pp. 325-326
Guerra-Peraza, O, Leipner J, Reimer R, Nguyen HT, Stamp P, FrachboudY, 2010. Temperature at night affects the genetic control of acclimation to cold in maize seedlings. Maydica 56: 367-377 Hallauer AR, 1990. Methods used in developing
maize inbreds. Maydica 35: 1-16
Hoecker N, Keller B, Piepho HP, Hochholdinger, F, 2006. Manifestation of heterosis during early maize (Zea mays L) root development. Theor Appl Genet 112: 421-429
Holland J, Nyquist W, Cervantes-Martínez C, 2003. Estimating and Interpreting Heritability for Plant Breeding: An Update, pp. 9-112. In: Plant Breed-ing Reviews, vol 22. John Wiley & Sons Inc Holm S, 1979. A Simple Sequentially Rejective
Mul-tiple Test Procedure. Scand J Stat 6: 65-70 Hund A, Frachboud Y, Soldati A, Frascaroli E, Salvi
S, Stamp P, 2004. QTL controlling root and shoot traits of maize seedlings under cold stress. Theor thought to be proteins of the cell wall (Goddemeier et
al, 1998). Grp synthesis is induced by external stimuli like abscisic acid (ABA) (De Oliveira et al, 1990; Go-doy et al, 1990). Since ERAx is a response associa-tion and is usually classified as bx and bopt and since chilling stress is accompanied by an increase in the ABA concentration, Grp might be an appropriate can-didate for selecting genotypes with the expression of large amounts of Grp in the roots.
Conclusions
Most of the differences between the heterotic groups were at optimal temperature: the dents grew longer axile roots, and the flints produced a relatively larger proportion of lateral roots. This pattern was also observed for the detected marker-trait associa-tions. The dents carried more alleles increasing ERAx and more alleles increasing the sensitivity of ERAx to temperature extremes. In general, the majority of alleles showed a similar response to cold and heat (bopt and bx). The inverted allele effect (bx) at many loci indicates that the favorable effect of the different al-leles depends on temperature. The development of the heterotic groups was based on the selection of hybrids, i.e. only parents with good combining ability were retained in the groups. This raises the question as to whether the combination of alleles with different responses to temperature would enable the adapta-tion of the hybrid to a wider range of temperature. A good locus to test this hypothesis is that in bin 10.04, which has a temperature dependent effect on overall root morphology.
Appl Genet 109: 618-629
Hund A, Fracheboud Y, Soldati A, Stamp P, 2008. Cold tolerance of maize seedlings as determined by root morphology and photosynthetic traits. Eur J Agron 28: 178-185
Hund A, Reimer R, Messmer R, 2011. A consensus map of QTLs controlling the root length of maize. Plant Soil 344: 143-158
Hund A, Reimer R, Stamp P, Walter A, 2012. Can we improve heterosis for root growth of maize by selecting parental inbred lines with different temperature behaviour? Phil Trans R Soc B 367: 1580-1588
Hund A, Richner W, Soldati A, Fracheboud Y, Stamp P, 2007. Root morphology and photosynthetic performance of maize inbred lines at low temper-ature. Eur J Agron 27: 52-61
Hund A, Trachsel S, Stamp P, 2009. Growth of axile and lateral roots of maize: I development of a phe-notyping platform. Plant Soil 325: 335-349 Jompuk C, Fracheboud Y, Stamp P, Leipner J, 2005.
Mapping of quantitative trait loci associated with chilling tolerance in maize (Zea mays L) seedlings grown under field conditions. J Ex Bot 56: 1153-1163
Lawrence CJ, Seigfried TE, Brendel V, 2005. The Maize Genetics and Genomics Database. The Community Resource for Access to Diverse Maize Data. Plant Physiol 138: 55-58
Lunn JE, FurbankRT, 1999. Sucrose biosynthesis in C-4 plants. New Phytol 143: 221-237
McCully ME, 1999. Roots in soil: unearthing the com-plexities of roots and their rhizospheres. Annu Rev Plant Physiol Plant Mol Biol 50: 695-718 McWilliam JR, Griffing B, 1965.
Temperature-Depen-dent Heterosis in Maize. Aus J Biol Sci 18: 569-583
Nagel KA, Kastenholz B, Jahnke S, Van Dusschoten D, Aach T, Muhlich M, Truhn D, Scharr H, Ter-jung S, Walter A, Schurr U, 2009. Temperature re-sponses of roots: impact on growth, root system architecture and implications for phenotyping. Func Plant Biol 36: 947-959
Nietosotelo J, Ho THD, 1986. Effect of Heat-Shock on the Metabolism of Glutathione in Maize Roots. Plant Physiol 82: 1031-1035.
Piepho HP, 2000. A mixed-model approach to map-ping quantitative trait loci in barley on the basis of multiple environment data. Genetics 156: 2043-2050
Pritchard JK, Stephens M, Rosenberg NA, Donnelly P, 2000. Association mapping in structured popu-lations. Am J Hum Genet 67: 170-181
R Development Core Team, 2008 R: A language and environment for statistical computing. R Founda-tion for Statistical Computing, Vienna, Austria Rogers JS, 1972. Measures of Genetic Similarity and
Genetic Distance, pp. 145-153. In: Studies in Ge-netics, vol 7. Marshall R ed. University of Texas,
Austin, TX
Roitsch T, Gonzalez MC, 2004. Function and regula-tion of plant invertases: sweet sensaregula-tions. Trends Plant Sci 9: 606-613
Ruan YL, 2012. Signaling Role of Sucrose Metabo-lism in Development. Mol Plant 5: 763-765 Ruta N, Liedgens M, Fracheboud Y, Stamp P, Hund
A, 2010. QTLs for the elongation of axile and lat-eral roots of maize in response to low water po-tential. Theor Appl Genet 120: 621-631
Schaeffer ML, Sanchez-Villeda H, Coe E, 2008. Neighbors 2008 - Maize Genetics and Genomics Database
Schrag TA, Möhring J, Melchinger AE, Kusterer B, Dhillon BS, Piepho HP, Frisch M, 2010. Prediction of hybrid performance in maize using molecular markers and joint analyses of hybrids and paren-tal inbreds. Theor Appl Genet 120: 451-461 Sergeeva LI, Keurentjes JJB, Bentsink L, Vonk J, van
der Plas LHW, Koornneef M, Vreugdenhil D, 2006. Vacuolar invertase regulates elongation of Arabi-dopsis thaliana roots as revealed by QTL and mu-tant analysis. Proc Natl Acad Sci USA 103: 2994-2999
Shaw RH, 1988. Climate Requirement, pp. 609-638. In: Corn and Corn Improvement, 3rd edition.
Dud-ley JW ed. American Society of Agronomy, Madi-son, Wisconsin, USA
Stich B, Melchinger AE, Heckenberger M, Möhring J, Schechert A, Piepho HP, 2008a. Association mapping in multiple segregating populations of sugar beet (Beta vulgaris L). Theor Appl Genet 117: 1167-1179
Stich B, Möhring J, Piepho HP, Heckenberger M, Buckler ES, Melchinger AE, 2008b. Comparison of mixed-model approaches for association map-ping. Genetics 178: 1745-1754
Stone PJ, Sorensen IB, Jamieson PD, 1999. Effect of soil temperature on phenology, canopy develop-ment, biomass and yield of maize in a cool-tem-perature climate. Field Crop Res 63: 169-178. Timperio AM, Egidi MG, Zolla L, 2008. Proteomics
applied on plant abiotic stresses: Role of heat shock proteins (HSP). J Proteomics 71: 391-411 Trachsel S, Messmer R, Stamp P, Hund A, 2009.
Mapping of QTLs for lateral and axile root growth of tropical maize. Theor Appl Genet 119: 1413-1424
Trachsel S, Stamp P, Hund A, 2010a. Effect of high temperatures, drought and aluminum toxicity on root growth of tropical maize (Zea mays L) Seed-lings. Maydica 55: 249-260
Trachsel S, Stamp P, Hund A, 2010b. Growth of axile and lateral roots of maize: response to desicca-tion stress induced by polyethylene glycol 8000. Maydica 55: 101-109
Tuberosa R, Salvi S, Sanguineti MC, Maccaferri M, Giuliani S, Maccaferri M, Sanguineti MC, Landi P, 2003. Searching for quantitative trait loci
control-ling root traits in maize: a critical appraisal. Plant Soil 255: 35-54
Varney GT, Canny MJ, Wang XL, McCully ME, 1991. The branch roots of Zea. 1. 1st order branches, their number, sizes and division into classes. Ann Bot 67: 357-364
Verheul MJ, Vanhassel PR, Stamp P, 1995. Compari-son of Maize Inbred Lines Differing in Low-Tem-perature Tolerance - Effect of Acclimation at Sub-optimal Temperature on Chloroplast Functioning. Ann Bot 76: 7-14
Wallace B, 2000. A Natural Historian’s View of Het-erosis and Related Topics, pp. 41-45. In: Evolu-tionary Genetics: from molecules to morphology. Singh RP, Krimbas CB eds. Cambridge University Press, Camebridge
Wiggans RG, 1916. The number of temporary roots in cereals. J Am Soc Agron 8: 31-37
Zhao K, Aranzana MJ, Kim S, Lister C, Shindo C, Tang CL, Toomajian C, Zheng HG, Dean C, Marjoram P, Nordborg M, 2007. An Arabidopsis example of association mapping in structured samples. Plos Genetics 3