Rochester Institute of Technology Rochester Institute of Technology
RIT Scholar Works
RIT Scholar Works
Theses11-4-2020
Data Warehouse performance comparing Relational Database
Data Warehouse performance comparing Relational Database
Management Systems and the Hadoop-based NoSQL Database
Management Systems and the Hadoop-based NoSQL Database
system
system
Nazar Al-WattarFollow this and additional works at: https://scholarworks.rit.edu/theses
Recommended Citation Recommended Citation
Al-Wattar, Nazar, "Data Warehouse performance comparing Relational Database Management Systems and the Hadoop-based NoSQL Database system" (2020). Thesis. Rochester Institute of Technology. Accessed from
This Thesis is brought to you for free and open access by RIT Scholar Works. It has been accepted for inclusion in Theses by an authorized administrator of RIT Scholar Works. For more information, please contact
v
Data Warehouse performance comparing
Relational Database Management Systems and
the Hadoop-based NoSQL Database system
A Thesis
Presented to Faculty of
Rochester Institute of Technology
B. Thomas Golisano College
of
Computing and Information Sciences
_____________________________
In Partial Fulfillment
of the Requirements for the Degree
Master of Science
in
Information Science and Technology
_____________________________________________
by
Nazar Al-Wattar
NOVEMBER 4, 2020Rochester Institute of Technology
B. Thomas Golisano College
of
Computing and Information Sciences
Master of Science in Information Science and Technology
~ Thesis Approval Form ~
Student Name:
NAZAR AL-WATTAR
Thesis Title:
Data Warehouse performance comparing Relational Database
Management Systems and the Hadoop-based NoSQL Database
system
Project Area(s):
Application Dev.
√
Database
Website Dev.
(
√
primary area)
Game Design
HCI
eLearning
Networking
Project Mngt.
Software Dev.
Multimedia
System Admin. Informatics
Geospatial
Other
~ MS Thesis Committee ~
Name
Signature
Date
Edward Holden
Chair
Qi Yu
Committee Member
Michael McQuaid
Committee Member
ABSTRACT OF THE THESIS
Data Warehouse performance comparing
Relational Database Management Systems and
the Hadoop-based NoSQL Database system
by
Nazar Al-Wattar
Master of Science in Information Science
Rochester Institute of Technology, 2020
One of the biggest problems that many companies face nowadays is dealing with the huge
volumes of data that they generate daily. In the data-driven world all data needs to be stored,
organized and analyzed to get the required information that will help the administration to make
the right decision to support the next step of the company. Big Data and Business Intelligence have
become very popular terms in the business field, where Big Data highlights the tools that are used
to manage the huge volume of data. One of the Big Data tools is the Data Warehouse, which is
used to manipulate the massive amount of data, while the Business Intelligence (BI) focuses on
how we can analyze information from the huge volumes of data that support companies in
decision making
In this thesis, we will compare the implementation of the DW concepts using the Relational
Database Management Systems (RDBMS), specifically, SQL Server DB over the Hadoop system,
and then analyze the resource (CPU and RAM) consumption.
I prove that using the Hadoop system speeds up the process of manipulating these huge volumes
of data with very low cost, based on the nature of the Hadoop system that is efficient in processing
all kinds of structured, semi-structured, unstructured or raw data with minimum cost and high
efficiency in manipulating and storing massive amounts of data.
Keywords:
TABLE OF CONTENTS
ABSTRACT OF THE THESIS
______________________________________________________ vii
TABLE OF CONTENTS _________________________________________________________ viii
LIST OF FIGURES _______________________________________________________________x
CHAPTER 1 __________________________________________________________________ 1
INTRODUCTION ______________________________________________________________ 1
1.1 Statement of Problem _________________________________________________ 6
1.2 Thesis Objectives _____________________________________________________ 6
CHAPTER 2 __________________________________________________________________ 7
Systems Architecture __________________________________________________________ 7
2.1 Overview Hadoop Ecosystem Architecture _________________________________ 7
2.1.1 Overview Cloudera Distribution Hadoop Cluster (CDH) ______________________ 9
2.2 Microsoft SQL Server Architecture ______________________________________ 19
2.3 Background ________________________________________________________ 20
2.4 literature Review ____________________________________________________ 21
CHAPTER 3 _________________________________________________________________ 25
Research Environment ________________________________________________________ 25
3.1 Methodology _______________________________________________________ 25
3.2 Experiments ________________________________________________________ 29
3.3 Experiment Scenarios ________________________________________________ 37
CHAPTER 4 _________________________________________________________________ 43
Research Results _____________________________________________________________ 43
4.1 Client Case (YCSB Tool) _______________________________________________ 43
4.2 Database Administrator Case __________________________________________ 74
CHAPTER 5 _________________________________________________________________ 82
Results Analysis, Research Limitation and Future Work _____________________________ 82
5.1 Client Case (YCSB Tool) _______________________________________________ 84
5.2 Database Administrator Case _________________________________________ 103
5.3 Research Conclusion ________________________________________________ 110
5.4 Research Limitation_________________________________________________ 110
5.5 Future Work ______________________________________________________ 111
References ________________________________________________________________ 115
Appendix A __________________________________________________________________ 1
Appendix B __________________________________________________________________ 7
Appendix C _________________________________________________________________ 12
Appendix D _________________________________________________________________ 13
Appendix E _________________________________________________________________ 16
LIST OF FIGURES
PAGE
Figure 1: General architecture of a data warehouse (Inmon, 2005) _______________________________________ 2 Figure 2: Hadoop Ecosystem Components (Dataflair Team, 2019) ________________________________________ 8 Figure 3: The number of the users who are searching for the term ‘Hadoop’ (Dunning, 2015). _________________ 8 Figure 4: Cloudera Distribution for Hadoop (Hong, n.d.) ________________________________________________ 9 Figure 5: Hadoop Distributed Cluster File System Architecture (Jaiswal et al., 2017). ________________________ 10 Figure 6: MapReduce Architecture (“Hadoop MapReduce Tutorial”, n.d.) _________________________________ 12 Figure 7: Hive model architecture diagram (Capriolo et al., 2012). ______________________________________ 13 Figure 8: HBase Architecture (“Overview of HBase Architecture and its Components”, 2017) _________________ 14 Figure 9: Sqoop Framework functionality (Intellipaat Blog, 2017) _______________________________________ 15 Figure 10: Sqoop Hadoop Framework Architecture (Narisetti, 2018) _____________________________________ 15 Figure 11: Hue Architecture (JanbaskTraining, n.d.) __________________________________________________ 16 Figure 12: CDH Hue Architecture (Vulture, 2014) ____________________________________________________ 16 Figure 13: Hue Web-based Interface (“Introduction to Hue”, n.d.) _______________________________________ 17 Figure 14: Impala Architecture (DataFlair, n.d.) _____________________________________________________ 18 Figure 15: SQL Server Architecture (“What is SQL Server”, n.d.) _________________________________________ 19 Figure 16: Data Warehouse star schema ___________________________________________________________ 25 Figure 17: Data Warehouse snowflake schema ______________________________________________________ 26 Figure 18: Data Warehouse fact constellation schema ________________________________________________ 27 Figure 19: AdventureWorks2019 Reseller Sales Snowflake Schema ______________________________________ 28
ACKNOWLEDGEMENTS
Throughout the writing of this dissertation, I have received a great deal of support and assistance
from the people around me to complete this research and I would like to thank them by your name.
I would first like to thank my supervisor, Professor Edward, Holden whose expertise was
invaluable in formulating the research questions and methodology. Your insightful feedback
pushed me to sharpen my thinking and brought my work to a higher level.
In addition, I would like to thank my parents for their wise counsel and sympathetic ear. You are
always there for me. Finally, I could not have completed this dissertation without the support of
my spouse, Zinah, Saadoon, who provided all the required support, patience and time to finish up
this research as well as happy distractions to rest my mind outside of my research.
1
CHAPTER 1
INTRODUCTION
Before using Data Warehouses to store data, companies were deleting these data after
a period of time or keeping it just for their record. Later on, companies began to realize the
importance of data in determining the direction of the company in the data-driven world and
they started looking for the best solutions to store, organize, manipulate and analyze these data.
Companies found their needs satisfied in the Data Warehouse database.
In the past decade, Data Warehouse has been one of the best solutions for collecting, organizing
and consolidating data to support the decision makers in the company. Based on the nature of
the Data Warehouse, the main mode of the Data Warehouse is the consultation mode, due to
storing historical data rather than the real time data of the OLTP systems (Sebaa et al., 2017).
Data Warehouse is an environment more than a product that helps in strategic decisions to make
the right next move, by collecting the data from different systems and integrating it by separating
these data from the operational databases (Santoso, 2017).
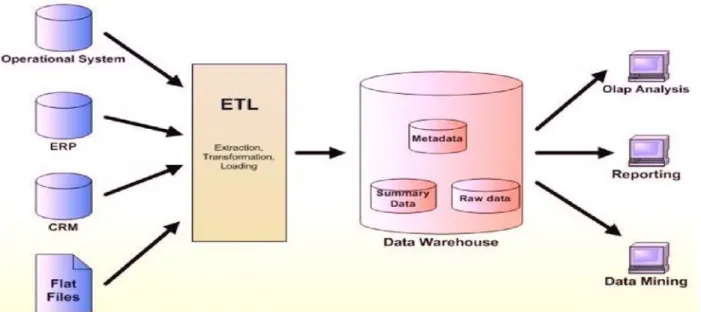
Data Warehouse needs to conduct some procedures on these data as they come in different
forms, these procedures are known as the ETL processes, where the DW extracts, transforms the
data, and cleans it before it gets loaded into the DW system, as shown in the general architecture
of data Warehouse figure 1 below.
Figure 1: General architecture of a data warehouse (Inmon, 2005)
To help the companies employ these data to get a better understanding of the market trend,
they needed to use some new technologies. One of the most popular technologies that are used
by various organizations and companies today, is Business intelligence (BI).
The term Business Intelligence (BI) refers to technologies, applications and practices for the
collection, integration, analysis, and presentation of business information. The purpose of
Business Intelligence is to support better business decision making (Leat, 2007).
BI has many tools that support these organizations to understand their consumers’ needs
through understanding and analyzing the information gained from the organization’s data. Data
Warehouse represents one of the most important BI components that provides good features to
store, organize and analyze data (Carniel et al., 2012).
Data Warehouse works to generalize and consolidate data into a multidimensional view, and that
helps BI tools to provide the information that the decision-makers need.
One of the beneficial tools that a Data Warehouse provides is Online Analytical Processing (OLAP)
tools, that provide the necessary interactive and effective analysis of data in a multidimensional
space (Chau et al., 2003).
A Data Warehouse database is a subject-oriented and nonvolatile database that can be used to
store huge amounts of historical data generated by the company. A Data Warehouse database
must support the analytical processing of these data in a high response time to support the
decision-making process (Pereira et al., 2015).
Data Warehousing technologies have been used to assist a variety of companies in decision
making like, retail, financial services, telecommunications, and healthcare (Chaudhuri & Dayal,
1997). The benefit of utilizing Data Warehouse is that the data needed to make decisions is
available to the appropriate end user at the appropriate time, and thus the data Warehouse is
considered as the central point of the data integration and the first step to convert the data
into information that benefits the companies.
Companies have used different systems to implement the DW like the Relational Database
Management System (RDBMS), NoSQL Database System, and Hadoop ecosystem and each
system has its own pros and cons.
Databases were previously the best solution, and are still in place today, to store data because
they provide the users with the best mix of simplicity, robustness, flexibility, performance,
scalability and compatibility (Plugge et al., 2010). RDBMS have been implemented and used by
different organizations and they were satisfying day-to-day business needs, through dealing with
static, query intensive data sets since these data sets were relatively small in nature (Salehnia,
2015).
RDBMS databases have used some of the features to satisfy the business need like the Atomicity,
Consistency, Isolation, Durability (ACID) properties, where Atomicity refers to the integrity in the
work, where the transaction will mark as incomplete if one part or more of the transaction was
not completed. Consistency points to the database status before and after the transaction to
make sure that the database is still stable and functional and to ensure work continuity. Isolation
stands for ensuring that there is no interference between the execution of multiple transactions
that are being processed at the same time. Durability ensures that the transaction will maintain
the same state even if the system goes down or a power outage occurs during the transaction
process (Jatana et al. 2012).
Regardless of the limitation in scalability features of the RDBMS databases, companies used it in
transaction-processing systems to help them in their decision making and planning, but the
increase in daily generated data made it hard to manage data with the existing storage
techniques and plain queries (Bhadani & Jothimani, 2016).
RDBMS has a high cost when it is related to the host scale and that represents the main limitation
with all the conventional relational database management systems, which means, to scale up in
the RDBMS databases, the company should add more expensive RAMs, CPUs and expensive
storage to the server that is being used to build the DW database and that would raise the cost
of the building process exponentially.
This growth in the data volumes has increased the relational database management system’s
problems and made it unable to handle this growth (Abdullah & Zhuge, 2015).
Organizations that use relational database management systems as the main method of data
storage in a Data Warehouse, start having problems in storing, organizing and analyzing these
volumes due to the weaknesses mentioned, especially in the scalability and expandability, and
the performance started to fall off (Chen et al. 2014).
Some of the websites generate massive amounts of data like the New York Stock Exchange that
generates 4-5 terabytes of data daily. Facebook is considered as a house of more than 240 billion
photos that grew to 7 petabytes monthly (White, 2015).
Day after day, the need has increased to find a suitable alternative that could provide the
scalability and expandability for the read and write operations over multiple servers to
manipulate these huge amounts of data generated by the company that is necessary to support
the decision-making process in the data Warehouse, instead of using the RDBMS databases that
have proven not to be the best choice for that (Gajendran, 2012).
Data Warehouses that were implemented in the RDBMS fell behind in processing and storing the
massive amounts of data that the devices, sensors of the IOT appliances, and the websites are
generating nowadays, because the data is moving too fast and coming in different structures that
might not fit into the RDBMS systems. With the expensive cost of storing all these amounts of
data, the need for a good alternative that can serve the purpose grew, and companies could not
ignore it anymore.
As the data volume started to grow in a massive way, a new term started to surface, which was
Big Data. Big Data can be defined as the multiple formats that the data can exist in. Big Data can
come in different levels of complexity, which have a lot of ambiguity that makes it hard to be
processed using the traditional methods or technologies that the companies were following to
process the small volume of data (Padhy, 2013).
Data that are included in the Big Data term comes in different format and from different sources
like the data that generated by the machines through the sensor networks, nuclear plants,
scanning and X-ray devices, data generated by the airplane engines, social media network data,
weather data, financial industry data, maintenance data, labor data and the list goes on
(Krishnan, 2013). To categorize the different kinds of data, we require some kind of framework
or philosophy.
Big Data stands on the 3 vectors philosophy, which are the Volume, the Velocity and the Variety.
Volume points to the data volumes that are generated by many machines today and by websites
like Twitter and Facebook (Azoumana, 2014). These devices and websites generate a huge
amount of data daily that can reach to billions of records. For example, Facebook generates more
than 900 million photos a day (David, 2018).
Velocity points to the speed of data generation and from the example above, we can see that the
social media networks handle a lot of posts and images daily. Variety points to the different
formats that these data can be generated with, as it is coming from different resources and many
of these resources generate semi-structured and unstructured data (David, 2018).
Nowadays, Big Data is a well-known term in the data processing field due to the variety of
technologies that Big Data offers to the industry (Krishnan, 2013). These technologies provide
the capability to process different formats of data.
1.1 Statement of Problem
For much of the past century, companies in the market did not realize how important consumers’
data was, so they could not take advantage of it; in today’s market, the key factors to taking the
most effective business decisions, and standing out amongst the competitive companies in the
market is the speed, the efficiency in processing the data coming from the consumers, and the
capability to scale out at no or low cost.
1.2 Thesis Objectives
The overall objective is to perform a comparative analysis between RDBMS and the Hadoop
ecosystem to determine the best technology to build a Data Warehouse. This will be
accomplished by building a 5-nodes cluster on Cloud to host the DW in Hadoop HBase. In
addition, the DW will be also hosted into MS SQL Server too. The performance from both systems
will be analyzed and compared in CPU, RAM and disks consumption, as well as the time required
to accomplish the work. In addition, the storage performance will be tested to determine which
system provides better data hosting services for business. This work is unique when compared
to other published papers because previous studies have not analyzed the use of clusters,
inspected the performance from database administrator perspective, or hosted the clusters in
the cloud.
CHAPTER 2
Systems Architecture
2.1 Overview Hadoop Ecosystem Architecture
Hadoop is one of the Big Data technologies and it is a good choice to solve the problem that the
RDBMS could not solve due to its capabilities in storing and manipulating huge amounts of data
in a fair amount of time and low cost (Lopez, 2014).
Hadoop is known as an open-source, Java-based programming framework that can work on
processing and storage of extremely large data sets that can reach to hundreds of terabytes in a
distributed computing environment (SIGOPS, 2003).
To support parallel and distributed processing of large volumes of data, many solutions involve
Hadoop technology. Hadoop is capable of performing analyses of large heterogeneous datasets
at unprecedented speeds (Taylor, 2010).
Figure 2: Hadoop Ecosystem Components (Dataflair Team, 2019)
The number of users that are searching about the term “Hadoop” has increased rapidly between
2004 and 2014, as in the figure below. As the number of users that are interested in Hadoop is
increasing day after day, the question has been shifted from how much Hadoop is ready for
production to what is the best way to leverage Hadoop and its NoSQL database management
capabilities to implement the project in a successful way (Dunning, 2015).
The ability to scale is one of the most important features in the database, and should be offered
at no extra cost - like adding more RAM, CPUs or storage to the server that is being used to build
the Data Warehouse - to process the increased volumes of data (Taylor, 2010).
2.1.1 Overview Cloudera Distribution Hadoop Cluster (CDH)
Cloudera Distribution Apache Hadoop cluster is the most famous cluster among all other Hadoop
distribution clusters. This cluster has been developed by the Cloudera Inc, which is a Palo
Alto-based American enterprise software company. This cluster has many features that have been
tested, completed and integrated into this cluster. These features provided by the Cloudera Inc.,
made it the most reliable cluster by many big data companies, and it is 100% open source. This
cluster provides variety of the Hadoop core services like Hive, Pig, Oozie, Hue, HBase, and Sqoop
(Menon et al., 2014).
Cloudera has developed and released many versions of this cluster and till writing this research,
Cloudera has release the CDH6.3x version.
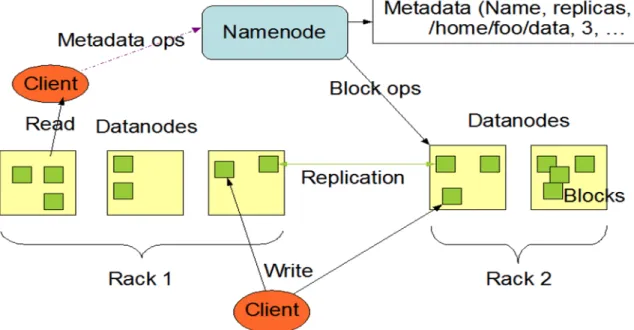
2.1.2 Overview Hadoop Distributed File System (HDFS)
The method that the Hadoop system follows to distribute the data over multiple clusters that can
be hosted into cheap computers made it a fault-tolerant storage system, and this system is
known as the Hadoop Distributed File System, or HDFS (Jaiswal et al., 2017).
Given that Hadoop is designed to scale up horizontally, it is a system that is capable of overriding
any failure in any of its storage parts without losing any data, due to the nature of the Hadoop in
storing the data into the HDFS by making 3 copies of the data and distributing them into different
clusters (Ibrahim et al., 2013).
Figure 5: Hadoop Distributed Cluster File System Architecture (Jaiswal et al., 2017).
The Hadoop system has provided the features that the end users did not find in the RDBMS, like
the high capability of processing large amounts of semi-structured and unstructured data, since
both NoSQL database and files allow the developer to use a wide spectrum of data formats
(Dunning, 2015).
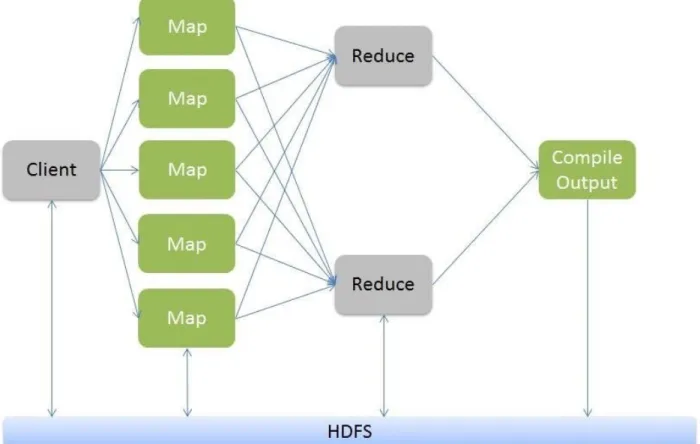
2.1.3 Overview MapReduce
One of the features that the RDBMS do not have is the high capability of processing massive
amounts of distributed data. Hadoop offers this feature through MapReduce, which is a software
framework that provides the processing of large data sets on computing clusters (Moon et al.,
2014).
MapReduce is a batch query processor that has the capability of processing ad hoc intensive
queries against the entire dataset, and get the results in a short amount of time (“Apache
Hadoop”, n.d.). The key aspect of the distributed computational work is dividing a large job into
a group of smaller tasks that run independently to deliver the work more quickly to other tasks
(Dunning, 2015).
Hadoop also comes with another important feature, which is the capability of writing some codes
in other languages like Python to process the datasets and deploy this code as scheduled jobs
(Taylor, 2010). Another feature of the Hadoop system is the Job and Task Tracker function, that
works to track the programs’ execution across the nodes of the cluster.
Figure 6: MapReduce Architecture (“Hadoop MapReduce Tutorial”, n.d.)
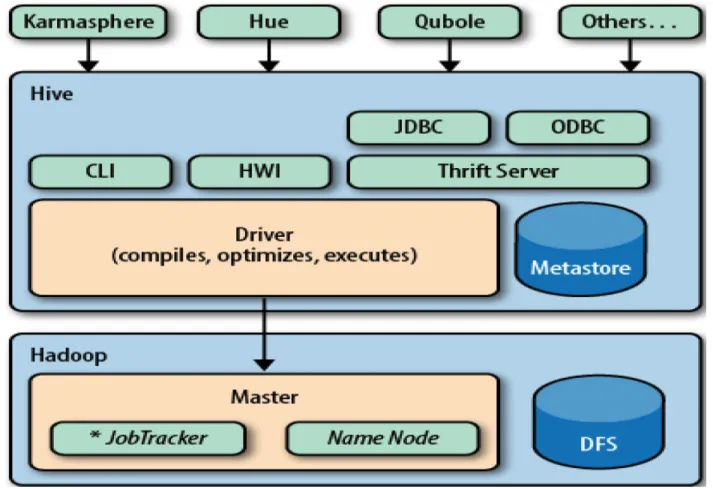
2.1.4 Overview Hive Framework
Hadoop comes with the support of writing SQL-Like queries that can be executed through the
Hive framework, that provides the capabilities to write ad hoc queries and do complex analysis.
(Krishnan, 2013).
Hive is known as a Data Warehouse framework that has been built on top of the Hadoop
ecosystem and developed at Facebook to generate summaries, reports, and analyses from the
data that resides in the Hadoop Distributed File System (HDFS). Hive manages a lot of complex
operations behind the scenes to extract data, by providing an editor that is capable of executing
ad hoc queries and using the HiveQL (Capriolo et al., 2012).
2.1.5 Overview Pig Framework
Pig is another framework that has been built on top of the Hadoop ecosystem that utilizes a
high-level data flow language named Pig Latin. Pig is useful for batch processing of data that is being
produced via the MapReduce programs by the compiler operations, which is one of the Pig’s
infrastructure components (Taylor, 2010).
2.1.6 Overview HBase Database
Hadoop system has another useful component that is capable of providing the database-style
interface called HBase. HBase is an open source project developed by Google as a part of Google's
BigTable architecture. HBase is designed to provide a high-performance and efficient storage that
supports the processing of large data sets on top of the Hadoop framework. HBase is not a
relational database - it is a NoSQL database - but it provides all the RDBMS ACID features. HBase
enables the developers to deploy their programs to read or write large amounts of data in a
voluminous data set, with no need to search through the entire sets of data (Krishnan, 2013).
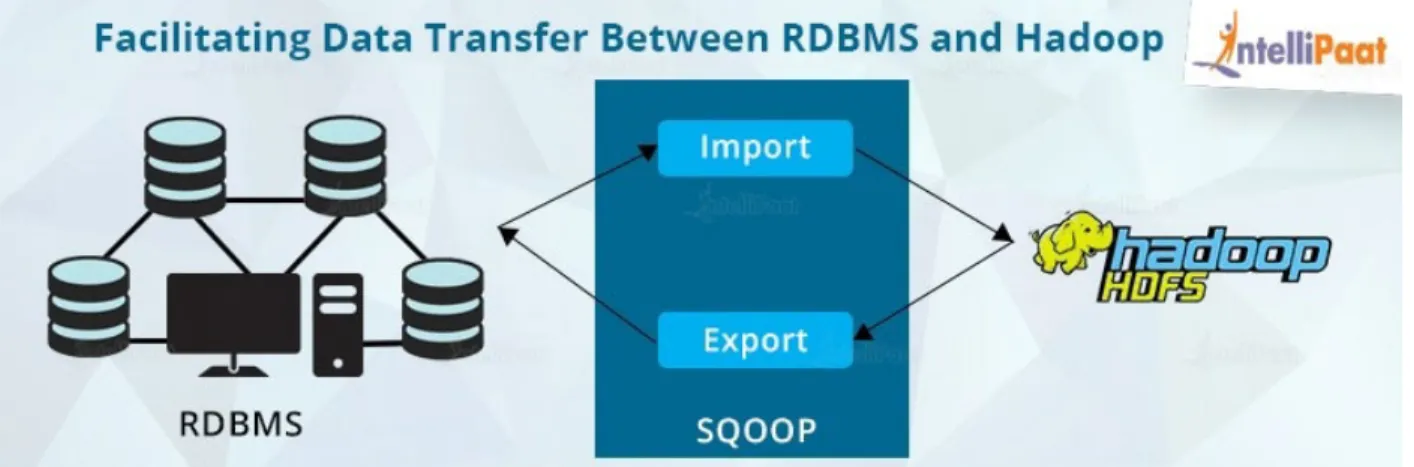
2.1.7 Overview Hadoop Framework Sqoop
The ability to connect to the RDBMS to extract valuable data is a crucial feature as most of the
companies store their important data in relational databases. Hadoop has a good tool that can
connect to different RDBMS and extract the data to the HBase. This tool is the open source
framework Sqoop that enables the users to extract structured data and import it into Hadoop,
and allows them to export it back after having finished the required processing on these data
(White, 2015).
Figure 9: Sqoop Framework functionality (Intellipaat Blog, 2017)
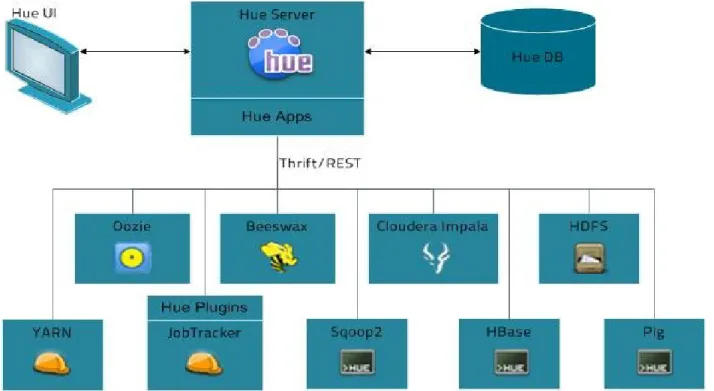
2.1.8 Overview Hue Framework
Hue is a web-based interactive query editor, connected to almost all Apache Hadoop
components, to enable the end user to interact with data warehouses.
The version of Hue that is being used in this experiment has been developed by the Cloudera
team and it provides a variety of services and features.
Figure 11: Hue Architecture (JanbaskTraining, n.d.)
Feature that Hue provide includes,
Hadoop API Access
Presence of HDFS File Browser
Browser and Job Designer
User Admin Interface
Massive Parallel Processing via Impala
Editor for Hive Query
Editor for Pig Query
Hadoop Shell Access
Workflows can access Oozie Interface
SOLR searches can get a separate interface
Figure 13: Hue Web-based Interface (“Introduction to Hue”, n.d.)
2.1.9 Overview Impala Query Execution Engine
Impala, known as a Massive Parallel Processing (MPP) query engine, works on top of other
Hadoop ecosystem components. Impala has many components, but the most important ones are
1-
Impala Daemon: a process that runs on every node in the CDH cluster.
2-
Impala Statestore: a process that runs to check the health of each Impala daemons and
collects the results back from all CDH cluster nodes.
3-
Impala Catalog Service: a process that transfers all the changes in the MetaStore or
Metadata from any Impala SQL statements to all Datanodes in Hadoop cluster.
2.2 Microsoft SQL Server Architecture
Figure 15: SQL Server Architecture (“What is SQL Server”, n.d.)
2.2.1 Database Engine
Database engine represents the core of the SQL Server and handles queries processing, memory
management, databases management, tables management, buffer management, thread and
task management, distributed query processing. Database engine has other parts like relational
engine and storage engine that handle data files managements, indexes and data pages through
managing the disk resources and SANs and some other tasks that are necessary to achieve the
work.
2.2.2 SQLOS
Underneath the database engine and the storage engine parts falls the sql server operating
system that known as SQLOS. SQLOS also is in charge of many tasks like managing the operating
system resources that associated with the sql server. These resources include I/O schedular and
completion, synchronization primitive, memory management, deadlock detection and
management, exception handling framework and some other tasks.
2.3 Background
Much research has been conducted to measure different aspects of implementing the Data
Warehouse into the Hadoop system, and on implementing the Data Warehouse into the RDBMS,
before this work. Some of them have provided some measures of the performance.
In this thesis, I’m not trying to redo the work that other researchers have done before. The aim
of this work is to find an efficient way of implementing the Data Warehouse either into the
Hadoop ecosystem or the RDBMS. An efficient way would imply the solution that provides the
companies with best response time to provide the data that the decision-makers need, the best
performance of their Data Warehouse system, the highest system availability, and the capability
to scale up/out at no or less cost between implementing the data Warehouse in the Hadoop
ecosystem or the RDBMS.
2.4 literature Review
Subhankar and Sourav Mazumdar (2015) have found that storing, organizing and
analyzing unstructured data that has been generated by the organizations is very important to
help the administration to make the right decision. Relational Database Management Systems
offered good solutions for decades because of their simplicity and integrity. RDBMS have
provided database users with the best mix of simplicity, robustness, flexibility, performance,
scalability and compatibility (Hubli et al., 2015).
Organizations need to use some sort of tools to analyze data and the most popular ones are the
Business Intelligence tools in general, and Data Warehouse in particular. Pereira, Oliveira, and
Rodrigues (2015) said “Data Warehouses are considered a core technology in the Business
Intelligence (BI) framework.”
Santoso (2017) found that the Data Warehouse provides a good mix between the concepts and
the technologies that are being used by the companies to manipulate the historical data that is
being extracted from the operational systems, and it aided the strategic decision maker when it
comes to the decision of the company’s next move.
The need to store high volumes of data has increased day by day and decision making requires
the organization to analyze these data, which is considered a serious challenge for many of them.
Pereira, Oliveira, and Rodrigues (2015) found that being able to store this large volume of data
efficiently and at the same time being able to provide fast, multi-dimensional analysis has
become an ever-increasing challenge for software companies and organizations' budgets.
Hubli, Anoop and Ankita (2015) found that the main limitations with conventional relational
database management systems (RDBMS) are that they are hard to scale with Data Warehousing.
One of the best solutions to solve horizontal scalability is Big Data. M. Chevalier et al. (2015),
found that new Big Data solutions offer horizontal scaling to avoid these single machine
constraints. Instead of storing data in a single machine, data can be distributed among several
machines.
Hu et al. (2017) found that the relational database system needs a static database schema, which
limits the scalability of the database structure and increases the preprocessing overhead of
ingestion. Also, the static schema requires having individual tables for each data type, which is
costly to construct and to maintain, and sequential data processing would be delayed, resulting
in longer Database write times, due to the atomicity, consistency, isolation, and durability
properties of RDBMS databases.
Many websites, social media networks and devices started to generate massive amounts of data
daily (White, 2015). Chen et al. (2014) found that the organizations and many companies that are
using the RDBMS as the main storage of their data have started facing many challenges in storing
these huge amounts of data, rather than manipulating it.
(Gajendran, 2012) found that the need to find a good alternative to take place of the RDBMS and
remove all the limitations of it in the scalability and expandability has become more urgent than
before. With the downgrade in the efficiency and the capacity to accommodate and process the
flood of the data that is being generated daily using the DW that is implemented in the RDBMS,
a new term started to shine in the data management industry - Big Data.
Big Data consists of multiple forms of data that can exist in different forms of complexities due
to the different resources of these data, which made the RDBMS’ life harder (Padhy, 2013).
Azoumana (2014) found that Big Data comes with a new philosophy that relies on three vectors,
Volume, Velocity, and Variety. David (2018) concluded that websites are now generating
unbelievable volumes of data like Facebook that generate more than 900 million photos daily,
which is considered the fastest data generation known yet. There is a need to find good tools to
process it efficiently.
Also, Krishnan (2013) found that Big Data tools became very popular due to the capabilities of
processing a wide variety of data formats, as the data is coming now in multiple formats like
structured, semi-structured and unstructured, unlike the data before that were in one format
which is the structured data.
One of the efficient tools that Big Data introduced was the Hadoop system. It was a good solution
for many problems that the RDBMS suffered from, like the limitation in the scalability, and the
high cost of conducting it (Lopez, 2014).
Hadoop has made a good shift in storing and processing high volumes of data using its unique
capabilities in processing these volumes in a distributed environment (Sigops, 2003). Jaiswal et
al. (2017) found that Hadoop uses an efficient system to distribute the data over multiple cheap
servers called Hadoop Distributed File System.
The mechanism that the HDFS uses - making three copies of the data and distributing them over
multiple clusters - makes Hadoop a good fault-tolerant system (Ibrahim et al., 2013).
Moon et al. (2014) found that Hadoop provides many good features that the end users were
looking for in the RDBMS. One of these features is the capability to process huge amounts of
distributed data; Hadoop could offer that through an open-source framework, known as
MapReduce. MapReduce has added a new dimension in processing large jobs by dividing them
into small chunks and processing parallelly and independently (Dunning, 2015).
Hadoop has offered a variety of features to enable the developer to write some code in different
languages, deploy that code and schedule it to process massive amounts of data with the
capability to track the execution of it (Taylor, 2010).
Krishnan (2013) found that Hadoop has abstracted the work and hides a lot of complexities,
which needs to be done in the lower level by having another open source framework called Hive.
Hive is saving a lot of time and effort by offering the HiveQL language that allows the developer
to write SQL-like queries to process the data and generate different images of the reports and
analyses (Capriolo et al., 2012).
Krishnan (2013) found that Hadoop is not only capable of manipulating semi-structured and/or
unstructured data. Hadoop, through another open source framework called HBase, is capable of
importing, processing and exporting the organizations’ valuable structured data. HBase is known
as a NoSQL database, but it provides all the RDBMS ACID features that enable the Hadoop to
process large volumes of data in a voluminous data set without any need to go through entire
sets of data.
White (2015) found Hadoop to be capable of connecting to different systems of the RDBMS. It
needs a good API to achieve that, i.e., the open source framework Sqoop, that comes in two
versions. Sqoop is used to provide the huge capabilities that Hadoop demands to achieve good
work when the matter is related to the RDBMS.
Our work is to investigate through these facts and prove that the Hadoop ecosystem is still the
first choice to build the Data Warehouse databases to support the organization in the crucial
process of strategic decision-making.
CHAPTER 3
Research Environment
3.1 Methodology
In order to test the hypothesis that we have put for this research, I generated a huge volume of
random data as the first step into Hadoop ecosystem and its frameworks, then export this data
into csv files, transfer it to MS SQL Server environment, import this huge volume of data from csv
files into MS SQL database, I chose the Microsoft SQL Server 2019 DB for that.
To organize the data into the Data Warehouse DB, there are multiple data modeling types or
schemas
, like Star Schema, Snowflake Schema and Fact Constellation Schema.
3.1.1 Star Schema
In this schema, each dimension is represented with only one-dimension table. This dimension
table contains a set of attributes. Figure 16 shows the sales data of a company with respect to
the four dimensions, namely time, item, branch, and
location. In the star schema there is a fact
table that will be in the center of the schema, this table will hold the keys of the other dimensions
as well as some other attributes.
3.1.2 Snowflake Schema
In the snowflake schema, some of the dimension tables are normalized; normalization is used to
split up the data into additional tables.
Snowflake schema is unlike Star schema in creating the dimensions table, where the dimension
table will be normalized in Snowflake schema. In figure 17, we can see that the item dimension
table in the previous figure 16 has been split into two-dimension tables named
item
and
supplier
tables, and the location dimension table split to
location
and
city
dimension tables. One of the
benefits of the normalization is to reduce data redundancy, and therefore, it becomes easy to
maintain the data and that would save storage space. However, on the other side, it would add
more complexity in building the queries and cause some overhead in executing it, due to adding
more joins.
3.1.3 Fact Constellation Schema (Galaxy Schema)
This schema has multiple fact tables. This schema is viewed as a collection of stars; hence, it is
also known as galaxy schema. Fact Constellation Schema works by splitting the original star
schema into more star schemas. Each star schema describes facts on another level of dimension
hierarchies. Figure 18 shows two fact tables, namely sales and shipping. The sales fact table is the
same as that in the star schema. The sales fact table also contains two attributes, namely
dollars_sold
and
units_sold
. In this schema, it is also possible to share dimension tables between
fact tables. For example, time, item, and location dimension tables are shared between the sales
and shipping fact table.
Figure 188: Data Warehouse fact constellation schema
In our work, we will apply the second type, which is the Snowflake Schema, and record how this
schema will be in performance, data storage space efficiency, query complexity level, data
redundancy volume into both SQL Server database and Hadoop Data Warehouses, and the
outcomes of these operations will determine the best solution to build the data Warehouse
database. This would help companies to choose the best, fastest solution to retrieve the data
that the company needs to make the final decision.
Figure 1919: AdventureWorks2019 Reseller Sales Snowflake Schema
3.1.4 Data Warehouse Build Considerations
There are some important things that would be considered while building DW databases include
but not limited,
Data quality. As the data may come from many different resources from all
departments of an organization, so building an efficient ETL process will be a good
way to make sure the data will have a high quality that could satisfy the user's needs.
Quality Assurance. As the DW users, like managers, will use the data in this DB to help
them in the decision-making process, so the data should have a high rate of accuracy.
Performance. This database will be used in providing data on time to support the
decision-making process. Then, one of the important things is to ensure that the
performance of this DB should be high and meet end-user expectations.
Cost. It is considered one of the most important things to any company or organization
today, so designing the DW database should not cost the company a lot of money.
For importing the data into the RDBMS from Hadoop ecosystem, data needs to be
exported from the Hadoop system to the RDBMS either by using the Hadoop Sqoop
framework or by the RDBMS API.
3.2 Experiments
The experiments will include all the information about the current work for the comparisons
between the two ecosystems, Hadoop and the RDBMS via the comparisons between HBase
database from Hadoop and MS SQL Server from RDBMs. Also, it includes the list of the obstacles
that this research has faced during the implementation of the experiments, the explanation of
each one and the solution to these challenges. The activities that covered in these experiments
to measure Data Warehouse database performance through monitoring performance statistics,
queries running time, and resources consumption.
This study aimed to build a 5-nodes cluster in Hadoop ecosystem to host the DW in HBase. Also,
this study aims to host the DW into MS SQL Server. However, this research will try to simulate
the real work in big data companies nowadays by processing huge volumes of data. To provide
both system with the required resources, this study will conduct these experiments and any
related work in the Cloud.
Amazon Web Services (AWS)cloud and the Elastic Compute Class (EC2)
have been chosen for that.
The technologies that have been used in this study include, the Linux Centos 7.4, Cloudera CDH
6.3.2 as Hadoop Cluster, HBase services version 2.1.0, Hive version 2.1.1, Hue version, 4.2.0,
Spark version 2.4.0, Impala version 3.2.0, HDFS version 3.0.0, Sqoop version 1.4.7, Windows
Server 2019 Data Center Edition, MS SQL Server 2019 Standard Edition (64-bit), version
15.0.4053.23 RTM as version level.
3.2.1 Hadoop CDH Cluster Configurations
The section will discuss the CDH cluster configuration and the challenges faced during this
procedure
1.
For Cloudera Manager and the Master node, m4.xlarge instance has been considered due
to the capabilities of this instance. The capabilities in providing the balance between the
compute, memory and networking resources, were the required features to complete the
experiments. Also, this instance has been considered because of the capability in
specifying the number of vCPUs, which is the thing that I need to manage the cluster
(“Amazon EC2 Instance Types”, n.d.), (see Appendix A).
2.
For the 4 worker nodes of the Hadoop cluster to handle the heavy load that will be on
these nodes, the instance d2.4xlarge has been chosen for each node, that has 16 vCPUs
and 64GB of Memory each.
D2 instances are considered the latest generation of the Amazon EC2 Dense-storage
instance. This type of instances was produced by AWS, to handle the high sequential read/
write workloads.
Moreover, this instance support accessing large amount of data, which is the goal of this
study (“Now available: D2 instances, the latest generation of Amazon EC2 Dense-storage
instances”, n.d.), (
see Appendix A).
Also, these instances utilize the Amazon Elastic Block Store (EBS). These instances are well
known for its high performance with the Amazon EC2, for both throughput and
transaction intensive workload. In addition, it provides a good support at any scale for a
variety of relational and non-relational databases and some other applications (“Amazon
Elastic Block Store”, n.d.), (
see Appendix A).
3.
Hadoop Cloudera Enterprise (CDH 6.2) has been picked up for creating the 5-nodes
cluster. I have chosen Cloudera CDH due to the wide spectrum of services that this cluster
provides, which serves the need of this study (“CDH Components”, n.d.)
4.
Then, because of its speed in deploying Cloudera cluster via providing the intuitive user
interface, I have chosen the Cloudera director to set the instances and then deploy CDH
cluster automatically (“Cloudera Director”, n.d.), (
see Appendix A).
5.
Cloudera Hadoop Impala has been chosen to support the query running process. Impala
provides a fast and interactive sql queries editor. The next step was to configure Impala
for a set number of cores and memory (“Cloudera Enterprise 6.3.x”, n.d.).
In addition, each instance has 16 vCPUs and 122 GB of RAM, and since we have 4 instances
(worker nodes) working for Impala, the total will be 64 vCPUs. I configured Impala to
utilize 50% of the total of vCPUs, which will be 32 vCPUs and 256 GB of RAM, to match
what I’m planning to use for the MS SQL Server.
6.
The final HBase database server configuration is
Service
Configuration
CPU
32vCPU
RAM
256GB
Disk
1.5TB
3.2.2 MS SQL Server Configuration
This section will discuss the configuration of the MS SQL Server.
1.
To provide the MS SQL Server database with the best resources, AWS R5 type instance
has been picked. R5 instances represent the next generation of the AWS memory
optimized instances that are designed for intensive workloads such as a high-performance
databases and other enterprise applications ("Amazon EC2 R5 Instances", n.d.).
3.
Then, I picked the AdntureWorks2019 database and the Reseller schema for this
experiment.
4.
For the configuration part, autogrowth value has changed from a percentage value to a
fixed megabyte value, based on the Microsoft documentation ("Define Auto-Growth
Settings for Databases", n.d.) (see Appendix B).
5.
Also, the MaxDOP value was left at the default value, which is zero. This means the server
will be allowed to leverage all the available vCPUs (“Configure the max degree of
parallelism Server Configuration Option”, n.d.).
Service
Configuration
CPU
32vCPU
RAM
256GB
Disk
1.5TB
3.2.3 Yahoo Benchmark tool Configuration
Yahoo! Cloud Serving Benchmark (YCSB) tool were used to support the tests from the client side.
This tool was developed by Yahoo team and widely used by different vendors to benchmark
different kinds of databases. This tool is used in this study to benchmark both databases, MS SQL
Server and HBase. The YCSB tool version ycsb-0.16.0 was considered for this experiment. The
newer version of this tool, version 17, was not considered due to some connectivity issues. The
tool can be found at:
https://github.com/brianfrankcooper/YCSB/releases/tag/0.16.0
3.2.3.1 Install YCSB Tool in Centos 7.4
This installation started by downloading YCSB tool version 0.16.0 for Centos OS. Also, the HBase
library was utilized based on the tool’s GitHub directions. The tool requires to create a table called
‘usertable’, which can handle a maximum of 10 columns. The default configuration was
considered for this setup. The following query were used to load data into the HBase database:
bin/ycsb run hbase20 P workloads/workloada – recordcount = 100 000 000 cp hbasesite.xml
-p table=usertable –-p columnfamily=family
. (see Appendix C)
3.2.3.2 Install YCSB Tool in Windows Server
In this second setup, YCSB tool was installed on Windows Server 2019. Also, Python version 2.7.10
was installed to help in calling the tool via the command line window (cmd). This tool was
installed and run based on the tool’s GitHub directions. Also, the tool, with the Windows setup
requires to install the 7-Zip tool, version (7z1900-x64).
JDBC driver API version (sqljdbc_8.4.1.0_enu) was another required component to maintain the
connectivity between the YCSB tool and the MS SQL Server database. Later, the required table,
named “usertable”, by the tool was created using the default configuration. The command below
was used to load the targeted records number, which was 100 million records.
C:\Python27\python.exe bin/ycsb load jdbc -P workloads/workloada -p recordcount=100 000 000 -P jdbc-binding/conf/db.properties -cp mssql-jdbc-8.4.1.jre11.jar -s.
(see Appendix D)
3.2.4 Data Generation Scenarios
3.2.4.1 Client Side
In this experiment, which was from a client perspective, data generation process started into
both systems after finishing the configuration in sections (3.2.3.1 &
3.2.3.2). The same tool was
used to generate the data into both databases. Commands shown below were used to generate
100 million records of data in each database.
In HBase
bin/ycsb load hbase20 -P workloads/workloada -t -p operationcount=1000 -p recordcount=1000
-cp hbase-site.xml -p table=usertable -p columnfamily=family -threads=1 -s
In Windows Server command window
cd C:\ycsb-0.16.0
C:\Python27\python.exe bin/ycsb load jdbc -P workloads/workloada -t -p
operationcount=1000 -p recordcount=1000 -P jdbc-binding/conf/db.properties -cp
mssql-jdbc-8.4.1.jre11.jar -p thread=1 -s
3.2.4.2
Database Administrator Side
In this experiment, which was conducted from a DBA perspective, data generation process
started after finishing the configuration in sections (3.2.1 &
3.2.2). The process included the steps
listed below.
1.
Data generating started into Cloudera Manager using Hadoop framework Impala through the
shell. This process took almost 20 hours to generate about 3TB of data (
see Appendix A)2.
The next step is to move the data into Hadoop HBase database (see Appendix A).3.
In addition, the FactReSellerSales table in MS SQL Server has 26 columns, but HBase
represents these columns by creating 26 rows in a document in data dictionary of the HBase
table, shown below.
4.
The ODBC driver for Impala was used to import generated data into MS SQL Server (see
Appendix B).
5.
The process in the previous step took a very long time to import the 3TB of data from Hadoop.
The estimated time was around +85 hours. Process has been cancelled to find another faster
method to reduce the cost and time.
6.
Later, data has been exported from Hadoop to csv files, then these csv files were later
imported into the MS SQL Server.
7.
Also, with the csv file case, the operation was painful and took +24 hours to import almost
1.5TB of data.
8.
Once the data volume started exceeding 1.5TB, which was +200 million records, the MS SQL
Server started throwing system exception type of “
OutOfMemoryException
”, due to the
resources limitation.
9.
Therefore, the extra data volume has been dropped from the Hadoop HBase to match the
data in the MS SQL Server.
3.3 Experiment Scenarios
In this experiment, two scenarios will be covered. The first one from a client perspective and the
second scenario from a database administrator perspective to inspect the performance from
both sides.
3.3.1 Client Benchmark Tool Scenario
In this section, the YCSB tool workloads were used during this experiment will be discussed.
Running Core Workloads
After loading 100 million records into both databases, HBase and MS SQL Server, the workload
provided by the tool’s team were started. Core workloads have been considered for this
experiment. These workloads can be found in this link:
https://github.com/brianfrankcooper/YCSB/wiki/Core-Workloads
3.3.1.1 Workload A: Update heavy workload
This workload has a mix of 50/50 reads and writes. An application example is a session store
recording recent actions.
3.3.1.2 Workload B: Read mostly workload
This workload has a 95/5 reads/write mix. Application example: photo tagging; add a tag is an
update, but most operations are to read tags.
3.3.1.3 Workload C: Read only
This workload is 100% read. Application example: user profile cache, where profiles are
constructed elsewhere (e.g., Hadoop).
3.3.1.4 Workload D: Read latest workload
In this workload, new records are inserted, and the most recently inserted records are the most
popular. Application example: user status updates; people want to read the latest.
3.3.1.5 Workload E: Short ranges
In this workload, short ranges of records are queried, instead of individual records. Application
example: threaded conversations, where each scan is for the posts in a given thread (assumed
to be clustered by thread id).
3.3.1.6 Workload F: Read-modify-write
In this workload, the client will read a record, modify it, and write back the changes. Application
example: user database, where user records are read and modified by the user or to record user
activity.
In this experiment, the concentration was on the main workload templates that provide the load
on both systems. Core workloads A, B, C and F were considered for this experiment. These
workloads will provide variety in the desired operations and the load on each system during the
experiment.
In addition, each one of the chosen workloads was tested with a number of records started at
1k, 10k, 100k, 1 million, 10 million, until 100 million.
Moreover, another factor was considered, which is the Thread number. Thread number
represents the number of virtual cores that will be available to a system to complete the work.
Number of 1, 2, 4, 6, 8, and 10 of threads were considered for each operation.
In addition, due to the long time that the workload F took with the 100 million records, this
workload was run using 10 threads only.
To run each workload of the chosen core workloads, the command below was used.
In HBase
bin/ycsb run hbase20 -P workloads/workloada -t -p operationcount=1000 -p recordcount=1000
-cp hbase-site.xml -p table=usertable -p columnfamily=family -threads=1 -s
In Windows Server command window
cd C:\ycsb-0.16.0
for run
C:\Python27\python.exe bin/ycsb run jdbc -P workloads/workloada -t -p
operationcount=1000 -p recordcount=1000 -P jdbc-binding/conf/db.properties -cp
mssql-jdbc-8.4.1.jre11.jar -p thread=1 -s
3.3.2 Database Administrator Scenario
In this scenario, this study tried to simulate the real work that is being conducted on daily basis
by any Big Data database administrator. This comparison between the Hadoop HBase database
and the MS SQL Server database was conducted through utilizing the native tools that each
system provides. The steps were:
1.
Run intensive queries and monitor the performance and the resources consumption.
2.
Normal databases daily operations that are being conducted by any DBA were considered
for this scenario. Operations include Select, Insert, Update and Delete operations to
inspect the performance of each database performance for number of records starting at
1k, 10k, 100k, 1Mil, 10Mil, and until 100Mil.
3.
Measure operations: speed of data retrieve, insertion, deletion, and updating thousands
to a hundred million records. Also, monitor the performance and resources consumption
during each operation.
4.
Also, monitor the number of bytes that each system will transfer to complete each
operation.
5.
Impala query editor shell was used to run queries on HBase, while MS SQL Server
Management studio was used for the MS SQL Server database.
6.
Operations statistics were collected using each system’s native report tool. In Hadoop,
statistics from Profile and Summary were used.
7.
MS SQL Server provides different reporting tools. Query plan statistics, Client query
statistics and Resources Monitor metrics were used in my work.
3.3.2.1 Hadoop HBase Database Case
1.
For Select,
query below has been used to retrieve targeted data
SELECT
salesordernumber, productkey, orderdatekey, duedatekey,
shipdatekey, resellerkey, employeekey, promotionkey, currencykey,
salesterritorykey, salesorderlinenumber, revisionnumber, orderquantity,
unitprice, extendedamount, unitpricediscountpct, discountamount,
productstandardcost, totalproductcost, salesamount, taxamt, freight,
carriertrackingnumber, customerponumber, orderdate, duedate, shipdate
FROM
hbase.factresellersales
LIMIT
CAST
(100000000 AS INT)
2.
For insert,
query below has been used to insert targeted number of records
insert into
hbase.factresellersales2
(salesordernumber, productkey,
orderdatekey, duedatekey, shipdatekey, resellerkey, employeekey,
promotionkey, currencykey, salesterritorykey, salesordernumber_2,
salesorderlinenumber ,revisionnumber, orderquantity, unitprice,
extendedamount, unitpricediscountpct, discountamount, productstandardcost,
totalproductcost, salesamount, taxamt, freight, carriertrackingnumber,
customerponumber, orderdate, duedate, shipdate) select salesordernumber,
productkey, orderdatekey, duedatekey, shipdatekey, resellerkey, employeekey,
promotionkey, currencykey, salesterritorykey, salesordernumber,
salesorderlinenumber, revisionnumber, orderquantity, unitprice,
extendedamount, unitpricediscountpct, discountamount, productstandardcost
,totalproductcost , salesamount, taxamt, freight, carriertrackingnumber,
customerponumber, orderdate, duedate, shipdate from
default.factresellersaleshbaseresults
limit
# of Records
3.
For Update,
two scenarios were considered. First one was to update small string and
second one long update to observe how each system will perform under scenario.
a.
Short String
insert into
hbase.factresellersales2
(salesordernumber,
carriertrackingnumber) select salesordernumber, '
20
'
From
hbase.factresellersales
b.
Long String
insert into
hbase.factresellersales2 (salesordernumber, orderdate) select
salesordernumber,
'Testing with a Long text string to see how more data to
update will impact the update operation speed'
From
hbase.factresellersales
4.
For delete,
to complete the number of records condition, data that was created
through the insert operations were used.
DELETE FROM
[hbase.factresellersales]
3.3.2.2 MS SQL Server Database Case
1.
For Select,
query below has been run to retrieve the data
SELECT TOP
(# of Records)
FROM
[AdventureWorksDW2019].[dbo].[FactResellerSales];
2.
For insert,
query below has been run to insert the targeted number of records
FROM
[AdventureWorksDW2019].[dbo].[FactResellerSales];
3.
For Update,
two scenarios have been considered. First one is to update small string and
second one long update.
a.
Short String
Update
[AdventureWorksDW2019].[dbo].[FactResellerSales]
Set
[CarrierTrackingNumber] = 20
b.
Long String
Update
[AdventureWorksDW2019].[dbo].[FactResellerSales]
Set
OrderDate = 'Testing with a Long text string to see how more data to
update will impact the update operation speed'
4.
For delete,
to complete the number of record condition, data that was created
during the insert operations, were used.
CHAPTER 4
Research Results
4.1 Client Case (YCSB Tool)
In this section, data that were collected in the second experiment will be listed. This experiment was conducted from a client perspective and by running each core workloads and collecting the reports that the YCSB tool provides.
4.1.1 Load Data
In this part, statistics will be listed for each system in generating a specific number of random data records.
4.1.1.1 Running Time (ms)
In this case, each system’s performance was inspected by generating a different number of records. Statistics below were recorded.
DB\Records
1000
10000
100000
1000000
10000000 100000000
SQL Server 1437 7986 74584 755989 7893807 48905665HBase 2271 12532 96786 720285 12887140 14074835 By looking at the data in that chart 4.1.1.1, we can identify that the HBase outperformed the MS SQL Server this time. The HBase and MS SQL Server showed kind of close performance at the operations below than the 10 million. However, the MS SQL Server demanded a longer time to complete the work at 10 and 100 million of operations. So, HBase was better than MS SQL Server in this scenario.