Petr Olmer
Charles University, Faculty of Mathematics and Physics, Prague, Czech Republic Abstract
Data mining and text mining refer to techniques, models, algorithms, and pro-cesses for knowledge discovery and extraction. Basic definitions are given to-gether with the description of a standard data mining process. Common models and algorithms are presented. Attention is given to text clustering, how to con-vert unstructured text to structured data (vectors), and how to compute their importance and position within clusters.
1 Introduction
The final purpose of data collecting is to extract knowledge. Data mining and text mining are means to such knowledge extraction.
According to the Gartner Group, “Data mining is the process of discovering meaningful new correlations, patterns and trends by sifting through large amounts of data stored in repositories, using pattern recognition technologies as well as statistical and mathematical techniques.” [5]
Data mining has many definitions. Ref. [4] defines data mining as “the analysis of (often large) observational data sets to find unsuspected relationships and to summarize the data in novel ways that are both understandable and useful to the data owner.”
To summarize these definitions, data mining is a process of nontrivial extraction of implicit, pre-viously unknown and potentially useful information from data. Such information is called knowledge, and it can be identified as patterns or relationships.
Data mining works with large amounts of data. Because of the large amounts, the knowledge hidden in the data is not visible at first sight and it must be discovered. It implies that at the beginning of the process the knowledge is not known. The identified patterns and relationships can be new and surprising.
In short, data mining is the process of transforming the data into knowledge. Knowledge is what matters; it is implicit, previously unknown and potentially useful. If there is no knowledge, data is useless.
Data in data mining means structured, relational data. Text mining works with unstructured data— texts. One of the text mining tasks is to convert unstructured texts to structured data.
Data mining takes advantage of advances in the fields of artificial intelligence and statistics. Both disciplines have been working on problems of pattern recognition and classification. Both communities have made great contributions to the understanding and application of neural nets and decision trees.
Data mining does not replace traditional statistical techniques. Rather, it is an extension of statis-tical methods that is in part the result of a major change in the statistics community. The development of most statistical techniques was, until recently, based on elegant theory and analytical methods that worked quite well on the modest amounts of data being analyzed. The increased power of computers and their lower cost, coupled with the need to analyze enormous data sets with millions of rows, have al-lowed the development of new techniques based on a brute-force exploration of possible solutions. New techniques include relatively recent algorithms like neural nets and decision trees, and new approaches to older algorithms such as discriminant analysis. By virtue of bringing to bear the increased computer power on the huge volumes of available data, these techniques can approximate almost any functional form or interaction on their own. Traditional statistical techniques rely on the modeler to specify the functional form and interactions.
Statistical approach is used in the “top down” data mining where we query databases in order to satisfy a hypothesis (“Is is true that. . . ”). Other data mining processes are based on “bottom up” approaches where we interrogate a database in order to generate new hypotheses based on rigorous statistical correlations. There is no hypothesis to be confirmed or displaced in this case.
Algorithms and models are often taken from machine learning. Data mining algorithms are learn-ing algorithms, and machine learnlearn-ing models like decision trees or classification rules are very proper to model knowledge.
2 Data mining process
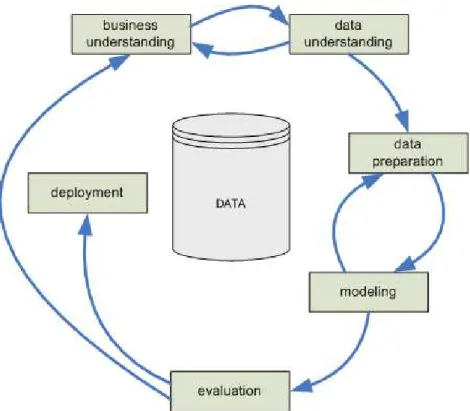
Data mining process was standardized by the CRISP-DM project (CRoss Industry Standard Process for Data Mining) [6]. The process is being developed as industry- and tool-neutral.
The typical components of a data mining process are shown in Fig. 1. The process life cycle containes the following tasks [7].
TheBusiness Understanding phase focuses on understanding the project objectives and require-ments from a business perspective, and then converting this knowledge into a data mining problem definition, and a preliminary plan designed to achieve the objectives.
TheData Understanding phase starts with an initial data collection and proceeds with activities in order to get familiar with the data, to identify data quality problems, to discover first insights into the data, or to detect interesting subsets to form hypotheses for hidden information.
TheData Preparationphase covers all activities to construct the final dataset (data that will be fed into the modeling tool(s)) from the initial raw data. Data preparation tasks are likely to be performed multiple times, and not in any prescribed order. Tasks include table, record, and attribute selection as well as transformation and cleaning of data for modeling tools. The final dataset is usually organised as a relational denormalized table. The table rows are called instances, the table columns are called attributes. The instances are assumed of being not related.
In theModelingphase, various modeling techniques are selected and applied, and their parameters are calibrated to optimal values. Typically, there are several techniques for the same data mining problem type. Some techniques have specific requirements on the form of data. Therefore, stepping back to the data preparation phase is often needed.
At the Evaluation phase the model (or models) that appears to have high quality, from a data analysis perspective is evaluated. Before proceeding to final deployment of the model, it is important to more thoroughly evaluate the model, and review the steps executed to construct the model, to be certain it properly achieves the business objectives. A key objective of the evaluation phase is to determine if there is some important business issue that has not been sufficiently considered. At the end of this phase, a decision on the use of the data mining results should be reached.
TheDeploymentphase is needed when the system is developed for a distinctive party (client). The gained knowledge will need to be organized and presented in a way that the client can use it. Depending on the requirements, this phase can be as simple as generating a report or as complex as implementing a repeatable data mining process.
Data mining is hardly a stand-alone process. It is often integrated to data warehousing processes. Data understanding and data preparation phases are parts of data warehouse. In this lecture, these phases were intentionally left out focusing on the modelling phase.
3 Data mining models and algorithms
The most common data mining tasks are description, estimation, prediction, classification, clustering, and association [5].
Fig. 1:CRISP-DM process life cycle
descriptions often suggest possible explanations for such patterns and trends. The results of the data mining model should describe clear patterns that are amenable to intuitive interpretation and explanation. Decision trees are suited well for descriptive tasks.
In classification, there is a target categorical variable which could be partitioned into several classes or categories. For example, temperature (as a number in degrees) can be partitioned to high, middle, and low temperature. The data mining model examines a large set of records, each record con-taining information on the target variable as well as a set of input or predictor variables. This data set is called the training set. The algorithm “learns about” which combinations of variables are associated with which target categories. It would look at new records with no information about target variable available, and assign classification to the new records. Common data mining methods used for classification are k-nearest neighbor, decision tree, and neural network.
Estimationis similar to classification except that the target variable is numerical rather than cat-egorical. Models are built using “complete” records, which provide the value of the target variable as well as the predictors. Then, for new observations, estimates of the value of the target variable are made, based on the values of the predictors. The field of statistical analysis supplies several venerable and widely used estimation methods. These include point estimation and confidence interval estimations, simple linear regression and correlation, and multiple regression. Neural networks may also be used for estimation.
Predictionis similar to classification and estimation, except that for prediction, the results lie in the future. Examples of prediction tasks include predicting the price of a stock three months into the future, or predicting the percentage increase in traffic deaths next year if the speed limit is increased. Any of the methods and techniques used for classification and estimation may also be used, under appropriate circumstances, for prediction. These include the traditional statistical methods of point estimation and confidence interval estimations, simple linear regression and correlation, and multiple regression, as well as data mining and knowledge discovery methods such as neural network, decision tree, and k-nearest neighbor methods.
Clusteringrefers to the grouping of records, observations, or cases into classes of similar objects. A cluster is a collection of records that are similar to one another, and dissimilar to records in other clus-ters. Clustering differs from classification in that there is no target variable for clustering. The clustering task does not try to classify, estimate, or predict the value of a target variable. Instead, clustering algo-rithms seek to segment the entire data set into relatively homogeneous subgroups or clusters, where the similarity of the records within the cluster is maximized and the similarity to records outside the cluster is minimized. Clustering is often performed as a preliminary step in a data mining process, with the result-ing clusters beresult-ing used as further inputs into a different technique downstream, such as neural networks. Common methods include hierarchical clustering, k-means clustering, and Kohonen networks.
Theassociation task for data mining is the job of finding which attributes “go together”. Most prevalent in the business world, where it is known as affinity analysis or market basket analysis, the task of association seeks to uncover rules for quantifying the relationship between two or more attributes. Association rules are of the form “if antecedent, then consequent”, together with a measure of the sup-port and confidence associated with the rule. Examples of association tasks include investigating the proportion of subscribers to a company’s cell phone plan that respond positively to an offer of a service upgrade, or finding out which items in a supermarket are purchased together and which items are never purchased together.
The algorithms and methods are covered by any standard data mining book ( [1]– [5]. We describe decision trees, classification rules, association rules, and k-nearest neighbor. Clustering is described in the next section devoted to text mining.
3.1 Decision trees and classification rules
Decision trees are used for predictive tasks. The main data structure is in this case a tree. Its inner nodes test a particular attribute against a constant. Its leaf nodes classify all instances that reach the leaf.
Classification rules are an alternative to decision trees. For each branch in the tree there exists an IF–THEN rule. Rules are not ordered. In any order, they lead in the same result. This approach is unambiguous, but often more complex than necessary.
Widely used approach is to use an ordered set of classification rules. The execution order is given. The rules can be partial, but they can be wrong out of context.
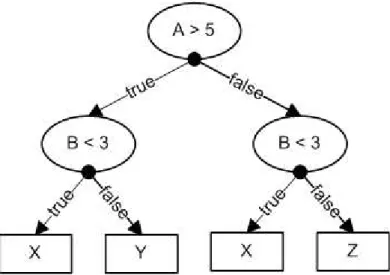
Example: The attributes A and B (numbers) are tested. Classification classes are called X, Y, and Z. The decision tree is shown in Fig. 2.
Classification rules taken directly from the tree are as follows: IF A > 5 AND B < 3 THEN CLASS = X
IF A > 5 AND B >= 3 THEN CLASS = Y IF A <= 5 AND B < 3 THEN CLASS = X IF A <= 5 AND B >= 3 THEN CLASS = Z
These rules can be executed in any order. We can rewrite them to IF B < 3 THEN CLASS = X
IF B >= 3 AND A > 5 THEN CLASS = Y IF B >= 3 AND A <= 5 THEN CLASS = Z
These rules are simpler, and they can be still executed in any order. They can be rewrite as partial rules:
IF B < 3 THEN CLASS = X IF A > 5 THEN CLASS = Y CLASS = Z
These rules must be executed in the given order. The first rule satisfied defines the class, the rest of them are not executed. In this example, the rule IF A > 5 THEN CLASS = Y is wrong out of context. It is executed only if B < 3 is not satisfied.
Unordered classification rules are used in boolean closed worlds with two classification classes, yesandno. Onlyyesrules are given. If no given rule is satisfied, the answer isno.
The basic algorithm for classification rules is called 1R: for each attribute {
for each value of that attribute { count how often each class appears find the most frequent class
rule = assign the class to this attribute-value }
calculate the error rate of the rules }
choose the rules with the smallest error rate
Other algorithms for decision trees and classification rules comprise Naive Bayes algorithm, re-cursive ID3 or PRISM [3].
3.2 Association rules
Association rules are of the IF–THEN structure too, but they can predict any attribute or their combina-tion, and they are not intended to be used together as a set.
For each rule IFantecedent THENconsequent we count its support and accuracy (confidence). Support is the probability that a randomly selected instance will fulfill both the antecedent and con-sequent, and accuracy is the conditional probability that a randomly selected instance will fulfill the consequent given that the instance fulfils the antecedent.
There can be an outstanding number of association rules, and algorithms for classification rules are very inefficient. To create association rules, rules with a given minimal support are generated, and their accuracy is tested.
3.3 K-nearest neighbor
K-nearest neighbor (KNN) is an example of lazy learning method for predictive tasks. Methods are called lazy learning if they postpone all the computation until an explicit request for a prediction is received. No explicit structure is built.
A new instance is compared with existing ones based on a simple distance metric like “count attribute values in common”. Closest K instances are used for classification (majority, average etc.). The algorithm itself is very simple, the dificult part lies in choosing properkand distance metric [5].
4 Text mining
Text mining is similar to data mining, but it is applied to free unstructured texts. It can be used for grouping together similar documents (clustering), classifying documents into taxonomy, finding out the probable author of a document etc. Documentis one of the main terms in text mining. It is a fragment of text that is to be considered as the unit. It can be book or just a paragraph; in the case of the Web it is usually a web page.
In this section, text mining will be explained based on a real project called DIGEST [12], [9]. The goal of the project is to cluster technical news from web sites in the real time. In the DIGEST project, a news headline is considered as a document. To cluster documents, their importance and relations is to be computed, as will be shown later.
The premise of the DIGEST project is that technical news has meaningful and meaning-forming headlines. This premise can be extend to all serious news, not only the technical ones. Under such circumstances it is sufficient to define a document as a headline only, instead of the whole news text.
This approach is powerful. An amount of text is decreased radically, because a headline consists of several words, and most of them are absolutely significant for the task. A headline is normally one simple sentence, and there is no need of difficult natural language processing. A headline exhibits the tight topic focus and reliable structure [11].
Only web sites with RSS support are considered. RSS channel (source) is an XML file that de-scribes the current contents of a web site. For each site item (article, news) there is its name, a short description, and a hyperlink to the item. Publishing date and time can be included too.
4.1 Converting unstructured text to structured data
The set of documents is denoted asD. The set of terms is defined and denoted asT.
Term is a keyword (or a category) and a document is represented by relations to these keywords. Such a representation is called document-based intermediate form [8]. For example, the documentGates wants to cooperate with Nokiacan be related to the termsMicrosoftandNokia.
Terms are symbolic labels with no additional knowledge.
A basic well-known algorithm represents a document as a vector indexed byT, with values 1 or 0 (the documentisoris notrelated to the index) [8]. This approach has the following two disadvantages: This representation does not express how much is a document related to the terms, and the terms them-selves create an orthogonal base, so they are independent. However it is very common that terms are related to each other.
Both disadvantages can be solved by introduction of term ranks and expressions [9]. The vectors are computed in a monotone (fuzzy) measure. For each term its trank is defined. It expresses how important the term is:
trank :T → h0,1i. (1)
Expression is a regular expression that is searched for in documents. The set of expressions is denoted as E. Ed ⊆Eis the set of expressions found in the documentd. erankexpresses how much an expression
is related to terms:
erank :E×T → h0,1i. (2)
For example, if the expressionGatesis found in a document, it can be related both to the termsBill Gates andMicrosoft. Via expressions, two or more terms can be bound together.
By this, aflat ontology is defined. The ontology consist of terms only. There is nois-arelation (i.e. it is flat), but the terms are not orthogonal, they can be bound.
Now it can be expressed how much ia document is related to terms. It is computed in a commuta-tive monoid(h0,1i,0, ω), whereωis a binary operation:
(∀a)(∀b)(a ω b=a+ (1−a)·b). (3)
Ωis defined for a setA={a1, a2, . . . , an}:
Ω
a∈Aba=ba1ω ba2ω . . . ω ban. (4)
This definition is correct, because ω is a commutative and associative operation. In addition, Ω is a monotone measure, and it can very well describe a situation when a document is related to a term because of two or more expressions.
For each document and term it is defined how much a document related to a term:
Tbag: D×T → h0,1i (5)
where
Tbag(d, t) = trank(t)· Ω
e∈Ed
erank(e, t). (6)
Tbag(d)can be understood as a vector indexed by terms:
Tbag(d) = (Tbag(d, t1),Tbag(d, t2), . . . ,Tbag(d, tmax)). (7)
Hence each documentdis represented by itsTbag(d). 4.2 Cluster analysis
The following two classifiers are interesting: how important is a document itself and how much is it related to other documents.
For each RSS channel,rrankis defined. It expresses how important the channel is:
rrank:R→ h0,1i. (8)
rrankcan be redefined as
rrank:D → h0,1i (9)
with the meaning ofrrank(d) = rrank(r), where the documentdis from the RSS channelr. To express the importance measure,irankandarankare introduced:
irank :D→ h0,∞), (10) irank(d) = v u u tX t∈T 2 Tbag(d, t), (11)
arank(d) = irank(d)·rrank(d). (12) 7
The measureirankdescribes how (much) important a document is within the ontology. Its combi-nation withrrankbrings us nearer to the importance relative to other documents.
Because the documents are represented as vectors in the space of terms, the cosine similarity between two vectors can be used. Then, to cluster documents means to group documents with similar characteristics together. dcos:D×D → h0,1i, (13) dcos(di, dj) = P t∈TTbag(di, t) Tbag(dj, t) irank(di) irank(dj) . (14)
Note thatdcosis symetric, e.g.dcos(di, dj) = dcos(dj, di).
The dcos looks similar to the normalized tfidf that is widely used [10]. The tfidf weight (term frequency–inverse document frequency) is a statistical measure used to evaluate how important a word is to a document in a collection or corpus. The importance increases proportionally to the number of times a word appears in the document but is offset by the frequency of the word in the corpus. Variations of the tfidf weighting scheme are often used by search engines to score and rank a document’s relevance given a user query.
Now the predicaterelatedcan be defined. Documentdisrelatedto a set of documentsDrel⊆D
if and only if
max
e∈Dreldcos(d, e) = maxe∈D dcos(d, e)>0. (15) However,dcosvalues close to 0 are not relevant. Experiments suggest the value 0.4 that is used in the following algorithm.
The reason for the classification described above is the following. In the DIGEST project, we want to show the documents on a web page, and we want to present them in clusters. Clusters are defined by the predicate related. First we show the most important document, and then we show its cluster (its related documents).
The algorithm is as follows. D24andD48stands for documents not older than 24 and 48 hours, respectively.
D0 = D
24 D00 = D
48
while D0 is not empty {
Drel = 0
show the document d0∈D0 with the maximum arank
insert d0 to Drel
remove d0 from both D0 and D00
order D00 with respect to d
cos with d0 in the descending order
for each d00∈D00 with dcos(d00, d0)>0.4 {
if d00 is related to D
rel {
show d00
insert d00 to Drel
remove d00 from both D0 and D00
} } }
The clusters are created sequentially. A new document is added into a cluster, if its similarity (dcos) with the main cluster document is the highest one from the all unclustered documents, and its most similar document is already in the cluster. This is why the setD00needs to be ordered.
The initial setsD24 andD48 express what we want to accomplish: to show the important news from the last 24 hours combined with related news not older than 2 days.
5 Conclusion
Data mining techniques can be applied to data gathered from experiments in many scientific domains. It is used in astronomy, physics, medical imaging, or bioinformatics. The data sets are high dimensional and large scale, and parallel algorithms are often used [13].
Ref. [14] can be used to find more info about data mining and text mining. Ref. [15] brings interesting mining results.
References
[1] M. Kantardzic, Data Mining: Concepts, Models, Methods, and Algorithms, John Wiley & sons, 2003.
[2] M. J. A. Berry, G. S. Linoff, Data Mining Techniques for Marketing, Sales, and Customer Rela-tionship Management, John Wiley & sons, 2004.
[3] I. H. Witten, E. Frank,Data Mining, Practical Machine Learning Tools and Techniques, Elsevier, 2005.
[4] D. Hand, H. Mannila, P. Smyth,Principles of Data Mining, MIT Press, 2001. [5] D. T. Larose,Discovering knowledge in data, John Wiley & sons, 2005. [6] CRISP-DM,http://www.crisp-dm.org.
[7] CRISP-DM Process Guide and User Manual,http://www.crisp-dm.org/download.htm. [8] A.-H. Tan, Text Mining: The State of The Art and The Challenges, in Proceedings of PAKDD99
Workshop 1999.
[9] Petr Olmer,On Text-Mining of Technical News, in Proceedings of DATAKON 2004.
[10] F. Sebastiani, Machine Learning in Automated Text Categorization, in ACM Computing Surveys, Vol. 34, No. 1, March 2002.
[11] D. A. Smith,Detecting and Browsing Events in Unstructured Text, in Proceedings of SIGIR Con-ference, Tampere, 2002.
[12] DIGEST (PREHLED, only in Czech),http://prehled.net
[13] R. L. Grossman (ed.),Data Mining for Scientific and Engineering Applications, Kluwer Academic Publishers, 2001.
[14] KDnuggets,http://kdnuggets.com
[15] Data Mining: Text Mining, Visualization and Social Media,http://datamining.typepad.com