cancer registry, national screening programme and Clinical Practice Research Datalink. Bmc Cancer, 17. p. 11. ISSN 1471-2407 DOI: https://doi.org/10.1186/s12885-017-3129-4
Downloaded from: http://researchonline.lshtm.ac.uk/3983554/
DOI:10.1186/s12885-017-3129-4
Usage Guidelines
Please refer to usage guidelines at http://researchonline.lshtm.ac.uk/policies.html or
alterna-tively [email protected].
R E S E A R C H A R T I C L E
Open Access
Do pre-diagnosis primary care consultation
patterns explain deprivation-specific
differences in net survival among women
with breast cancer? An examination of
individually-linked data from the UK West
Midlands cancer registry, national
screening programme and Clinical Practice
Research Datalink
M. Morris
*, L. M. Woods, K. Bhaskaran and B. Rachet
Abstract
Background:In England and Wales breast cancer survival is higher among more affluent women. Our aim was to investigate the potential of pre-diagnostic factors for explaining deprivation-related differences in survival.
Methods:Individually-linked data from women aged 50–70 in the West Midlands region of England, diagnosed with breast cancer 1989–2006 and continuously eligible for screening, was retrieved from the cancer registry, screening service and Clinical Practice Research Datalink. Follow-up was to the end of July 2012. Deprivation was measured at small area level, based on the quintiles of the income domain of the English indices of deprivation. Consultation rates per woman per week, time from last breast-related GP consultation to diagnosis, and from diagnosis to first surgery were calculated. We estimated net survival using the non-parametric Pohar-Perme estimator.
Results:The rate of primary care consultations was similar during the 18 months prior to diagnosis in each deprivation group for breast and non-breast symptoms. Survival was lower for more deprived women from 4 years after diagnosis. Lower net survival was associated with more advanced extent of disease and being non-screen-detected. There was a persistent trend of lower net survival for more deprived women, irrespective of the woman’s obesity, alcohol, smoking or comorbidity status. There was no significant variation in time from last breast symptom to diagnosis by deprivation. However, women in more deprived categories experienced significantly longer periods between cancer diagnosis and first surgery (mean = 21.5 vs. 28.4 days,p= 0.03). Those whose surgery occurred more than 12 weeks following their cancer diagnosis had substantially lower net survival.
(Continued on next page)
* Correspondence:[email protected]
Faculty of Epidemiology and Population Health, Department of Non-Communicable Disease Epidemiology, London School of Hygiene & Tropical Medicine, Keppel St, London WC1E 7HT, UK
© The Author(s). 2017Open AccessThis article is distributed under the terms of the Creative Commons Attribution 4.0 International License (http://creativecommons.org/licenses/by/4.0/), which permits unrestricted use, distribution, and reproduction in any medium, provided you give appropriate credit to the original author(s) and the source, provide a link to the Creative Commons license, and indicate if changes were made. The Creative Commons Public Domain Dedication waiver (http://creativecommons.org/publicdomain/zero/1.0/) applies to the data made available in this article, unless otherwise stated.
(Continued from previous page)
Conclusions:Our data suggest that although more deprived women with breast cancer display lifestyle factors associated with poorer outcomes, their consultation frequency, comorbidities and the breast cancer symptoms they present with are similar. We found weak evidence of extended times to surgical treatment among most deprived women who were not screen-detected but who presented with symptoms in primary care, which suggests that treatment delay may play a role. Further investigation of interrelationships between these variables within a larger dataset is warranted.
Keywords:Breast cancer, Socioeconomic inequalities, Primary care, Consultation, Survival, Early Diagnosis, Pathways, England
Background
In England and Wales there are substantial socio-economic differentials in breast cancer survival, with sur-vival being relatively high among more affluent women [1, 2]. There is increasingly strong evidence that these are due in part to later stage of disease at presentation [3, 4] and differences in timeliness of diagnosis [5, 6]. Other potential drivers of late stage at diagnosis include health system delays in primary and secondary care (practitioner delays) [7, 8] and differences in patients’underlying char-acteristics [9–11] and lifestyle choices [12–16].
Past research has focused on the appraisal by patients of the seriousness of their symptoms [10], and the possible sources of delay after presentation using patient experi-ence surveys and audit data [17–20]. However, to date there has been little reporting of the connection between these patterns and the survival of the same women.
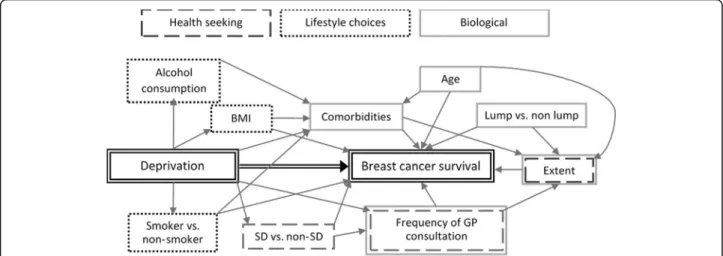
Our aim was to investigate the potential of pre-diagnostic factors for explaining deprivation differences in survival using the factors shown in the conceptual framework in Fig. 1. This shows the potential links be-tween deprivation and the outcome of breast cancer sur-vival, and patients’ biological, lifestyle, and health seeking characteristics. The primary outcomes examined were: the rate of primary care consultation; the time
from last breast-related GP consultation to diagnosis, and from diagnosis to first surgery; and net survival. We first describe deprivation-specific variations in women’s baseline characteristics, pre-diagnostic primary care con-sultations patterns, symptom presentation, and time in-tervals from symptom report to diagnosis. We then examine how net survival varies with deprivation and with each of these covariates. To do so, we used individually-linked data from primary care, the screening service and the cancer registry.
Methods
Data sources and study population
The West Midlands Breast Screening Quality Assurance Reference Centre provided data on a cohort of women aged 50–70, diagnosed with primary malignant breast cancer from 1 April 1989 to 31 March 2006 and eligible for screening. This dataset included women’s screening status, their deprivation category and inpatient hospital stays from Hospital Episode Statistics (HES). Follow-up was complete up to the end of July 2012 for all women. A subset of these data was linked to the General Practice Research Database (GPRD, now subsumed into the Clin-ical Practice Research Datalink, CPRD), which contains routinely collected data from primary care including
symptoms, diagnoses, tests, therapies and lifestyle-related information. Only women registered in a practice which had met a set of basic data quality criteria for the full 12 months prior to the woman’s diagnosis were included.
Variables
Deprivation
Deprivation was measured using the income domain of the English indices of deprivation derived from admin-istrative data pertaining to the years 2001, 2005 and 2008 [21–23]. These scores are defined for the Lower Super Output Areas that existed at the 2001 census (LSOAs, approximately 1500 people). Each woman was assigned to a deprivation category derived from the score temporally closest to her date of diagnosis and on the basis of her address of residence. The scores were split in five categories based on the quintiles of the na-tional distribution of the areas. Women were grouped for some analyses into two categories: less deprived (quintiles 1 and 2) and middle and more deprived (quintiles 3, 4 and 5).
Other covariables
Age at diagnosis was grouped into five-year age bands. Women were categorised as either “screen-detected” or
“not screen-detected”. The latter included women diag-nosed with interval cancers (when a women’s last screening attendance had resulted in a negative screen and she had not yet been invited to a subsequent screening), lapsed and non-attenders at screening. These are the women whose cancer was detected symptomatically.
Using information on tumour size, node involvement and presence of metastases from the cancer registry database, we defined “extent of disease” for each woman as: localised (confined to the organ of origin), regional(spread to adjacent muscle, organ, fat, connect-ive tissue or regional lymph nodes), anddistant(distant metastases).
Patient characteristics for each woman were derived from the CPRD data. Smoking (non- or ex-smoker, current smoker), alcohol consumption status (non-, ex-, current drinker), and body mass index (BMI; <25 kg/m2, 25 to <30 kg/m2, 30+ kg/m2[24, 25]) were all extracted from the patient records. Comorbidities, identified from the CPRD records using lists of National Health Service Read Codes (which are the principal method of coding clinical information in primary care), were combined into a Charlson score [26]. The Charlson score was also derived from the HES data. The higher of the two (HES vs. CPRD) was taken in each case as the patients’final comorbidity score.
Primary care consultations
Primary care consultations in the 18 months before diagno-sis were derived from the CPRD data. These were cate-gorised as“breast-related”or“not breast-related”. A breast-related consultation was one which included any mention of a breast symptom in the Read code list [27]. We also in-cluded those where the doctor had noted“mammography”,
“female cancer of the breast”, “breast examination” and other breast-related codes. These were identified by searches of Read code descriptions (Additional file 1). These were not all necessarily related to symptom presenta-tion, but some would have indicated a suspected diagnosis. However, they all pre-dated histologically-confirmed diag-nosis and so were counted as a consultation about the breast that might have then led to diagnosis of breast cancer. Breast symptoms were grouped into those involving a lump (including fibroadenoma, nodularity, cyst, axillary and cervical lymphadenopathy), or not (nipple-related: bleeding, retraction, discharge, Pagets’ nipple, pain; and other: skin changes, breast infection, breast pain). Time in days from a woman’s last breast-related consultation at the GP to diagnosis, and from diagnosis to first surgery (within 18 months) were calculated for women whose cancer was not detected through screening and who also reported a breast symptom in primary care.
Statistical analysis
Consultation rates per woman per week for both breast and non-breast symptoms were calculated along with their 95% confidence intervals. Chi-squared tests and non-parametric tests for trend for continuous variables [28] were used to examine the association between deprivation and co-variables. Small numbers precluded multivariable analyses for these data. All analyses were carried out in Stata 14 [29].
We estimated net survival for women using the non-parametric Pohar-Perme estimator [29, 30] by deprivation and for each covariable. We stratified the net survival estimates for each deprivation group by each covariable. Net survival provides an estimate of survival from the can-cer itself, adjusting for expected mortality from other causes. We derived individual estimates of expected mor-tality from ethnic-specific deprivation-adjusted life tables for England and Wales [31]. We applied locally-weighted regression to smooth the survival estimates [32, 33] with a conservative degree of smoothing to maintain the variabil-ity evident in the more sparse data. Where data were very sparse, smoothing was not performed.
Results Sample
Among 28,885 women in the West Midlands dataset, 786 (2.72%) could be linked to CPRD primary care rec-ord. The matching proportion ranged from 0% in 1989
to a maximum of 4.96% in 2002, and was 3.25% in the last year of data available, 2006. The matched sample of women were similar to the cohort in relation to their age and distribution of extent of disease at diagnosis. Fewer women were diagnosed in the period before 1995 (p< 0.001) and a greater proportion were screen-detected, both reflecting the increasing coverage of the CPRD over time (Additional file 1: Table S1A). Women in the sample were more likely to be alive at the end of follow-up (p< 0.001), and less likely to be deprived (p< 0.001). Net survival was comparable overall and by deprivation (Additional file 1: Figure S1A).
Sixty women had no recorded consultations in surgery with a doctor in the 18 months before diagnosis. Of the remaining 726 patients, the number of consultations with a doctor ranged from 1 to 52, with a mean of 14.3. Half of all women reported no breast symptoms in the primary care setting during the 18 months before diag-nosis (50.1%), whilst 40.8% had one breast-related con-sultation. The remaining 9.0% had more than one breast-related consultation, with a mean of 2.4 per woman and a maximum of 6.
Consultation rate
The rate of consultation was similar during the 18 months prior to diagnosis in each deprivation group, for both breast and non-breast symptoms (Fig. 2). A rise in the overall rate of consultations was seen from 3 months before diagnosis for breast-related tions. The majority of the rise in breast-related consulta-tions was among women whose cancer was not screen-detected. Consultation rates did not vary by age, period, extent of disease, BMI, smoking or alcohol consumption. Associations between co-variables and deprivation Women in the more deprived groups were more likely to have had their cancer identified through screening (p = 0.013), and were more likely to have regional or distant spread of disease (p= 0.045). They were also less likely to be alive at the end of follow up (p= 0.008) (Table 1). In addition, the primary care data showed that deprived women were more likely to be current or ex-smokers, have a higher BMI, but were less likely to be current drinkers. There was no association between deprivation and having a comorbidity at diagnosis, nor the number of distinct breast symptoms reported, nor whether those who had a breast-related consultation presented with a lump symptom or not (Table 2).
Net survival by deprivation
Survival was lower for more deprived women from 4 years after diagnosis (Fig. 3). There was a suggestion that more deprived groups experienced worse survival,
though the apparent trend was compatible with chance variation.
Net survival by covariables
Lower net survival was associated with more advanced extent of disease and not being screen-detected. There was some evidence that reporting a non-lump symptom led to poorer survival (among those not screen-detected who reported a symptom).
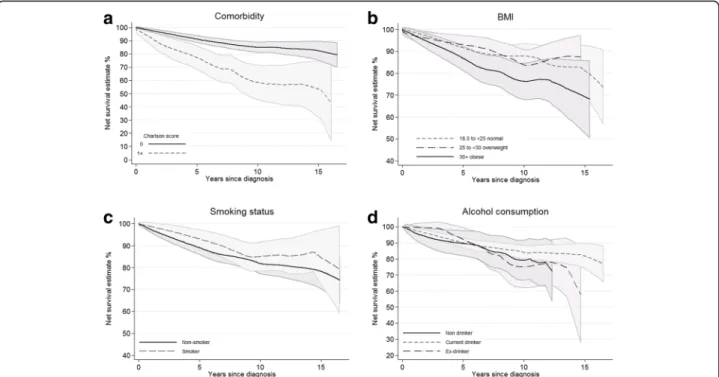
The presence of comorbidity was strongly associated with poorer net survival, especially over longer time pe-riods (Fig. 4a), and there was also some evidence that obesity was also associated with poorer outcomes (Fig. 4b). There was little evidence of difference in net survival from breast cancer by smoking status, or by al-cohol consumption status (Fig. 4c and d).
We examined the potential interaction between deprivation and each of these co-variables by deriving net survival for each of their sub-groups. Throughout, there was a persistent trend of lower net survival for more deprived women. This disadvantage was present ir-respective of the woman’s obesity, alcohol, smoking or
Fig. 2Consultation rates in the 12 weeks prior to diagnosis by deprivation: women diagnosed in West Midlands with invasive breast cancer 1989–2006 found within the CPRD dataset (N= 786); abreast-related symptoms,bnon-breast-related symptoms
Table 1Distribution of co-variables by deprivation quintile among all women (N= 786)
Total Least deprived 2 3 4 Most deprived p-valuea
n (%) n (%) n (%) n (%) n (%) n (%)
Total 786 (100) 211 (100) 213 (100) 140 (100) 112 (100) 110 (100)
Vital status at end of follow up
Alive 567 (72.1) 165 (78.2) 154 (72.3) 106 (75.7) 76 (67.9) 66 (60.0) 0.008 Dead 219 (27.9) 46 (21.8) 59 (27.7) 34 (24.3) 36 (32.1) 44 (40.0) Age groups 50–54 191 (24.3) 49 (23.2) 57 (26.8) 29 (20.7) 27 (24.1) 29 (26.4) 0.707 55–59 174 (22.1) 48 (22.7) 48 (22.5) 35 (25.0) 21 (18.8) 22 (20.0) 60–64 216 (27.5) 66 (31.3) 58 (27.2) 33 (23.6) 33 (29.5) 26 (23.6) 65–70 205 (26.1) 48 (22.7) 50 (23.5) 43 (30.7) 31 (27.7) 33 (30.0) Extent of disease at diagnosis
Localised 437 (55.6) 127 (60.2) 118 (55.4) 81 (57.9) 59 (52.7) 52 (47.3) 0.045 Regional 255 (32.4) 64 (30.3) 65 (30.5) 45 (32.1) 39 (34.8) 42 (38.2) Distant 24 (3.1) 3 (1.4) 5 (2.3) 3 (2.1) 4 (3.6) 9 (8.2) Missing 70 (8.9) 17 (8.1) 25 (11.7) 11 (7.9) 10 (8.9) 7 (6.4) Screening groups Screen-detected cancer 316 (40.2) 112 (53.1) 119 (55.9) 64 (45.7) 65 (58.0) 74 (67.3) 0.013 Not screen-detected cancer 434 (55.2) 91 (43.1) 83 (39.0) 67 (47.9) 45 (40.2) 30 (27.3)
Missing 36 (4.6) 8 (3.8) 11 (5.2) 9 (6.4) 2 (1.8) 6 (5.5) Period of diagnosis 1989–1994 81 (10.3) 18 (8.5) 22 (10.3) 13 (9.3) 11 (9.8) 17 (15.5) 0.011 1995–2000 283 (36.0) 79 (37.4) 64 (30.0) 57 (40.7) 32 (28.6) 51 (46.4) 2001–2006 422 (53.7) 114 (54.0) 127 (59.6) 70 (50.0) 69 (61.6) 42 (38.2) Smoking status Non- or ex-smoker 541 (68.8) 159 (75.4) 154 (72.3) 94 (67.1) 74 (66.1) 60 (54.5) 0.002 Current smoker 222 (28.2) 45 (21.3) 55 (25.8) 42 (30.0) 33 (29.5) 47 (42.7) Missing 23 (2.9) 7 (3.3) 4 (1.9) 4 (2.9) 5 (4.5) 3 (2.7)
Alcohol consumption status
Non-drinker 84 (10.7) 17 (8.1) 13 (6.1) 19 (13.6) 12 (10.7) 23 (20.9) <0.001 Current drinker 569 (72.4) 161 (76.3) 171 (80.3) 96 (68.6) 72 (64.3) 69 (62.7) Ex-drinker 81 (10.3) 19 (9.0) 16 (7.5) 14 (10.0) 18 (16.1) 14 (12.7) Missing 52 (6.6) 14 (6.6) 13 (6.1) 11 (7.9) 10 (8.9) 4 (3.6) BMI (kg/m2) < 25 kg/m2 305 (38.8) 84 (39.8) 99 (46.5) 53 (37.9) 40 (35.7) 29 (26.4) 0.001 25 to <30 235 (29.9) 73 (34.6) 50 (23.5) 43 (30.7) 32 (28.6) 37 (33.6) 30+ 189 (24) 41 (19.4) 49 (23.0) 29 (20.7) 32 (28.6) 38 (34.5) Missing 57 (7.3) 13 (6.2) 15 (7.0) 15 (10.7) 8 (7.1) 6 (5.5) Charlson score 0 684 (87) 191 (90.5) 185 (86.9) 124 (88.6) 93 (83.0) 91 (82.7) 0.202 1+ 102 (13) 20 (9.5) 28 (13.1) 16 (11.4) 19 (17.0) 19 (17.3) aP
-values are derived fromX2
tests for categorical variables and non-parametric tests for trend for continuous variables (BMI, breast-related consultations). All tests exclude missing values
comorbidity status (Additional file 1: Figure S2B). Fur-thermore, the magnitude of the survival difference was similar for all co-variables.
Time from last breast-related consultation to diagnosis and from diagnosis to surgery
We examined variations in the time elapsed from last symptom report (last breast-related consultation) to can-cer diagnosis among women whose cancan-cer was not screen-detected and who reported breast symptoms in primary care (N= 331). We also analysed the time elapsed from diagnosis to first surgery within 18 months of diagnosis for women whose diagnosis date was re-corded earlier than the date of their surgery (N= 212).
There was no significant variation in time from last breast symptom to diagnosis by deprivation or any other co-variable (Table 3), although women in the most de-prived group appeared to have longer waiting times than
the other four quintiles, as did obese women, and women who did not present with a breast lump.
By contrast, there was evidence that women in more deprived categories experienced longer periods between cancer diagnosis and first surgery: 21.5 days in quintiles 1, 2 and 3 compared to 28.4 days for quintiles 4 and 5 (p-value 0.03). Among women in the study, those diag-nosed with distant disease had longer mean time to sur-gery compared with those with either regional or localised disease, but this difference may have reflected chance variation (p= 0.14).
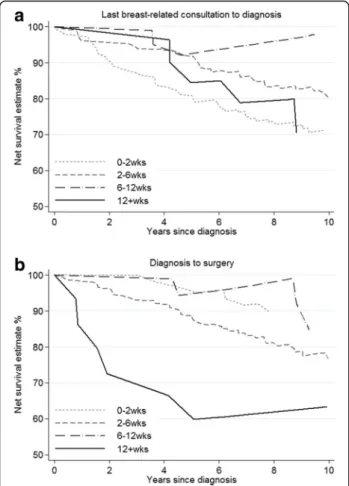
Among these same non-screen-detected women there was little evidence of survival differences by time from last breast-related consultation to diagnosis within the first 5 years. After this, women for whom the time inter-val from consultation to diagnosis was 43–84 days (6– 12 weeks) had higher survival, although not significantly so (Fig. 5a). Conversely, those whose surgery occurred Table 2Distribution of co-variables by deprivation quintile among women who were not screen-detected (N= 434)
Total Least deprived 2 3 4 Most deprived p-valuea
n (%) n (%) n (%) n (%) n (%) n (%)
Total 434 (100) 112(100) 119 (100) 64 (100) 65 (100) 74 (100)
Number of distinct breast symptoms reported in 18mths before diagnosis
0 103 (23.7) 37 (33.0) 22 (18.5) 12 (18.8) 16 (24.6) 16 (21.6) 0.137 1 278 (64.1) 66 (58.9) 77 (64.7) 45 (70.3) 39 (60.0) 51 (68.9) 2+ 53 (12.2) 9 (8.0) 20 (16.8) 7 (10.9) 10 (15.4) 7 (9.5) Lump symptom No 137 (31.6) 43 (38.4) 38 (31.9) 11 (17.2) 22 (33.9) 23 (31.1) 0.069 Yes 297 (68.4) 69 (61.6) 81 (68.1) 53 (82.8) 43 (66.2) 51 (68.9) aP
-values are derived fromX2
tests for categorical variables and non-parametric tests for trend for continuous variables (BMI, breast-related consultations). All tests exclude missing values
Fig. 3Net survival by deprivation: all women (N= 786).
more than 12 weeks following their cancer diagnosis had substantially lower net survival compared to those whose surgery took place within 12 weeks (Fig. 5b). This difference was evident from cancer diagnosis onwards. Discussion
Our data suggest that although more deprived women display lifestyle factors associated with poorer outcomes, their consultation frequency for both breast and non-breast symptoms, their comorbidities and the type of breast cancer symptoms they present with are similar. This interpretation is supported by the lack of difference in consultation patterns by extent of disease, BMI, smok-ing or alcohol consumption status coupled with the per-sistence of deprivation differences in survival within the sub-groups of these co-variables. We found some evi-dence of extended times to surgical treatment among most deprived women who were not screen-detected but who presented with symptoms in primary care. This potentially suggests that treatment delay may play a role, either due to a greater proportion of deprived women receiving neo-adjuvant treatment, or due to differences in the way more deprived patients interact with the healthcare system. Further investigation of the interrela-tionships between these variables within a larger and more detailed dataset is warranted.
These data were from a centre of excellence in breast cancer registration, and although small numbers limited
our ability to perform multivariable analyses, our sample was representative, in terms of survival and most other characteristics, of the cohort from which they were drawn. The sample was somewhat less deprived than the cohort of women from which they came which is likely to be due to the profiles of the GP practices that contributed to the CPRD dataset within the West Midlands. In most cases there was less than 10% missing data in the analysis. The data available included women diagnosed some time ago, however, despite the changes in the healthcare system in the years since these data were collected, this study high-lights some important areas that are less likely to have changed greatly. Despite a persistent deprivation gap in survival, we have found no difference in rate of consult-ation between the more and less deprived. In addition, changes in the system have resulted in almost unchanged high proportions of diagnoses after emergency admission for certain cancers (such as colon and lung).
Women who were not screen-detected and who pre-sented with symptoms in primary care are those for whom policies encouraging early diagnosis are likely to be most effective. However, time from last breast-related consultation to diagnosis in this group was not signifi-cantly related to any of the variables investigated. This may suggest that patient delay prior to diagnosis is not such an important driver of survival differences within this cohort as might be assumed. On the other hand, time from last consultation to surgery in this group was Fig. 4Net survival for all women in the sample (N= 786) by (a) the presence of comorbidities, (b) BMI, (c) smoking status and (d) alcohol consumption. Footnotes: Estimates smoothed. Survival from date of cancer diagnosis to death, or the end of follow-up
longer among more deprived women, overweight or obese women, those who had a comorbidity, and those who were older. This potentially suggests that symptomatically-detected women are being referred and diagnosed just as quickly, regardless of their
socio-demographic characteristics, but that differences in time to surgical treatment emerge after diagnosis. Such differ-ences might be in part due to greater complexity in pre-paring more comorbid women, or women with more advanced stage of disease, for surgery, or due to Table 3Mean time from last breast symptom reported to diagnosis (N= 331) and to surgery (N= 212) by co-variables, among non-screen-detected women who also reported breast symptoms
Time from last breast-related consultation to diagnosis Time from diagnosis to surgery
N (%) Mean (range), days Pvalue (trend) N (%) Mean (range), days Pvalue (trend)a
Total 331 (100.0) 16.0 (1–509) 212 (100.0) 23.7 (1–199) Deprivation Least deprived 75 (22.7) 15.6 (1–444) 0.299 48 (22.6) 22.1 (7–117) 0.034 2 97 (29.3) 15.1 (1–509) 59 (27.8) 21.5 (3–156) 3 52 (15.7) 15.8 (2–116) 34 (16.0) 20.9 (1–162) 4 49 (14.8) 15.0 (2–373) 35 (16.5) 27.6 (13–136) Most deprived 58 (17.5) 19.3 (1–389) 36 (17.0) 29.2 (10–199) Extent 1 162 (48.9) 14.6 (1–444) 0.554 110 (51.9) 22.0 (3–139) 0.137 2 134 (40.5) 17.2 (1–509) 89 (42.0) 24.3 (1–199) 3 12 (3.6) 13.9 (2–222) 4 (1.9) 48.5 (22–156) missing 23 (6.9) 9 (4.2) Age 50–54 89 (26.9) 19.4 (1–509) 0.144 59 (27.8) 21.8 (2–162) 0.790 55–59 62 (18.7) 14.6 (1–258) 45 (21.2) 25.2 (3–153) 60–64 89 (26.9) 15.9 (2–109) 54 (25.5) 23.9 (1–151) 65–70 91 (27.5) 14.1 (1–389) 54 (25.5) 24.3 (6–199) BMI < 25 normal 141 (42.6) 15.0 (1–444) 0.235 85 (40.1) 21.3 (2–199) 0.590 25to < 30 overweight 97 (29.3) 14.5 (1–509) 68 (32.1) 26.7 (7–156) 30+ obese 68 (20.5) 20.1 (4–444) 49 (23.1) 22.4 (1–162) missing 25 (7.6) 10 (4.7) Smoking non- or ex-smoker 219 (66.2) 15.4 (1–509) 0.371 142 (67.0) 23.4 (1–156) 0.881 current smoker 102 (30.8) 17.5 (1–258) 64 (30.2) 24.3 (3–199) missing 10 (3.0) 6 (2.8)
Alcohol consumption status
non-drinker 37 (11.2) 14.0 (2–101) 0.989 26 (12.3) 21.6 (11–53) 0.857 current drinker 242 (73.1) 16.4 (1–509) 155 (73.1) 24.1 (1–199) ex-drinker 33 (10.0) 15.4 (2–393) 23 (10.8) 21.3 (6–106) missing 19 (5.7) 8 (3.8) Charlson score 0 298 (90.0) 15.8 (1–509) 0.414 188 (88.7) 23.1 (1–199) 0.103 1+ 33 (10.0) 17.4 (2–109) 24 (11.3) 28.9 (12–106) Lump symptom No 59 (17.8) 20.0 (1–444) 0.206 35 (16.5) 23.1 (3–199) 0.827 Yes 272 (82.2) 15.2 (1–509) 177 (83.5) 23.8 (1–162) a
differences in the way more deprived women navigate the healthcare system. In order to be able to draw firm con-clusions about this, we would need specific information on treatments received including the rationale behind de-cisions made, in particular in relation to timing, adjuvant therapies administered, patient input into these decisions, and patient adherence. Reliable recurrence information for each woman over a medium to long period of follow-up would also be required.
There are some well-established relationships between deprivation and smoking, BMI, alcohol consumption, screening and stage at diagnosis [12–16, 34–36] but few have been investigated using the primary care data to date. BMI was associated in this sample with both deprivation and time to surgery, and may therefore explain some of the relationship between deprivation and survival. Conversely, the presence of comorbidities, while closely associated with
survival and time to surgery, was not significantly related to deprivation. This contrasts with previous work where co-morbidity was more frequent among the more deprived [37, 38]. However, in our data very few women had more than one comorbidity, probably because we included only women aged 50–70 (those eligible for breast screening). These women are generally healthier than the older women with breast cancer.
Conclusions
We have previously shown that differences in survival by deprivation are evident among both women whose can-cer was screen-detected and those not screen-detected [36] and that these differences are not entirely explained by adjustment for stage of disease and treatment re-ceived [39]. In those analyses we made corrections for potential biases due to lead time [40] and over-diagnosis. This preliminary exploration of a linked sub-sample of these same data has highlighted both similarities and dif-ferences in the characteristics of women by deprivation status. It has shown a reassuring lack of difference in the impact of deprivation on consultation patterns, and a lack of association between lifestyle factors associated with deprivation and survival. On the other hand, our data point to some potential differences in time to surgi-cal treatment that should be explored further. Our ana-lysis demonstrates the feasibility of using primary care data to add to our understanding of what underlies sur-vival differences. Larger samples linked to richer data on treatment decisions and pathways are required to eluci-date these patterns further.
Additional file
Additional file 1:Supplementary materials. (PDF 1260 kb)
Abbreviations
BMI:Body mass index; CPRD: Clinical Practice Research Datalink; GPRD: General Practice Research Database; HES: Hospital Episode Statistics; LSOA: Lower Super Output Area
Acknowledgements
We gratefully acknowledge the invaluable assistance of staff at the West Midlands Breast Screening Quality Assurance Reference Centre in retrieving and collating the data, and Gill Lawrence, ex-Director of the West Midlands Cancer Intelligence Unit, for her helpful suggestions and guidance. We thank Professor Willie Hamilton and Sarah Walker at the University of Exeter for their provision of the invaluable breast symptom code list; and Dr Sara Thomas at LSHTM who kindly provided us with a comorbidities code list and gave advice on its use.
Funding
This work was funded by the National Awareness and Early Diagnosis Initiative (NAEDI) [C23409/A14031 to MM] and by Cancer Research UK [C23409/A11415 to LW and C1336/A11700 to BR].
KB holds a Sir Henry Dale fellowship jointly funded by the Wellcome Trust and the Royal Society (107731/Z/15/Z).
Fig. 5Net survival by time from last symptom to (a) diagnosis (N= 331) and (b) surgery (N= 212) among those symptomatically detected and who reported breast symptoms prior to diagnosis. Footnotes: Estimates unsmoothed due to sparsity of some data. CIs not shown for clarity. Some survival curves rise over time because in certain intervals the survival of the cancer patients is better than the population from which they are drawn, thus the interval-specific estimate of net survival is greater than 100%. Survival from date of cancer diagnosis to death, or the end of follow-up
None of the funding bodies had a role in the design of the study, or the collection analysis and interpretation of the data, nor in writing the manuscript.
Availability of data and materials
We are not the data owners and as such cannot provide access to the data.
Authors’contributions
MM analysed and interpreted the data, and drafted the manuscript. LW helped in the analysis and interpretation of the data, and was a contributor to writing the manuscript. KB provided code, training and helped in the analysis of the CPRD data, and edited the manuscript. BR helped in the interpretation of the data and edited the manuscript. All authors read and approved the final manuscript.
Competing interests
The authors declare that they have no competing interests.
Consent for publication Not applicable.
Consent for publication Not applicable.
Ethics approval and consent to participate
Section 251 approval is held by the Cancer Survival Group to access and link cancer registry data.
Received: 21 June 2016 Accepted: 8 February 2017
References
1. Quinn MJ, Cooper N, Rachet B, Mitry E, Coleman MP. Survival from cancer of the breast in women in England and Wales up to 2001. Br J Cancer. 2008;99 Suppl 1:S53–55.
2. Rachet B, Ellis L, Maringe C, Nur U, Chu T, Quaresma M, Shah A, Walters S, Woods LM, Forman D, et al. Socioeconomic inequalities in cancer survival in England after the NHS Cancer Plan. Br J Cancer. 2010;103:446–53. 3. Sant M, Allemani C, Capocaccia R, Hakulinen T, Aareleid T, Coebergh JW,
Coleman MP, Grosclaude P, Martinez C, Bell J, et al. Stage at diagnosis is a key explanation of differences in breast cancer survival across Europe. Int J Cancer. 2003;106(3):416–22.
4. Jack RH, Davies EA, Moller H. Breast cancer incidence, stage, treatment and survival in ethnic groups in South East England. BrJCancer. 2009;100(3):545–50. 5. Woods LM, Rachet B, Coleman MP. Origins of socio-economic inequalities in
cancer survival: a review. Ann Oncol. 2006;17:5–19.
6. Walters S, Maringe C, Butler J, Rachet B, Barrett-Lee P, Bergh J, Boyages J, Christiansen P, Lee M, Warnberg F, et al. Breast cancer survival and stage at diagnosis in Australia, Canada, Denmark, Norway, Sweden and the UK, 2000–2007: a population-based study. Br J Cancer. 2013;108:1195–208. 7. Jassem J, Ozmen V, Bacanu F, Drobniene M, Eglitis J, Lakshmaiah KC, Kahan
Z, Mardiak J, Pieńkowski T, Semiglazova T, et al. Delays in diagnosis and treatment of breast cancer: a multinational analysis. Eur J Public Health. 2014;24(5):761–7.
8. Walter F, Webster A, Scott S, Emery J. The Andersen model of total patient delay: a systematic review of its application in cancer diagnosis. J Health Serv Res Policy. 2012;17(2):110–8.
9. Niksic M, Rachet B, Warburton FG, Wardle J, Ramirez AJ, Forbes LJL. Cancer symptom awareness and barriers to symptomatic presentation in England-are we clear on cancer? Br J Cancer. 2015;113(3):533–42.
10. Macleod U, Mitchell ED, Burgess C, Macdonald S, Ramirez AJ. Risk factors for delayed presentation and referral of symptomatic cancer: evidence for common cancers. Br J Cancer. 2009;101 Suppl 2:S92–S101.
11. Ramirez AJ, Westcombe AM, Burgess CC, Sutton S, Littlejohns P, Richards MA. Factors predicting delayed presentation of symptomatic breast cancer: a systematic review. Lancet. 1999;353(9159):1127–31.
12. Banks E, Beral V, Cameron R, Hogg A, Langley N, Barnes I, Bull D, Reeves G, English R, Taylor S, et al. Comparison of various characteristics of women who do and do not attend for breast cancer screening. Breast Cancer Res. 2002;4(1):R1. 13. Department of Health Public Health Research Consortium, Law C, Power C,
Graham H, Merrick D. Obesity and health inequalities. Obes Rev. 2007;8:19–22.
14. Fone DL, Farewell DM, White J, et al. Socioeconomic patterning of excess alcohol consumption and binge drinking: a cross-sectional study of multilevel associations with neighbourhood deprivation. BMJ Open. 2013;3: e002337. doi:10.1136/bmjopen-2012-002337.
15. Lakshman R, McConville A, How S, Flowers J, Wareham N, Cosford P. Association between area-level socioeconomic deprivation and a cluster of behavioural risk factors: cross-sectional, population-based study. J. Public Health. 2010;33(2):234-245.
16. Office for National Statistics. Current smoking rates, for adults aged 18 and over, using the 2012 Integrated Household Survey (IHS) and the 2010 Index of Multiple Deprivation (IMD 2010). In. Edited by Office for National Statistics. 2014. http://webarchive.nationalarchives. gov.uk/20160105160709/; http://www.ons.gov.uk/ons/rel/disability-and- health-measurement/do-smoking-rates-vary-between-more-and-less-advantaged-areas-/2012/sty-smoking-rates.html. Accessed May 2016. 17. Lyratzopoulos G, Wardle J, Rubin G. Rethinking diagnostic delay in cancer:
how difficult is the diagnosis? BMJ. 2014;349:g7400.
18. Lyratzopoulos G, Saunders CL, Abel GA, McPhail S, Neal RD, Wardle J, Rubin GP. The relative length of the patient and the primary care interval in patients with 28 common and rarer cancers. Br J Cancer. 2015;112(s1):S35–40.
19. Neal RD, Allgar VL. Sociodemographic factors and delays in the diagnosis of six cancers: analysis of data from the“national survey of NHS patients: cancer”. Br J Cancer. 2005;92(11):1971–5.
20. Lyratzopoulos G, Neal RD, Barbiere JM, Rubin GP, Abel GA. Variation in number of general practitioner consultations before hospital referral for cancer: findings from the 2010 national cancer patient experience survey in England. Lancet Oncol. 2012;13:353–65.
21. Communities and Local Government. The English Indices of Deprivation 2007. In. London; 2008.
22. Communities and Local Government. The English Indices of Deprivation 2010. In. London; 2011.
23. Neighbourhood Renewal Unit. The English indices of deprivation 2004 (revised). London: Office for the Deputy Prime Minister; 2004. 24. Body mass index thresholds for intervening to prevent ill health
among black, Asian and other minority ethnic groups [https://www. nice.org.uk/advice/lgb13/chapter/introduction]. Accessed May 2016. 25. Bhaskaran K, Forbes HJ, Douglas I, Leon DA, Smeeth L. Representativeness
and optimal use of body mass index (BMI) in the UK clinical practice research Datalink (CPRD). BMJ Open. 2013;3(9):e003389.
26. Charlson ME, Pompei P, Ales KL, MacKenzie CR. A new method of classifying prognostic comorbidity in longitudinal studies: development and validation. J Chronic Dis. 1987;40(5):373–83.
27. Walker S, Hyde C, Hamilton W. Risk of breast cancer in symptomatic women in primary care: a case–control study using electronic records. Br J Gen Pract. 2014;64(629):e788–793.
28. Cuzick J. A Wilcoxon-type test for trend. Stat Med. 1985;4(1):87–90. 29. StataCorp. STATA statistical software: release 14. College Station: Stata
Corp LP; 2015.
30. Pohar Perme M, Stare J, Estève J. On estimation in relative survival. Biometrics. 2012;68:113–20.
31. Morris M, Woods LM, Rachet B. A novel ecological methodology for constructing ethnic-majority life tables in the absence of individual ethnicity information. J Epidemiol Community Health. 2015;69(4):361–7.
32. Cleveland WS. Robust locally weighted regression and smoothing scatterplots. J Am Stat Assoc. 1979;74(368):829–36.
33. Royston P. gr6: lowess smoothing. In: Stata technical bulletin. College Station: Stata Press; 1991. p. 7–9.
34. Lyratzopoulos G, Abel GA, Brown CH, Rous BA, Vernon SA, Roland M, Greenberg DC. Socio-demographic inequalities in stage of cancer diagnosis: evidence from patients with female breast, lung, colon, rectal, prostate, renal, bladder, melanoma, ovarian and endometrial cancer. Ann Oncol. 2013;24(3):843–50. 35. Davies EA, Renshaw C, Dixon S, Moller H, Coupland VH. Socioeconomic and
ethnic inequalities in screen-detected breast cancer in London. J Public Health (Oxf). 2013;35(4):607–15.
36. Morris M, Woods LM, Rogers N, O’Sullivan E, Kearins O, Rachet B. Ethnicity, deprivation and screening: survival from breast cancer among screening-eligible women in the West Midlands diagnosed from 1989 to 2011. Br J Cancer. 2015;113(11):1640.
37. Barnett K, Mercer SW, Norbury M, Watt G, Wyke S, Guthrie B. Epidemiology of multimorbidity and implications for health care, research, and medical education: a cross-sectional study. Lancet. 2012;380(9836):37–43.
38. Salisbury C, Johnson L, Purdy S, Valderas JM, Montgomery AA.
Epidemiology and impact of multimorbidity in primary care: a retrospective cohort study. Br J Gen Pract. 2011;61(582):e12–21.
39. Morris M, Woods LM, Rachet B. What might explain deprivation-specific differences in the excess hazard of breast cancer death amongst screen-detected women? Analysis of patients diagnosed in the West Midlands region of England from 1989 to 2011. Oncotarget. 2016;7(31):49939–47. 40. Duffy SW, Nagtegaal ID, Wallis M, Cafferty FH, Houssami N, Warwick J,
Allgood PC, Kearins O, Tappenden N, O’Sullivan E, et al. Correcting for lead time and length bias in estimating the effect of screen detection on cancer survival. Am J Epidemiol. 2008;168(1):98–104.
• We accept pre-submission inquiries
• Our selector tool helps you to find the most relevant journal
• We provide round the clock customer support
• Convenient online submission
• Thorough peer review
• Inclusion in PubMed and all major indexing services
• Maximum visibility for your research Submit your manuscript at
www.biomedcentral.com/submit