Durham Research Online
Deposited in DRO:
10 October 2014
Version of attached le:
Published VersionPeer-review status of attached le:
Peer-reviewedCitation for published item:
Weinzirl, T. and Jogee, S. and Neistein, E. and Khochfar, S. and Kormendy, J. and Marinova, I. and Hoyos, C. and Balcells, M. and den Brok, M. and Hammer, D. and Peletier, R.F. and Kleijn, G.V. and Carter, D. and Goudfrooij, P. and Lucey, J.R. and Mobasher, B. and Trentham, N. and Erwin, P. and Puzia, T. (2014) 'The HST/ACS Coma Cluster Survey - VII. Structure and assembly of massive galaxies in the centre of the Coma cluster.', Monthly notices of the Royal Astronomical Society., 441 (4). pp. 3083-3121.
Further information on publisher's website:
http://dx.doi.org/10.1093/mnras/stu731Publisher's copyright statement:
This article has been accepted for publication in Monthly Notices of the Royal Astronomical Society c: 2014 The Authors Published by Oxford University Press on behalf of The Royal Astronomical Society. All rights reserved. Additional information:
Use policy
The full-text may be used and/or reproduced, and given to third parties in any format or medium, without prior permission or charge, for personal research or study, educational, or not-for-prot purposes provided that:
• a full bibliographic reference is made to the original source • alinkis made to the metadata record in DRO
• the full-text is not changed in any way
The full-text must not be sold in any format or medium without the formal permission of the copyright holders. Please consult thefull DRO policyfor further details.
Durham University Library, Stockton Road, Durham DH1 3LY, United Kingdom Tel : +44 (0)191 334 3042 | Fax : +44 (0)191 334 2971
The
HST
/ACS Coma Cluster Survey – VII. Structure and assembly of
massive galaxies in the centre of the Coma cluster
Tim Weinzirl,
1‹Shardha Jogee,
1Eyal Neistein,
2Sadegh Khochfar,
2,3John Kormendy,
1Irina Marinova,
4Carlos Hoyos,
5Marc Balcells,
6,7,8Mark den Brok,
9Derek Hammer,
10,11Reynier F. Peletier,
12Gijs Verdoes Kleijn,
12David Carter,
13Paul Goudfrooij,
14John R. Lucey,
15Bahram Mobasher,
16Neil Trentham,
17Peter Erwin
2,18and Thomas Puzia
191Department of Astronomy, 2515 Speedway, Stop C1400, Austin, TX 78712-1205, USA 2Max Planck Institut f¨ur extraterrestrische Physik, PO Box 1312, D-85478 Garching, Germany 3Institute for Astronomy, University of Edinburgh, Royal Observatory, Edinburgh EH9 3HJ, UK
4Southwestern University, Department of Physics, 1001 E. University Avenue, Georgetown, TX 78626, USA
5Instituto de Astronomia, Geof´ısica e Ciˆencias Atmosf´ericas, Rua do Mat˜ao 1226, Cidade Universit´aria S˜ao Paulo-SP, Brazil 6Isaac Newton Group of Telescopes, Apartado 321, E-38700 Santa Cruz de La Palma, Canary Islands, Spain
7Instituto de Astrof´ısica de Canarias, E-38200 La Laguna, Islas Canarias, Spain
8Departamento de Astrof´ısica, Universidad de La Laguna, E-38206 La Laguna, Islas Canarias, Spain 9Department of Physics and Astronomy, University of Utah, Salt Lake City, UT 84112, USA 10Department of Physics and Astronomy, Johns Hopkins, Baltimore, MD 21218, USA 11NASA Goddard Space Flight Center, Code 662, Greenbelt, MD 20771, USA
12Kapteyn Astronomical Institute, University of Groningen, PO Box 800, NL-9700 AV Groningen, the Netherlands
13Astrophysics Research Institute, Liverpool John Moores University, IC2 Liverpool Science Park, 146 Brownlow Hill, Liverpool L3 5RF, UK 14Space Telescope Science Institute, 3700 San Martin Drive, Baltimore, MD 21218, USA
15Department of Physics, Durham University, South Road, Durham DH1 3LE, UK 16Department of Physics and Astronomy, University of California, Riverside, CA 92521, USA 17Institute of Astronomy, Madingley Road, Cambridge CB3 0HA, UK
18Universit¨ats-Sternwarte M¨unchen, Scheinerstrasse 1, D-81679 M¨unchen, Germany
19Department of Astronomy and Astrophysics, Pontificia Universidad Cat´olica de Chile, Avenida Vicu˜na Mackenna 4860, Macul, Santiago, Chile Accepted 2014 April 10. Received 2014 March 25; in original form 2013 September 30
A B S T R A C T
We constrain the assembly history of galaxies in the projected central 0.5 Mpc of the Coma cluster by performing structural decomposition on 69 massive (M≥109M) galaxies using
high-resolutionF814Wimages from theHubble Space Telescope(HST) Treasury Survey of Coma. Each galaxy is modelled with up to three S´ersic components having a free S´ersic indexn. After excluding the two cDs in the projected central 0.5 Mpc of Coma, 57 per cent of the galactic stellar mass in the projected central 0.5 Mpc of Coma resides in classical bulges/ellipticals while 43 per cent resides in cold disc-dominated structures. Most of the stellar mass in Coma may have been assembled through major (and possibly minor) mergers. Hubble types are assigned based on the decompositions, and we find a strong morphology– density relation; the ratio of (E+S0):spirals is (91.0 per cent):9.0 per cent. In agreement with earlier work, the size of outer discs in Coma S0s/spirals is smaller compared with lower density environments captured with SDSS (Data Release 2). Among similar-mass clusters from a hierarchical semi-analytic model, no single cluster can simultaneously match all the global properties of the Coma cluster. The model strongly overpredicts the mass of cold gas and underpredicts the mean fraction of stellar mass locked in hot components over a wide range of galaxy masses. We suggest that these disagreements with the model result from missing cluster physics (e.g. ram-pressure stripping), and certain bulge assembly modes (e.g. mergers of clumps). Overall, our study of Coma underscores that galaxy evolution is not solely a function of stellar mass, but also of environment.
Key words: galaxies: bulges – galaxies: clusters: Coma – galaxies: elliptical and lenticular, cD – galaxies: evolution – galaxies: formation – galaxies: structure.
E-mail: [email protected]
at Durham University Library on October 10, 2014
http://mnras.oxfordjournals.org/
1 I N T R O D U C T I O N
How galaxies form and evolve is one of the primary outstanding problems in extragalactic astronomy. The initial conditions led to the collapse of dark matter haloes which clustered hierarchically into progressively larger structures. In the halo interiors, gas formed ro-tating discs which underwent star formation (SF) to produce stellar discs (Cole et al. 2000; Steinmetz & Navarro 2002). The subse-quent growth of galaxies is thought to have proceeded through a combination of major mergers (e.g. Toomre 1977; Barnes1988; Khochfar & Silk2006,2009), minor mergers (e.g. Oser et al.2012; Hilz, Naab & Ostriker2013), cold-mode gas accretion (Birnboim & Dekel2003; Kereˇs et al.2005,2009; Dekel & Birnboim2006; Brooks et al. 2009; Dekel, Sari & Ceverino 2009a; Dekel et al.
2009b; Ceverino, Dekel & Bournaud2010), and secular processes (Kormendy & Kennicutt2004).
In early simulations focusing on gas-poor mergers, the major merger of two spiral galaxies with mass ratioM1/M2≥1/4 would inevitably destroy the pre-existing stellar discs by violent relax-ation, producing a remnant bulge or elliptical having a puffed-up distribution of stars with a low ratio of ordered-to-random motion (V/σ) and a steep de Vaucouleursr1/4surface brightness profile1 (Toomre1977). Improved simulations (Naab, Khochfar & Burkert
2006; Robertson et al.2006; Governato et al.2007; Hopkins et al.
2009a,b) significantly revised this picture. In unequal-mass major mergers, violent relaxation of stellar discs is not complete. Further-more, for major mergers where the progenitors have moderate-to-high gas fractions, gas-dissipative processes build discs on small and large scales (Hernquist & Mihos1995; Robertson et al.2006; Hopkins et al.2009a,b; Kormendy et al.2009). The overall single S´ersic indexnof such remnants are typically 2n4 (Naab et al.
2006; Naab & Trujillo2006; Hopkins et al.2009a). The subsequent accretion of gas from the halo, cold streams, and minor mergers can further build large-scale stellar discs, whose size depends on the spe-cific angular momentum of the accreted gas (Steinmetz & Navarro 2002; Birnboim & Dekel2003; Kereˇs et al.2005,2009; Dekel & Birnboim2006; Robertson et al.2006; Dekel et al.2009a,b; Brooks et al.2009; Hopkins et al.2009b; Ceverino et al.2010). Addition-ally, Bournaud, Elmegreen & Elmegreen (2007a) and Elmegreen et al. (2009) discuss bulge formation via the merging of clumps forming within very gas rich, turbulent disc in high-redshift galax-ies. These bulges can have a range of S´ersic indices, ranging from n<2 ton=4.
As far as the structure of galaxies is concerned, we are still ac-tively studying and debating the epoch and formation pathway for the main stellar components of galaxies, namely flattened, dynam-ically cold, disc-dominated components (including outer discs, cir-cumnuclear discs, and pseudo-bulges) versus puffy, dynamically hot spheroidal or triaxial bulges/ellipticals. Getting a census of dynamically hot bulges/ellipticals and dynamically cold, flattened disc-dominated components on large and small scales in galaxies provides a powerful way of evaluating the importance of violent bulge-building processes, such as violent relaxation, versus gas-dissipative disc-building processes.
We adopt throughout this paper the widely used definition of a bulge as the excess light above an outer disc in an S0 or spiral galaxy (e.g. Laurikainen et al.2007,2009,2010; Fisher & Drory
2008; Gadotti2009; Weinzirl et al.2009). The central bulge falls in
1A de Vaucouleursr1/4profile corresponds to a S´ersic (1968) profile with indexn=4.
three main categories called classical bulges, discy pseudo-bulges (Kormendy 1993; Kormendy & Kennicutt 2004; Athanassoula
2005; Jogee, Scoville & Kenney2005; Kormendy & Fisher2005; Fisher & Drory2008), and boxy pseudo-bulges (Combes & Sanders
1981; Combes et al.1990; Pfenniger & Norman1990; Athanassoula
2005; Bureau & Athanassoula2005; Martinez-Valpuesta, Shlosman & Heller2006). Some bulges are composite mixtures of the first two classes (Kormendy & Barentine2010; Barentine & Kormendy
2012). For remainder of the paper we refer to classical bulges simply as ‘bulges’ when the context is unambiguous.
Numerous observational efforts have been undertaken to derive such a census among galaxies in the field environment. Photometric studies (e.g. Kormendy1993; Graham2001; Balcells et al.2003; Balcells, Graham & Peletier2007b; Laurikainen et al.2007; Fisher & Drory2008; Graham & Worley2008; Gadotti2009; Weinzirl et al.2009; Kormendy et al.2010) have dissected field galaxies into outer stellar discs and different types of central bulges (clas-sical, discy/boxy pseudo-bulges) associated with different S´ersic index, and compiled the stellar bulge-to-total light or mass ratio (B/T) of spirals and S0s. It is found that low-B/Tand bulgeless galaxies are common in the field at low redshifts, both among low-mass or late-type galaxies (B¨oker et al.2002; Kautsch et al.2006; Barazza, Jogee & Marinova2007,2008) and among high-mass spi-rals or early-type spispi-rals (Kormendy1993; Balcells et al. 2003,
2007b; Laurikainen et al.2007; Graham & Worley2008; Gadotti
2009; Weinzirl et al.2009; Kormendy et al.2010). Balcells et al. (2003) highlighted the paucity ofr1/4profiles in the bulges of early-type disc galaxies. Working on a bigger sample, Weinzirl et al. (2009) report that the majority (66.4 ± 4.4 per cent) of massive (M≥1010M) field spirals have lowB/T(≤0.2) and bulges with low S´ersic index (n≤2).
These empirical results can be used to test models of the assembly history of field galaxies. For instance, Weinzirl et al. (2009) find that the results reported above are consistent with hierarchical semi-analytic models of galaxy evolution from Khochfar & Silk (2006) and Hopkins et al. (2009a), which predict that most (∼85 per cent) massive field spirals have had no major merger sincez=2. While this work reduces the tension between theory and observations for field galaxies, one should note that hydrodynamical models still face challenges in producing purely bulgeless massive galaxies in different environments.
It is important to extend such studies from the field environment to rich clusters. Hierarchical models predict differences in galaxy merger history as a function of galaxy mass, environment, and red-shift (Cole et al.2000; Khochfar & Burkert2001). Furthermore, cluster-specific physical processes, such as ram-pressure stripping (Gunn & Gott1972; Fujita & Nagashima1999), galaxy harassment (Barnes & Hernquist1991; Moore et al.1996,1999; Hashimoto et al.1998; Moore, Lake & Katz1998; Gnedin2003), and strangu-lation (Larson, Tinsley & Caldwell1980), can alter SF history and galaxy stellar components (discs, bulges, bars).
Efforts to establish accurate demographics of galaxy com-ponents in clusters are ongoing. In the nearby Virgo cluster, Kormendy et al. (2009) find that more than 2/3 of the stellar mass is in classical bulges/ellipticals, including the stellar mass contribu-tion from M87.2Furthermore, there is clear evidence for ongoing 2M87 is considered as a giant elliptical by some authors and as a cD by others. The detection of intracluster light around M87 (Mihos et al.2005, 2009) strongly supports the view that it is a cD galaxy. In this paper (e.g. Table6) we consider M87 as a cD when making comparisons (e.g. Section 4.2) to Virgo.
at Durham University Library on October 10, 2014
http://mnras.oxfordjournals.org/
environmental effects in Virgo; see Kormendy & Bender (2012) for a comprehensive review.
Yet Virgo is not very rich compared with more typical clus-ters (Heiderman et al. 2009). The Coma cluster at z = 0.024 (D=100 Mpc) has a central number density 10 000 Mpc−3(The & White1986) and is the densest cluster in the local Universe. However, ground-based data do not provide high enough resolution (1 arcsec–2 arcsec=500–1000 pc) for accurate structural decom-position, an obstacle to earlier work.
In this paper we make use of data from the Hubble Space Telescope(HST) Treasury Survey (Carter et al. 2008) of Coma which provides high-resolution (50 pc) imaging from the Advanced Camera for Surveys (ACS). Our goal is to derive the demographics of galaxy components, in particular classical bulges/ellipticals and flattened disc-dominated components (including both large-scale discs and discy pseudo-bulges), in the Coma cluster, and to com-pare the results with lower density environments (LDEs) and to theoretical models, to constrain the assembly history of galaxies.
In Section 2 we present our mass-complete sample of cluster galaxies with stellar massM ≥ 109 M. In Section 3 we de-scribe our structural decomposition strategy. Section 3.1 dede-scribes our working assumption in this paper of using S´ersic index as a proxy for tracing the disc-dominated structures and classical bulges/ellipticals. Section 3.2 outlines our procedure for structural decomposition, and we refer the reader to Appendix A for a more detailed description. Section 3.3 overviews the scheme we use to assign morphological types (MT) to galaxies. In Section 4.1, we quantitatively assign galaxy types based on the structural decom-positions. We also make a census (Section 4.2) of structures built by dissipation versus violent stellar processes, explore how stellar mass is distributed in different galaxy components (Section 4.3), and consider galaxy scaling relations (Section 4.4). In Section 4.5, we evaluate and discuss the effect of cluster environmental processes. In Section 5 we compare our empirical results with theoretical models, after first identifying Coma-like environments in the simulations. Readers not interested in the complete details about the theoretical model can skip to Sections 5.3 and 5.6. We summarize our results in Section 6.
We adopt a flatcold dark matter cosmology with=0.7 andH0=73 km s−1Mpc−1. We use AB magnitudes throughout the paper, except where indicated otherwise.
2 DATA A N D S A M P L E S E L E C T I O N
This study is based on the data products from theHST/ACS Coma Cluster Treasury Survey (Carter et al.2008), which provides ACS Wide Field Camera images for 25 pointings spanning 274 arcmin2 in theF475WandF814Wfilters. The total ACS exposure time per pointing is typically 2677 s inF475Wand 1400 s inF814W. Most (19/25) pointings are located within 0.5 Mpc from the central cD galaxy NGC 4874, and the other 6/25 pointings are between 0.9 and 1.75 Mpc southwest of the cluster centre. The full width at half-maximum (FWHM) of the ACS point spread function (PSF) is∼0.1 arcsec (Hoyos et al.2011), corresponding to∼50 pc at the 100 Mpc distance of the Coma cluster (Carter et al.2008). Note that the 19 pointings cover only 19.7 per cent by area of the projected central 0.5 Mpc of Coma. This limited spatial coverage of ACS in the projected central 0.5 Mpc of Coma may introduce a possible bias in the sample due to cosmic variance. We quantify this effect in Appendix B5 and discuss the implications throughout the paper. Hammer et al. (2010) discuss the images and SEXTRACTORsource catalogues for Data Release 2.1 (DR2.1). TheF814W5σlimit for
point sources is 26.8 mag (Hammer et al.2010), and we estimate the 5σ F814Wsurface brightness limit for extended sources within a 0.7 arcsec diameter aperture to be 25.6 mag arcsec−2. Several of the ACS images in DR2.1 suffer from bias offsets on the interchip and/or interquadrant scale that cause difficulty in removing the sky background. We use the updated ACS images reprocessed to reduce the impact of this issue. The DR2.1 images are used where this issue is not present.
2.1 Selection of bright cluster members
We select our sample based on the eyeball catalogue of Trentham et al. (in preparation), with updates from Marinova et al. (2012). This catalogue provides visually determined morphologies and clus-ter membership status for galaxies with an apparent magnitude F814W≤ 24 mag. Morphology classifications in this catalogue come from a combination of RC3 (de Vaucouleurs et al.1991) and visual inspection. In Section 4.1 we assign Hubble types based only on our own multicomponent decompositions.
Cluster membership is ranked from 0 to 4 following the method of Trentham & Tully (2002). Membership class 0 means the galaxy is a spectroscopically confirmed cluster member. The subset of spec-troscopically confirmed cluster members was identified based on published redshifts (Colless & Dunn1996; Mobasher et al.2001; Adelman-McCarthy et al.2008; Chiboucas et al.2010) and is ap-proximately complete in surface brightness at the galaxy half-light radius (μe, F814W) to∼22.5 mag arcsec−2(den Brok et al.2011). The remaining galaxies without spectroscopic confirmation are assigned a rating of 1 (very probable cluster member), 2 (likely cluster mem-ber), 3 (plausible cluster memmem-ber), or 4 (likely background object) based on a visual estimation that also considers surface brightness and morphology.
From this catalogue, we define a sample S1 of 446 cluster mem-bers havingF814W≤24 mag and membership rating 0–3 located within the projected central 0.5 Mpc of Coma, which is the pro-jected radius probed by the central ACS pointings. To S1 we add the second central cD galaxy NGC 4889, which is not observed by the ACS data. The majority (179) of S1 galaxies have member class 0, and 30, 131, and 106 have member class 1, 2, and 3, respectively.
2.2 Calculation of stellar masses
Stellar masses are a thorny issue. Uncertainties in the mass-to-light ratios of stellar populations (M/L) arise from a poorly known ini-tial mass function (IMF) as well as degeneracies between age and metallicity. We calculate stellar masses based on theHST F475W andF814W-band photometry. First, we convert theHST(AB) pho-tometry to the Cousins–Johnson (Vega) system using
I=F814W−0.38 (1)
from the WFPC2 Photometry Cookbook and
B−I=1.287 (F475W−F814W)+0.538 (2)
from Price et al. (2009).
Next, we calculateI-bandM/Lfrom the calibrations of Into & Portinari (2013) for a Kroupa, Tout & Gilmore (1993) IMF with
Ilum=10(−0.4(I−35−4.08)) (3) and
M=Ilum×10(0.641(B−I)−0.997), (4)
at Durham University Library on October 10, 2014
http://mnras.oxfordjournals.org/
where I corresponds to the apparent MAG_AUTO SEXTRACTOR magnitude,335 is the distance modulus to Coma, and 4.08 is the solar absolute magnitude inIband.
We use the above method to calculate stellar masses for all galax-ies in S1 except NGC 4889, which does not have ACS data. For NGC 4889, we usegrPetrosian magnitudes from SDSS Data Re-lease 10 (DR10; Ahn et al.2013). Stellar masses are determined using the relations of Bell et al. (2003) and assuming a Kroupa IMF, namely
glum=10(−0.4(g−35−5.10)) (5) and
M=glum×10(−0.499+1.519(g−r)−0.1), (6) wheregandrare apparent SDSS magnitudes, 35 is the distance modulus to Coma, and 5.10 is the solar absolute magnitude ing band.4
It is hard to derive the stellar mass of cD galaxies for several rea-sons. The stellarM/Lratio of cDs is believed to be high (Mdyn/LB>
100; Schneider2006), but is very uncertain as most of the light of a cD is in an outer envelope made of intracluster light and galaxy debris. Another problem is that even if one knew the correct stellar M/Lratio, it is likely that the available photometry from ACS and SDSS is missing light from the extended low surface brightness en-velope. Given all these factors, it is likely that the above equations, which are typically used to convert colour toMfor normal rep-resentative galaxies, are underestimating theM/Lratios and stellar masses of the cDs, so that the adopted stellar masses for the cDs (M∼6−8×10¹¹M) are lower limits. Due to the uncertain stel-lar masses of the cDs, we present many of our results without them, and we take care to consider them separately from the less massive galaxy population of E, S0, and spiral galaxies.
2.3 Selection of final sample of massive galaxies
The left-hand panels of Fig.1show the distributions ofF814W magnitudes (upper panel) and stellar masses (lower panels) for sample S1, while in the right-hand panels of the same figure the correlations of stellar masses withF814Wmagnitudes (upper panel) andg−rcolours (lower panel) are shown.
In this paper, we focus on massive (M≥109M) galaxies. Our rationale is that we are specifically interested in understanding the evolution of the most massive cluster galaxies through comparisons with model clusters (Section 5) which show mass incompleteness at galaxy stellar massesM<109M
. We found for sample S1 that imposing the mass cutM≥109Meffectively removes most galaxies identified in the Trentham et al. catalogue as dwarf/irregular and very low surface brightness galaxies. With this cut, we are left with 75 galaxies that consist primarily of E, S0, and spiral galaxies, two cDs, and only six dwarfs. 3 out of 75 galaxies are significantly cutoff from the ACS detector, and we ignore these sources. Of the remaining 72 galaxies, 69/72 have spectroscopic redshifts. The 3/72 galaxies without spectroscopic redshifts appear too red to be
3For galaxies COMAi125935.698p275733.36 = NGC 4874 and CO-MAi125931.103p275718.12, SEXTRACTORvastly underestimates the total F814Wluminosity, and the calculation is instead made with the total lumi-nosity derived from structural decomposition (Section 3.2).
4The Kroupa IMF offset term reported as−0.15 in Bell et al. (2003) was calculated assuming unrealistic conditions (Bell, private communication). The correct value is−0.1 and is used in Borch et al. (2006).
in Coma (Fig. 1d), and the estimated SDSS DR10 photometric redshifts are much larger than the redshift of Coma (0.024). We also neglect these three sources as they are unlikely to be Coma members. Our final working sample S2 consists of the 69 galaxies inside the projected central 0.5 Mpc with stellar massM≥109M and spectroscopic redshifts. Table1cross references our sample with other data sets.
3 M E T H O D A N D A N A LY S I S
3.1 Using S´ersic index as a proxy for tracing disc-dominated structures and classical bulges/ellipticals
As outlined in Section 1, galaxy bulges and stellar discs hold in-formation on galaxy assembly history. The overall goal in this work is to separate galaxy components into groups of classical bulges/ellipticals versus disc-dominated structures.
It is common practice (e.g. Laurikainen et al.2007; Gadotti2009; Weinzirl et al.2009) to characterize galaxy structures (bulges, discs, and bars) with generalized ellipses whose radial light distributions are described by the S´ersic (1968) profile:
I(r)=Ieexp −bn r re 1/n −1 , (7)
whereIeis the surface brightness at the effective radiusreandbn5
is a constant that depends on S´ersic indexn.
In this paper, we adopt the working assumption that in interme-diate and high-mass (M≥109M) galaxies, a low S´ersic index nbelow a threshold valuendisc max corresponds to a dynamically cold disc-dominated structure. Note we specify ‘disc-dominated’ rather than ‘pure disc’ as we refer to barred discs and thick discs. While this assumption is not necessarily waterproof, it is based on multiple lines of compelling evidence that are outlined below.
(i) Freeman (1970) showed that many large-scale discs of S0 and spiral galaxies are characterized by an exponential light profile (S´ersic indexn=1) over 4–6 disc scalelengths. Since then, it has become standard practice in studies of galaxy structure to model the outer disc of S0s and spirals with an exponential profile (e.g. Kormendy1977; Boroson1981; Kent1985; Byun & Freeman1995; de Jong1996; Baggett, Baggett & Anderson1998; Allen et al.2006; Laurikainen et al.2007; Gadotti2009; Weinzirl et al.2009).
(ii) On smaller scales, flattened, rotationally supported inner discs with high V/σ (i.e. discy pseudo-bulges) have been asso-ciated with low S´ersic indexn2 (Kormendy1993; Kormendy & Kennicutt2004; Athanassoula2005; Jogee et al.2005; Kormendy & Fisher2005; Fisher & Drory2008; Fabricius et al.2012). This suggestsndisc maxshould be close to 2.
Fabricius et al. (2012) explore the major-axis kinematics of 45 S0– Scd galaxies with high-resolution spectroscopy. They demonstrate a systematic agreement between the shape of the velocity dispersion profile and the bulge type as indicated by the S´ersic index. Low S´ersic index bulges have both increased rotational support (higher V2/σ2values) and on average lower central velocity dispersions. Classical bulges (discy pseudo-bulges) have centrally peaked (flat) velocity dispersion profiles whether identified visually or by a high S´ersic index.
5The precise values ofb
nare given from the roots of the equation(2n)− 2γ(2n,bn)=0, whereis the gamma function andγ is the incomplete gamma function.
at Durham University Library on October 10, 2014
http://mnras.oxfordjournals.org/
Figure 1. Shows in panels (a) to (d) the luminosity, stellar mass, andg−rcolour, respectively, for the 446 galaxies in sample S1 havingF814W≤24, locations within the projected central 0.5 Mpc of the Coma cluster, and cluster membership rating 0–3, where rating 0 means spectroscopically confirmed and ratings 1–3 indicate increasingly less likely cluster membership. See Section 2.1 for details. In panel (b), the two most massive sources are cD galaxies, and the arrows indicate their adopted stellar masses are lower limits (Section 2.2). The solid line in panel (d) is the colour–luminosity break between the red and blue sequence of galaxies from Blanton et al. (2005), which we convert from luminosity to stellar mass using the relations of Bell et al. (2003). The dotted line in panels (b)–(d) indicates our main sample of 69 spectroscopically confirmed members withM≥109M
. (iii) At high (z ∼ 2) redshift, where it is not yet possible to
fully resolve galaxy substructures, it has become conventional to use the global S´ersic indexn2 in massive galaxies to separate disc-dominated versus bulge-dominated galaxies (e.g. Ravindranath et al.2004; van der Wel et al.2011; Weinzirl et al.2011). Weinzirl et al. (2011) further explore the distributions of ellipticities (1− b/a) for the massivez∼2 galaxies with low (n≤2) and high (n> 2) global S´ersic index. They find galaxies with low global S´ersic indexn≤2 have a distribution of projected ellipticities more similar to massivez∼0 spirals than to massivez∼0 ellipticals.
The above does not allow for low-n, dynamically hot structures. A low-ndynamically hot structure would be considered in our
study as a pure photometric disc, a low-nbulge, or an unbarred S0 galaxy. The error due to misunderstood objects in the first two groups is expected to be small or non-existent. There is only one pure photometric disc in the sample (Section 4.1) and low-nbulges (N=20) only make up 2.2 per cent of galaxy stellar mass (excluding the cDs, Section 4.2). Furthermore, fig. 15 of Fabricius et al. (2012) shows that no low-nbulge turns out to be dynamically hot.
There are 20 unbarred S0 galaxies in our sample, and these ac-count for 18.5 per cent of the galaxy stellar mass (excluding the cD galaxies). About 75 per cent of these objects have stellar mass and luminosity consistent with dwarf spheroidal galaxies (Kormendy et al. 2009). Even if some of these systems are actually dwarf spheroidals, they may not be dynamically hot as some studies
at Durham University Library on October 10, 2014
http://mnras.oxfordjournals.org/
Table 1. Cross identifications.
Galaxy name SDSS DR8 name 2MASS XSC (or PSC name) GMP name Dressler (1980) name
(1) (2) (3) (4) (5) COMAi125926.458p275124.81 1237667444048658752 – GMP3473 – COMAi13007.123p275551.49 1237667444048724242 2MASSJ13000711+2755511 GMP2931 – COMAi125930.270p28115.17 1237667324334571563 – GMP3406 – COMAi125937.200p275819.97 1237667444048658537 2MASSJ12593720+2758203 GMP3308 – COMAi125953.929p275813.75 1237667444048658918 – GMP3098 – COMAi13018.351p28333.32 1237667324334637348 – GMP2787 – COMAi125937.010p28106.95 1237667324334571551 2MASSJ12593699+2801074 GMP3312 – COMAi125946.943p275930.90 1237667324334571832 2MASSJ12594688+2759308 GMP3166 – COMAi13030.954p28630.22 1237667324334637213 2MASSJ13003091+2806300 GMP2626 – COMAi13035.420p275634.06 1237667444048724352 – GMP2585 – COMAi125950.183p275445.52 1237667444048658912 – GMP3131 – COMAi125959.476p275626.02 1237667444048658878 – GMP3034 – COMAi13000.949p275643.85 1237667444048658882 2MASSJ13000095+2756433 GMP3017 – COMAi13034.430p275604.95 1237667444048724349 2MASSJ13003442+2756047 GMP2591 – COMAi125931.893p275140.76 1237667444048658763 2MASSJ12593186+2751406 GMP3383 – COMAi125931.103p275718.12 1237667444048658549 – GMP3392 – COMAi13041.193p28242.34 1237667324334702866 2MASSJ13004119+2802424 GMP2529 – COMAi125845.533p274513.75 1237667323797635368 2MASSJ12584558+2745132 GMP4035 – COMAi13018.545p28549.62 1237667324334637356 2MASSJ13001857+2805503 GMP2784 – COMAi13021.673p275354.81 1237667444048724303 2MASXJ13002172+2753545 GMP2736 – COMAi13024.823p275535.94 1237667444048724320 2MASSJ13002482+2755353 GMP2692 – COMAi13051.149p28249.90 1237667324334702708 2MASSJ13005112+2802499 GMP2423 – COMAi13011.143p28354.91 1237667324334637325 2MASSJ13001117+2803551 GMP2879 – COMAi125937.990p28003.52 1237667324334571647 2MASSJ12593798+2800036 GMP3292 – COMAi13018.873p28033.38 1237667324334637362 2MASXJ13001890+2800332 GMP2777 – COMAi125911.543p28033.32 1237667324334506328 2MASSJ12591153+2800334 GMP3681 – COMAi125904.797p28301.16 1237667324334506316 2MASXJ12590475+2803019 GMP3780 – COMAi125909.468p28227.35 1237667324334506325 2MASXJ12590943+2802279 GMP3707 – COMAi125935.286p275149.13 1237667444048658774 2MASXJ12593524+2751488 GMP3339 – COMAi13005.405p28128.14 1237667324334637091 2MASXJ13000538+2801282 GMP2960 – COMAi125950.105p275529.44 1237667444048658822 2MASXJ12595013+2755292 GMP3133 – COMAi13018.772p275613.34 1237667444048723991 2MASXJ13001877+2756135 GMP2778 – COMAi125938.321p275913.89 1237667444048658535 2MASXJ12593827+2759137 GMP3291 D154 COMAi125940.270p275805.71 1237667444048658530 2MASSJ12594026+2758058 GMP3254 D127 COMAi125944.208p275730.38 1237667444048658531 2MASXJ12594423+2757307 GMP3206 D126 COMAi125939.659p275714.03 1237667444048658528 2MASSJ12593965+2757141 GMP3269 D128 COMAi13044.632p28602.31 1237667324334702891 2MASXJ13004459+2806026 GMP2489 D191 COMAi125928.721p28225.92 1237667324334571539 2MASXJ12592868+2802258 GMP3433 D177 COMAi125942.301p275529.15 1237667444048658653 2MASXJ12594234+2755287 GMP3222 D125 COMAi13017.014p28350.07 1237667324334637347 2MASXJ13001702+2803502 GMP2805 D171 COMAi125956.697p275548.71 1237667444048658858 2MASXJ12595670+2755483 GMP3068 D123 COMAi13016.534p275803.15 1237667444048723984 2MASXJ13001655+2758032 GMP2815 D122 COMAi13006.395p28015.94 1237667324334637086 2MASXJ13000643+2800142 GMP2940 D150 COMAi13027.966p275721.56 1237667444048724118 2MASXJ13002798+2757216 GMP2654 D119 COMAi13012.868p28431.74 1237667324334637140 2MASXJ13001286+2804322 GMP2861 D173 COMAi125943.721p275940.82 1237667324334571645 2MASSJ12594372+2759409 GMP3213 D153 COMAi13028.370p275820.64 1237667444048724328 2MASXJ13002835+2758206 GMP2651 D147 COMAi13042.832p275746.95 1237667444048724176 2MASXJ13004285+2757476 GMP2510 D116 COMAi13038.761p28052.34 1237667324334702605 2MASXJ13003877+2800516 GMP2551 D146 COMAi13014.746p28228.69 1237667324334637152 2MASXJ13001475+2802282 GMP2839 D172 COMAi13022.170p28249.30 1237667324334637189 2MASXJ13002215+2802495 GMP2727 D170 COMAi125931.453p28247.60 1237667324334571535 2MASXJ12593141+2802478 GMP3390 D176 COMAi13018.093p275723.59 1237667444048723985 2MASSJ13001809+2757235 GMP2794 D120 COMAi13040.838p275947.80 1237667324334702869 2MASXJ13004081+2759476 GMP2535 D145 COMAi125852.097p274706.15 1237667323797635203 2MASXJ12585208+2747059 GMP3958 D072 COMAi125946.782p275825.99 1237667444048658525 2MASXJ12594681+2758252 GMP3170 D152 COMAi13008.003p28442.81 1237667324334637131 2MASXJ13000803+2804422 GMP2922 D174 COMAi125929.956p275723.26 1237667444048658522 2MASSJ12592995+2757231 GMP3414 D131 COMAi125929.403p275100.46 1237667444048658609 2MASXJ12592936+2751008 GMP3423 D088 COMAi125932.771p275901.04 1237667444048658523 2MASXJ12593276+2759008 GMP3367 D155 COMAi125944.407p275444.84 1237667444048658654 2MASXJ12594438+2754447 GMP3201 D124 COMAi125930.824p275303.05 1237667444048658616 2MASXJ12593079+2753028 GMP3400 D103 COMAi13039.767p275526.19 1237667444048724135 2MASXJ13003975+2755256 GMP2541 D118
at Durham University Library on October 10, 2014
http://mnras.oxfordjournals.org/
Table 1 – continued
Galaxy name SDSS DR8 name 2MASS XSC (or PSC name) GMP name Dressler (1980) name
(1) (2) (3) (4) (5) COMAi13042.766p275817.38 1237667324334702622 2MASXJ13004277+2758166 GMP2516 D144 COMAi13048.646p28526.69 1237667324334702681 2MASXJ13004867+2805266 GMP2440 D168 COMAi13017.683p275718.93 1237667444048723981 2MASXJ13001768+2757192 GMP2798 D121 COMAi13051.464p28234.86 1237667324334702705 2MASXJ13005158+2802341 GMP2417 D167 NGC 4889 1237667444048723983 2MASXJ13000809+2758372 GMP2921 D148 COMAi125935.698p275733.36 (NGC 4874) 1237667444048658532 2MASXJ12593570+2757338 GMP3329 D129
Notes.If there is no match in the 2MASS Extended Source catalogue (2MASX), where available, the 2MASS Point Source catalogue name (2MASS) is given in column (3). GMP name refers to the Godwin, Metcalfe & Peach (1983) catalogue.
(e.g. Kormendy et al.2009, Kormendy & Bender2012) claim that many dwarfs are actually disc systems closely related to dIrr, which have been stripped of gas via supernova feedback or environmental effects. The remaining 25 per cent would be misclassified ellipti-cal galaxies as they are too bright and massive to be dwarfs. Note, however, that fig. 33 of Kormendy et al. (2009) shows that elliptical galaxies withMV< −18 and S´ersicn<2 are very rare. In the
worse-case scenario that all of our unbarred S0 galaxies are dy-namically hot structures, our measurement of the dydy-namically hot stellar mass in Section 4.2 would be too low by∼30 per cent.
The second natural related working assumption in our paper is that in intermediate and high-mass (M≥109M) galaxies, com-ponents with S´ersicn > ndisc maxare classical bulge/elliptical com-ponents (defined in Section 1). Such bulges/ellipticals are formed by the redistribution of stars during major and minor galaxy col-lisions.N-body simulations show that minor mergers consistently raise the bulge S´ersic index (Aguerri, Balcells & Peletier 2001; Eliche-Moral et al.2006; Naab & Trujillo2006). The effect of suc-cessive minor mergers is cumulative (Aguerri et al.2001; Bournaud, Jog & Combes2007b; Naab, Johansson & Ostriker2009; Hilz et al.
2012).
We empirically setndisc maxto 1.66 based on looking at the S´ersic nof outer discs in those Coma galaxies that are barred, and by definition, must harbour outer disc since bars are disc features. Appendices B2 and D discuss the empirical details behind this choice.
3.2 Overview of our structural decomposition procedure
For our mass-complete sample of 69 intermediate-to-high mass (M≥109M) galaxies, we use deep, high-resolution (0.1 arcsec or 50 pc),F814W-band images of Coma fromHST/ACS, which allow for accurate structural decomposition. We fit galaxies with one, two, or three S´ersic profiles, plus a nuclear point source, when needed (see Appendix A for details). We useGALFIT(Peng et al.
2002). In a model with one or more S´ersic profiles, there is expected to be coupling between the free parameters, particularlyre andn, although most previous studies have generally ignored this effect. Weinzirl et al. (2009) explore the issue of parameter coupling for barred and unbarred spiral galaxies.
We take some precautions to ensure accurate decompositions. (i) We fit all structures with a generalized S´ersic profile where the S´ersic index is a free parameter (Section 3.3). This limits the number of a priori assumptions on the physical nature or shape of galaxy structures.
(ii) In clusters, the featureless (i.e. no spiral arms delineated by young stars, rings of SF, or gas/dust lanes) outer discs of gas-poor S0s are not readily distinguished from the equally featureless outer
stellar components of classical ellipticals. We do this in essence by applyingndisc maxto the S´ersic indexnof the outer galaxy structure. (iii) Not requiring outer discs to have an exponentialn=1 pro-file accommodates non-exponential disc structures (e.g. discs with down-bending truncations or up-bending antitruncations; Freeman
1970; van der Kruit1979; van der Kruit & Searle1981a,b; de Grijs, Kregel & Wesson2001; Pohlen et al.2002; Matthews & Gallagher
1997; Erwin, Beckman & Pohlen2005; Pohlen & Trujillo2006; Maltby et al.2012) that are rotationally supported.
(iv) Stellar bars, ovals/lenses, and nuclear point sources are mod-elled when needed, which is critical for obtaining a reliable charac-terization of the bulge (e.g. Balcells et al.2003; Laurikainen et al. 2005,2007; Weinzirl et al.2009).
Our structural decomposition scheme and decision sequence are described in detail in Appendix B, illustrated in Figs2and3, and briefly outlined below.
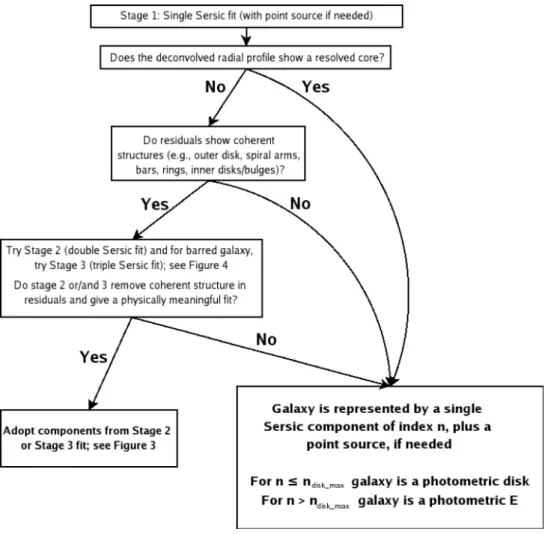
(i)Stage 1 (single S´ersic fitted with nuclear point source if needed). The single S´ersic model is adopted if either the galaxy does not show any coherent structures (e.g. inner/outer discs, bars, bulges, rings, or spiral arms) indicating the need for additional S´ersic components, or, alternatively, if the galaxy has a core – a light profile that deviates downward from the inward extrapolation of the S´ersic profile (see Appendix C). Such galaxies are interpreted as photometric ellipticals if the single S´ersic index is above a thresh-old valuendisc max associated with discs (Section 3.1, Appendices B2 and D); otherwise they are considered photometric discs. Three galaxies show convincing evidence for being cores, and these are lu-minous objects with high single S´ersicn > ndisc max(see Appendix B2, Table2, and Appendix C). The results of Stage 1 are listed in Table3. See Appendix B1 for additional details on the single S´ersic fits.
(ii)Stage 2 (double S´ersic model with nuclear point source if needed). Galaxies showing coherent structure in the Stage 1 resid-uals are subjected to a two-component S´ersic + S´ersic fit, with nuclear point source if needed (see Fig.3). This two-component model is intended to model the inner (C1) and outer (C2) galaxy structures.
There are two possible outcomes. (a) If the outer component C2 is an outer disc based on having S´ersic indexn≤ndisc max, then the galaxy is considered a spiral or S0 with an outer disc having a photometric bulge and, in some cases, a large-scale bar. (b) If the outer component C2 does not meet our definition of an outer disc, then the galaxy is considered a photometric elliptical having an outer component C2 withn > ndisc maxand an inner component C1 of anyn. See Appendix B2 for details.
(iii)Stage 3 (triple S´ersic model with nuclear point source if needed). Case (a) in Stage 2 identifies spiral and S0 galaxies with
at Durham University Library on October 10, 2014
http://mnras.oxfordjournals.org/
Figure 2. Provides an overview of our structural decomposition method. All galaxies are subjected to Stage 1, and most are further processed in Stage 2. A galaxy best fitted with a single S´ersic profile plus point source (if needed) is interpreted as a photometric elliptical or photometric disc. A galaxy with extra coherent structure that cannot be described with a single S´ersic profile is subjected to a multiple-component fit in Stage 2 and, if needed, Stage 3. Fig.3 describes Stage 2 and Stage 3 in more detail.
an outer disc. These galaxies are further processed as follows. (a) If there is evidence for a large-scale bar (see Appendix B2), then a triple S´ersic profile is fitted in Stage 3 for the photometric bulge, disc, and bar. (b) Otherwise, the galaxy is considered as unbarred and the double S´ersic fit for a photometric bulge and disc is adopted. In both cases (a) and (b), it is important to note that the photometric bulge is allowed to have any S´ersic index n, thus allowing for structures withn≤ndisc maxand structures withn > ndisc max.
3.3 Overview of our galaxy classification scheme
The decomposition scheme discussed above and in Figs2and3
leads naturally to the galaxy classification system outlined in Fig.4, where there are five main galaxy types, G1 to G5. Systems best fitted by single S´ersic models (plus a nuclear point source if present) represent galaxies of type G1 and G2. Systems best fitted by two or three S´ersic profiles (plus a nuclear point source if present) represent galaxies of type G3 to G5.
(i) G1. Photometric disc withn≤ndisc max(plus a nuclear point source if present).
(ii) G2. Photometric elliptical withn > ndisc max(plus a nuclear point source if present).
(iii) G3. Unbarred S0 or spiral having an outer disc withn≤
ndisc max and an inner photometric bulge of anyn(plus a nuclear point source if present).
(iv) G4. Barred S0 or spiral having an outer disc with n≤
ndisc max, a bar, and an inner photometric bulge of any n(plus a nuclear point source if present).
(v) G5. Photometric elliptical having an outer component with
n > ndisc maxand an inner component of anyn.
This galaxy classification scheme has multiple advantages. First, it allows us to identify low-n disc-dominated structures within galaxies, both on large scales and in the central regions, in the form of outer discs withn≤ndisc maxin spirals and S0s, photomet-ric bulges withn≤ndisc maxin spirals and S0s (representing discy pseudo-bulges), and inner discs within ellipticals represented by a component C1 havingn≤ndisc max. Furthermore, it allows a cen-sus of galaxy components withn > ndisc maxmore akin to classical bulges/ellipticals. Our scheme does not allow for low-ndynamically hot components. As discussed in Section 3.1, this is not a problem because in our sample such structures are not expected to be present in large numbers.
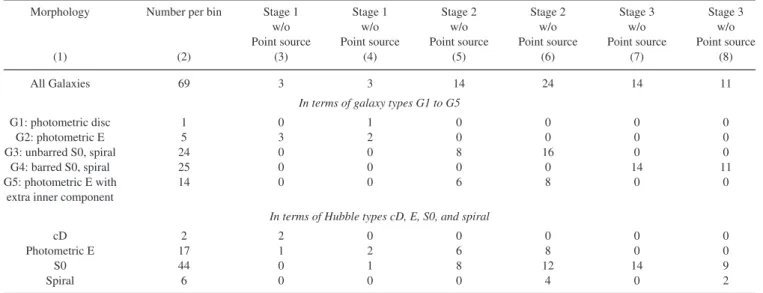
Table4lists the distribution of best-fitting models for the sample of galaxies with stellar massM≥109M, and the breakdown of galaxies into classes G1 to G5. Table5lists the structural parameters
at Durham University Library on October 10, 2014
http://mnras.oxfordjournals.org/
Figure 3. Shows the steps following stages 2 and 3 from Fig.2. A galaxy without an extended outer disc is interpreted as a photometric E, while a galaxy with such a disc is labelled either an S0 or spiral. When evidence for a large-scale bar is found in a galaxy with an outer disc, Stage 3 is used to model the bar component.
at Durham University Library on October 10, 2014
http://mnras.oxfordjournals.org/
Table 2. Properties of cored ellipticals.
Galaxy name Core S´ersic (γ,rb) 2D S´ersic profile w/o 2D S´ersic profile w/o core masked (n,re) core masked (n,re)
(1) (2) (3) (4)
COMAi125909.468p28227.35 (0.16, 0.13 arcsec) (2.54, 4.2) (2.54, 4.20 arcsec)
NGC 4874 (ACSF814W) (0.15, 1.40 arcsec) (2.89, 35.4 arcsec) (11.4, 875.0 arcsec) NGC 4874 (SDSSiband) (0.15, 2.32 arcsec) (4.30, 88.3 arcsec) (4.70, 107.0 arcsec) NGC 4889 (SDSSiband) (0.06, 1.88 arcsec) (3.90, 42.9 arcsec) (7.80, 129.0 arcsec) Notes.Galaxies are identified as having a core following the procedure in Appendix C. Two of the cored galaxies (NGC 4874 and NGC 4889) are cD galaxies.
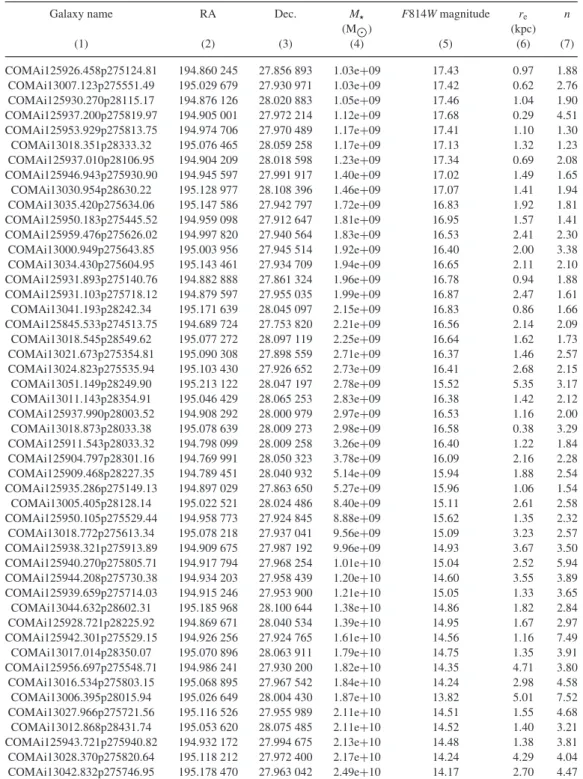
Table 3. Galaxy properties and single S´ersic profile structural parameters.
Galaxy name RA Dec. M F814Wmagnitude re n
(M) (kpc) (1) (2) (3) (4) (5) (6) (7) COMAi125926.458p275124.81 194.860 245 27.856 893 1.03e+09 17.43 0.97 1.88 COMAi13007.123p275551.49 195.029 679 27.930 971 1.03e+09 17.42 0.62 2.76 COMAi125930.270p28115.17 194.876 126 28.020 883 1.05e+09 17.46 1.04 1.90 COMAi125937.200p275819.97 194.905 001 27.972 214 1.12e+09 17.68 0.29 4.51 COMAi125953.929p275813.75 194.974 706 27.970 489 1.17e+09 17.41 1.10 1.30 COMAi13018.351p28333.32 195.076 465 28.059 258 1.17e+09 17.13 1.32 1.23 COMAi125937.010p28106.95 194.904 209 28.018 598 1.23e+09 17.34 0.69 2.08 COMAi125946.943p275930.90 194.945 597 27.991 917 1.40e+09 17.02 1.49 1.65 COMAi13030.954p28630.22 195.128 977 28.108 396 1.46e+09 17.07 1.41 1.94 COMAi13035.420p275634.06 195.147 586 27.942 797 1.72e+09 16.83 1.92 1.81 COMAi125950.183p275445.52 194.959 098 27.912 647 1.81e+09 16.95 1.57 1.41 COMAi125959.476p275626.02 194.997 820 27.940 564 1.83e+09 16.53 2.41 2.30 COMAi13000.949p275643.85 195.003 956 27.945 514 1.92e+09 16.40 2.00 3.38 COMAi13034.430p275604.95 195.143 461 27.934 709 1.94e+09 16.65 2.11 2.10 COMAi125931.893p275140.76 194.882 888 27.861 324 1.96e+09 16.78 0.94 1.88 COMAi125931.103p275718.12 194.879 597 27.955 035 1.99e+09 16.87 2.47 1.61 COMAi13041.193p28242.34 195.171 639 28.045 097 2.15e+09 16.83 0.86 1.66 COMAi125845.533p274513.75 194.689 724 27.753 820 2.21e+09 16.56 2.14 2.09 COMAi13018.545p28549.62 195.077 272 28.097 119 2.25e+09 16.64 1.62 1.73 COMAi13021.673p275354.81 195.090 308 27.898 559 2.71e+09 16.37 1.46 2.57 COMAi13024.823p275535.94 195.103 430 27.926 652 2.73e+09 16.41 2.68 2.15 COMAi13051.149p28249.90 195.213 122 28.047 197 2.78e+09 15.52 5.35 3.17 COMAi13011.143p28354.91 195.046 429 28.065 253 2.83e+09 16.38 1.42 2.12 COMAi125937.990p28003.52 194.908 292 28.000 979 2.97e+09 16.53 1.16 2.00 COMAi13018.873p28033.38 195.078 639 28.009 273 2.98e+09 16.58 0.38 3.29 COMAi125911.543p28033.32 194.798 099 28.009 258 3.26e+09 16.40 1.22 1.84 COMAi125904.797p28301.16 194.769 991 28.050 323 3.78e+09 16.09 2.16 2.28 COMAi125909.468p28227.35 194.789 451 28.040 932 5.14e+09 15.94 1.88 2.54 COMAi125935.286p275149.13 194.897 029 27.863 650 5.27e+09 15.96 1.06 1.54 COMAi13005.405p28128.14 195.022 521 28.024 486 8.40e+09 15.11 2.61 2.58 COMAi125950.105p275529.44 194.958 773 27.924 845 8.88e+09 15.62 1.35 2.32 COMAi13018.772p275613.34 195.078 218 27.937 041 9.56e+09 15.09 3.23 2.57 COMAi125938.321p275913.89 194.909 675 27.987 192 9.96e+09 14.93 3.67 3.50 COMAi125940.270p275805.71 194.917 794 27.968 254 1.01e+10 15.04 2.52 5.94 COMAi125944.208p275730.38 194.934 203 27.958 439 1.20e+10 14.60 3.55 3.89 COMAi125939.659p275714.03 194.915 246 27.953 900 1.21e+10 15.05 1.33 3.65 COMAi13044.632p28602.31 195.185 968 28.100 644 1.38e+10 14.86 1.82 2.84 COMAi125928.721p28225.92 194.869 671 28.040 534 1.39e+10 14.95 1.67 2.97 COMAi125942.301p275529.15 194.926 256 27.924 765 1.61e+10 14.56 1.16 7.49 COMAi13017.014p28350.07 195.070 896 28.063 911 1.79e+10 14.75 1.35 3.91 COMAi125956.697p275548.71 194.986 241 27.930 200 1.82e+10 14.35 4.71 3.80 COMAi13016.534p275803.15 195.068 895 27.967 542 1.84e+10 14.24 2.98 4.58 COMAi13006.395p28015.94 195.026 649 28.004 430 1.87e+10 13.82 5.01 7.52 COMAi13027.966p275721.56 195.116 526 27.955 989 2.11e+10 14.51 1.55 4.68 COMAi13012.868p28431.74 195.053 620 28.075 485 2.11e+10 14.52 1.40 3.21 COMAi125943.721p275940.82 194.932 172 27.994 675 2.13e+10 14.48 1.38 3.81 COMAi13028.370p275820.64 195.118 212 27.972 400 2.17e+10 14.24 4.29 4.04 COMAi13042.832p275746.95 195.178 470 27.963 042 2.49e+10 14.17 2.70 4.47
at Durham University Library on October 10, 2014
http://mnras.oxfordjournals.org/
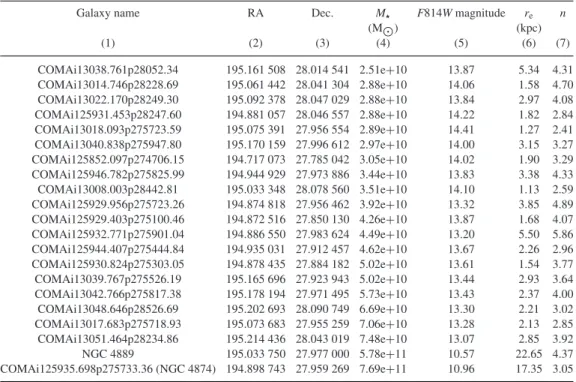
Table 3 – continued
Galaxy name RA Dec. M F814Wmagnitude re n
(M) (kpc) (1) (2) (3) (4) (5) (6) (7) COMAi13038.761p28052.34 195.161 508 28.014 541 2.51e+10 13.87 5.34 4.31 COMAi13014.746p28228.69 195.061 442 28.041 304 2.88e+10 14.06 1.58 4.70 COMAi13022.170p28249.30 195.092 378 28.047 029 2.88e+10 13.84 2.97 4.08 COMAi125931.453p28247.60 194.881 057 28.046 557 2.88e+10 14.22 1.82 2.84 COMAi13018.093p275723.59 195.075 391 27.956 554 2.89e+10 14.41 1.27 2.41 COMAi13040.838p275947.80 195.170 159 27.996 612 2.97e+10 14.00 3.15 3.27 COMAi125852.097p274706.15 194.717 073 27.785 042 3.05e+10 14.02 1.90 3.29 COMAi125946.782p275825.99 194.944 929 27.973 886 3.44e+10 13.83 3.38 4.33 COMAi13008.003p28442.81 195.033 348 28.078 560 3.51e+10 14.10 1.13 2.59 COMAi125929.956p275723.26 194.874 818 27.956 462 3.92e+10 13.32 3.85 4.89 COMAi125929.403p275100.46 194.872 516 27.850 130 4.26e+10 13.87 1.68 4.07 COMAi125932.771p275901.04 194.886 550 27.983 624 4.49e+10 13.20 5.50 5.86 COMAi125944.407p275444.84 194.935 031 27.912 457 4.62e+10 13.67 2.26 2.96 COMAi125930.824p275303.05 194.878 435 27.884 182 5.02e+10 13.61 1.54 3.77 COMAi13039.767p275526.19 195.165 696 27.923 943 5.02e+10 13.44 2.93 3.64 COMAi13042.766p275817.38 195.178 194 27.971 495 5.73e+10 13.43 2.37 4.00 COMAi13048.646p28526.69 195.202 693 28.090 749 6.69e+10 13.30 2.21 3.02 COMAi13017.683p275718.93 195.073 683 27.955 259 7.06e+10 13.28 2.13 2.85 COMAi13051.464p28234.86 195.214 436 28.043 019 7.48e+10 13.07 2.85 3.92 NGC 4889 195.033 750 27.977 000 5.78e+11 10.57 22.65 4.37 COMAi125935.698p275733.36 (NGC 4874) 194.898 743 27.959 269 7.69e+11 10.96 17.35 3.05 Notes.Rows are sorted by increasingM.
from the best single or multicomponent model. In summary, we fit 6, 38, and 25 galaxies with 1, 2, and 3 S´ersic profiles, respectively. Our best-fitting models have reducedχ2of the order of 1. In terms of galaxy types G1 to G5, we assign 1, 5, 24, 25, and 14 objects to classes G1, G2, G3, G4, and G5, respectively. The number of Stage 3 fits implies that the bar fraction among galaxies with an extended outer disc is 50.0±7.1 per cent, and this is consistent with the bar fraction in Coma derived by Marinova et al. (2012).
4 E M P I R I C A L R E S U LT S O N G A L A X Y S T R U C T U R E
4.1 Galaxy types and morphology–density relation in the centre of Coma
We next map classes G1 to G5 to more familiar Hubble types, namely cD, photometric E, S0, and spiral. The Hubble types as-signed here depend only on the morphology classes (G1 to G5) associated with structural decomposition; they are independent of the MT from the Trentham et al. (in preparation) catalogue dis-cussed in Section 2. The results are shown in Table4, and this process is explained in detail below.
The one object in class G1 (photometric disc) has a single S´ersic indexn≤ndisc maxand a nuclear point source. This object has no visible spiral arms, so it is an S0. Objects assigned to class G2 (pho-tometric ellipticals) have single S´ersic indexn > ndisc max and in-clude two known central cD galaxies, NGC 4874 and NGC 4889. We label these two sources separately as cD galaxies because they con-tain a disproportionately large fraction of the stellar mass. Classes G3 (unbarred S0, spiral) and G4 (barred S0, spiral) represent S0 or spiral disc galaxies with a possible large-scale bar. We label the six galaxies in either class G3 or G4 showing spiral arms in the data or residual images as spirals, while the remaining sources are labelled S0. Class G5 objects are identified as photometric ellipticals having
an outer component withn > ndisc maxand an inner component of anyn.
Considering the Hubble types assigned above, we find evidence of a strong absence of spiral galaxies. In the projected central 0.5 Mpc of the Coma cluster, there are two cDs (NGC 4874 and NGC 4889), spirals are rare, and the morphology breakdown of (E+S0):spirals is (25.3 per cent+65.7 per cent):9.0 per cent by num-bers and (32.0 per cent+62.2 per cent):5.8 per cent by stellar mass. Note that our ratio of E-to-S0 galaxies is lower than found else-where for Coma (e.g. Gavazzi et al.2003) and for other clusters (e.g. Dressler 1980; Fasano et al.2000; Poggianti et al. 2009), where it is∼1–2. This is driven by the effect of cosmic variance on our sample (Appendix B5). Also, the total stellar mass cited here does not include the cDs as their stellar mass is quite uncertain (see Section 2.2).
In contrast to the central parts of Coma, LDEs are typi-cally dominated by spirals. This is quantitatively illustrated by Table 6, which compares the results in Coma with the lower density Virgo cluster and the field. We note that Virgo has significantly lower projected galaxy number densities and halo mass (Binggeli, Tammann & Sandage 1987) than the centre of Coma. McDonald, Courteau & Tully (2009) study a sample of 286 Virgo cluster member galaxies that is complete down to BT = 16 (Vega mag). At stellar mass M ≥ 109 M, if M87 is counted as a giant elliptical, the (E+S0):spirals breakdown is (34.1 per cent+31.6 per cent):34.8 per cent by numbers and (59.2 per cent+19.3 per cent):21.4 per cent by stellar mass. There is evidence (Mihos et al.2005,2009; Kormendy et al.2009) that M87 has a cD halo, and after excluding M87, the (E+S0):spirals break-down changes slightly to (33.5 per cent+31.6 per cent):34.8 per cent by numbers and (57.2 per cent+20.3 per cent):22.5 per cent by stel-lar mass. In the field, the (E+S0):spiral morphology breakdown is∼20 per cent:80 per cent by number for bright galaxies (Dressler
1980).
at Durham University Library on October 10, 2014
http://mnras.oxfordjournals.org/
Figure 4. Overview of our galaxy classification system (Section 3.3). Galaxies are deemed to be best represented by a either a single or multicomponent S´ersic profile (plus point source, if needed). Galaxies fitted with a single S´ersic profile are further interpreted as a pure disc (if S´ersic indexn≤ndisc max) or photometric elliptical (if S´ersic indexn > ndisc max). When a multicomponent S´ersic profile is required, the galaxy is either an unbarred/barred S0 or spiral, or a photometric E with inner and outer components. S0s and spirals must have an outer component C2 with S´ersic indexn≤ndisc max. The inner component C1 can have anyn. If the outer component C2 has S´ersic indexn > ndisc max, the galaxy is a photometric elliptical with inner component C1 of anyn. The value ofndisc maxis set to 1.66 based on several considerations (See Appendices B2 and D). We determinendisc maxto be the maximum S´ersic index of the outer disc in spiral and S0 galaxies showing clear signs of an outer disc, such as bars, spiral arms, rings, or high inclination.
4.2 What fraction of total galactic stellar mass is in
disc-dominated structures versus classical bulges/ellipticals?
Here and in Section 4.3, we discuss the stellar mass breakdown among galaxy components within each galaxy type. Our results are summarized in Tables7and8.
Recall that in Section 2.2, the total stellar masses were computed through applying calibrations ofM/Lto theHST F475WandF814W photometry. To calculate the stellar mass in galaxy substructures we assume a constantM/Lratio and simply multiply theF814Wlight ratio of each component by the total galaxy stellar mass. A more rigorous approach is to also perform the decompositions in the F475Wband and to fold the colours of galaxy substructures into the calculation. In Appendix B6, we consider the effect of galaxy colour gradients for a subset of galaxies; the effect of the colour gradients on the stellar mass fractions is small (∼5 per cent) and does not impact our conclusions.
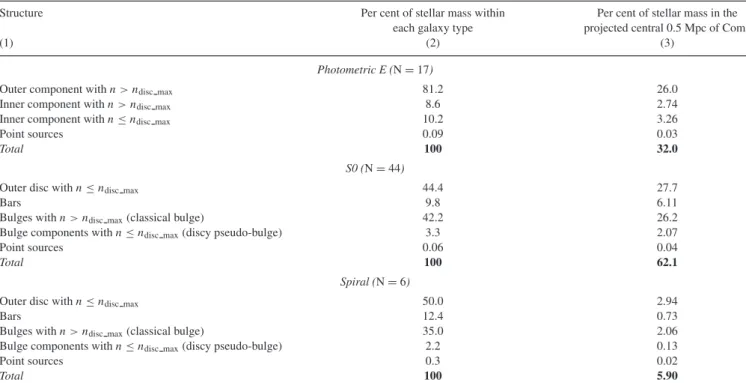
Table 7 summarizes our attempt at providing a census of the stellar mass among disc-dominated components and
classical bulges/ellipticals, in the projected central 0.5 Mpc of Coma, excluding the two cDs. We highlight the main results below.
(i)Stellar mass in low-n flattened disc-dominated structures (43 per cent). The total stellar mass in small and large-scale disc-dominated components is∼36.0 per cent. Bars are disc-dominated components in the sense that they are flattened non-axisymmetric components. Bar proportions typically range from 2.5:1 to 5:1 in their equatorial plane (Binney & Tremaine1987). The stellar mass percentage in bars is 6.8 per cent. Thus, the total fraction mass in disc-dominated components is 43 per cent.
(ii) Stellar mass in high-n classical bulges/ellipticals
(57 per cent). The remaining stellar mass is in components
with n > ndisc max. These components include the outer com-ponents of photometric ellipticals, the central comcom-ponents with
n > ndisc maxin photometric ellipticals, and the bulges of S0s and spirals withn > ndisc max. The per cent stellar mass in these systems is 57 per cent.
at Durham University Library on October 10, 2014
http://mnras.oxfordjournals.org/
Table 4. Distribution of best-fitting structural decompositions for stellar massM≥109M.
Morphology Number per bin Stage 1 Stage 1 Stage 2 Stage 2 Stage 3 Stage 3
w/o w/o w/o w/o w/o w/o
Point source Point source Point source Point source Point source Point source
(1) (2) (3) (4) (5) (6) (7) (8)
All Galaxies 69 3 3 14 24 14 11
In terms of galaxy types G1 to G5
G1: photometric disc 1 0 1 0 0 0 0
G2: photometric E 5 3 2 0 0 0 0
G3: unbarred S0, spiral 24 0 0 8 16 0 0
G4: barred S0, spiral 25 0 0 0 0 14 11
G5: photometric E with 14 0 0 6 8 0 0
extra inner component
In terms of Hubble types cD, E, S0, and spiral
cD 2 2 0 0 0 0 0
Photometric E 17 1 2 6 8 0 0
S0 44 0 1 8 12 14 9
Spiral 6 0 0 0 4 0 2
Notes.This table shows the distribution of best-fitting models and the breakdown of galaxies into classes G1 to G5 arrived at by applying the structural decomposition and galaxy classification schemes described in Section 3.3 and Figs2–4.
(iii)Environmental dependence of disc-dominated structures. Finally, we discuss howfdisc dominated, the fraction of galactic stel-lar mass in disc-dominated structures, varies with environment. For the lower density field-like environments studied by Weinzirl et al. (2009), this fractionfdisc dominatedis∼89.6 per cent for galaxies with M≥1010M. Applying the same mass cut in Coma, the fraction
fdisc dominatedis∼40.1 per cent, which is lower than in the field as expected.
Due to the effect of cosmic variance on our sample (Appendix B5), our measurement of disc-dominated stellar mass is larger by an estimated factor of 1.27, compared to what would be obtained from an unbiased sample. This is estimated by weighting the fraction of hot and cold stellar mass in elliptical, S0, and spiral galaxies (Table8) with the morphology–density distribution from GOLD Mine for the projected central 0.5 Mpc of Coma.
We also note here the results for the Virgo cluster, in which Kormendy et al. (2009) find that in galaxies withM5×109M, more than 2/3 of the stellar mass is in classical bulges/ellipticals, implying thatfdisc dominatedis less than 1/3. It may seem surprising that our value offdisc dominatedin Coma is higher than the value of 1/3 for Virgo. However, we believe this apparent discrepancy is due to the fact that the Virgo study includes the giant elliptical galaxy M87, which is marginally classified as a cD (Kormendy et al.2009), while our study excludes the two cDs in the central part of Coma. If we include these two cDs and adopt a conservative lower limit for their stellar mass, then the fractionfdisc dominatedof stellar mass in the low-ncomponent would be less than 27 per cent, since the cDs add their mass to high-nstellar components (see Appendix B4).
4.3 What fraction of stellar mass within S0, E, spirals is in disc-dominated structures versus classical bulges/ellipticals?
We now discuss how the stellar mass is distributed among E, S0, and spiral Hubble types in the projected central 0.5 Mpc of Coma. As above, fractional stellar masses are reported without including the cD galaxies.
(i)Mass distribution among high-n classical bulges/ellipticals versus low-n discy pseudo-bulges in Coma S0s and spirals. Bulges
account for ∼30.5 per cent of the stellar mass across E, S0, and spiral galaxies. The ratioR of stellar mass in high-n(n 1.7) classical bulges to low-n(n 1.7) discy pseudo-bulges is 28.3percent/2.2 per cent or 12.9.
(ii)Mass distributions among bulges in Coma S0s versus S0s in lower density environments. We next compare the bulges of Coma S0s versus S0s in LDEs. The results are summarized in Table9. We base this comparison on the results of Laurikainen et al. (2010), who derive structural parameters from 2Dmulticomponent decom-positions of 117 S0s in LDEs that include a mix of field and Virgo environments. For S0s in these LDEs withM≥7.5×10⁹M, the ratioRof stellar mass in high-n(n1.7) classical bulges to low-n (n1.7) discy pseudo-bulges is 30.6 per cent/4.7 per cent or 6.5, while it is 41.7 per cent/2.4 per cent or 17.4 in the projected central 0.5 Mpc of Coma. Note that the difference in mass stored in high-n and low-nbulges is not due to a greater frequency of high-nbulges, which is similar at this mass range.
(iii)Mass distribution in outer and inner components of photo-metric ellipticals in Coma.By definition in Section 4.1, photometric ellipticals have no outer disc. The outer components of these ellip-ticals have S´ersicnfrom 1.72 to 6.95, with a median value of 2.1. The total fractional stellar mass of the outer structures in ellipticals relative to our sample (minus the cDs) is∼25.9 per cent. Photomet-ric ellipticals may contain an inner component of any S´ersicn, and we find a range innof 0.31 to 5.88 in S´ersic index, with a median of 1.0. Inner components withn≤ndisc max represent compact inner discs analogous to the discy pseudo-bulges in S0s and spirals; most of these inner components (9/14 or 64.3±12.8 per cent) qualify as inner discs.
4.4 Scaling relations for outer discs and bulges
Here, we explore scaling relations for the bulges and outer discs in the projected central 0.5 Mpc of the Coma cluster. We assess how these structures compare with outer discs and bulges in LDEs, such as field, groups, and even low-density clusters similar to the Virgo cluster, where environmental processes and merger histories are likely to be different.
at Durham University Library on October 10, 2014
http://mnras.oxfordjournals.org/
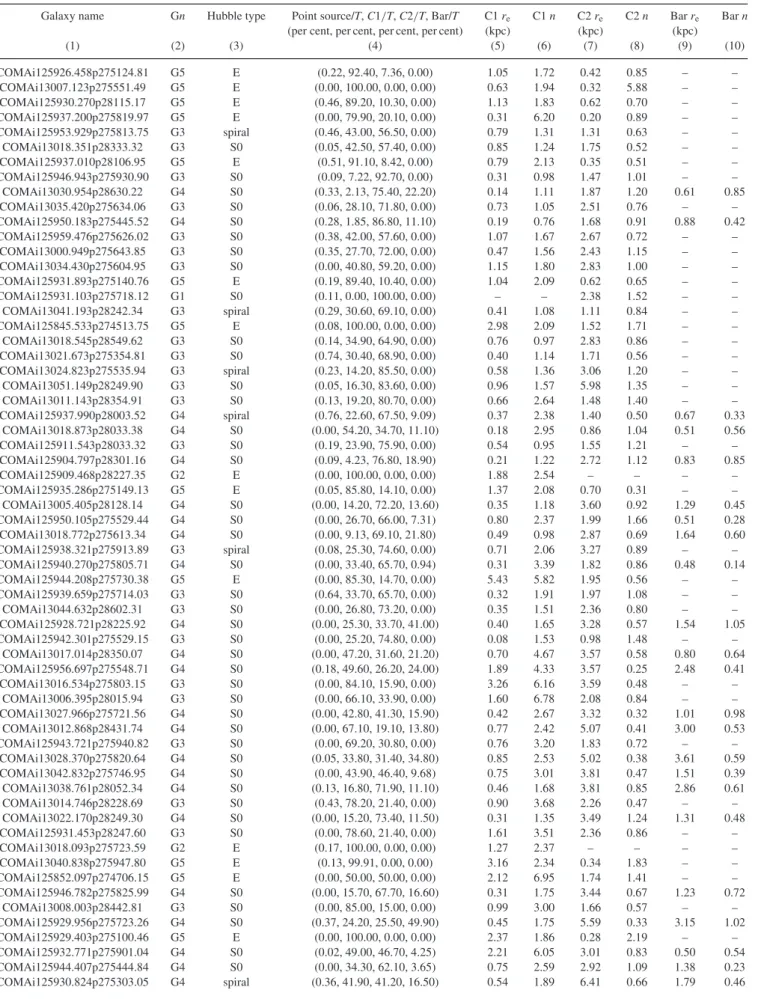
Table 5. Structural parameters for the best model.
Galaxy name Gn Hubble type Point source/T,C1/T,C2/T, Bar/T C1re C1n C2re C2n Barre Barn
(per cent, per cent, per cent, per cent) (kpc) (kpc) (kpc)
(1) (2) (3) (4) (5) (6) (7) (8) (9) (10) COMAi125926.458p275124.81 G5 E (0.22, 92.40, 7.36, 0.00) 1.05 1.72 0.42 0.85 – – COMAi13007.123p275551.49 G5 E (0.00, 100.00, 0.00, 0.00) 0.63 1.94 0.32 5.88 – – COMAi125930.270p28115.17 G5 E (0.46, 89.20, 10.30, 0.00) 1.13 1.83 0.62 0.70 – – COMAi125937.200p275819.97 G5 E (0.00, 79.90, 20.10, 0.00) 0.31 6.20 0.20 0.89 – – COMAi125953.929p275813.75 G3 spiral (0.46, 43.00, 56.50, 0.00) 0.79 1.31 1.31 0.63 – – COMAi13018.351p28333.32 G3 S0 (0.05, 42.50, 57.40, 0.00) 0.85 1.24 1.75 0.52 – – COMAi125937.010p28106.95 G5 E (0.51, 91.10, 8.42, 0.00) 0.79 2.13 0.35 0.51 – – COMAi125946.943p275930.90 G3 S0 (0.09, 7.22, 92.70, 0.00) 0.31 0.98 1.47 1.01 – – COMAi13030.954p28630.22 G4 S0 (0.33, 2.13, 75.40, 22.20) 0.14 1.11 1.87 1.20 0.61 0.85 COMAi13035.420p275634.06 G3 S0 (0.06, 28.10, 71.80, 0.00) 0.73 1.05 2.51 0.76 – – COMAi125950.183p275445.52 G4 S0 (0.28, 1.85, 86.80, 11.10) 0.19 0.76 1.68 0.91 0.88 0.42 COMAi125959.476p275626.02 G3 S0 (0.38, 42.00, 57.60, 0.00) 1.07 1.67 2.67 0.72 – – COMAi13000.949p275643.85 G3 S0 (0.35, 27.70, 72.00, 0.00) 0.47 1.56 2.43 1.15 – – COMAi13034.430p275604.95 G3 S0 (0.00, 40.80, 59.20, 0.00) 1.15 1.80 2.83 1.00 – – COMAi125931.893p275140.76 G5 E (0.19, 89.40, 10.40, 0.00) 1.04 2.09 0.62 0.65 – – COMAi125931.103p275718.12 G1 S0 (0.11, 0.00, 100.00, 0.00) – – 2.38 1.52 – – COMAi13041.193p28242.34 G3 spiral (0.29, 30.60, 69.10, 0.00) 0.41 1.08 1.11 0.84 – – COMAi125845.533p274513.75 G5 E (0.08, 100.00, 0.00, 0.00) 2.98 2.09 1.52 1.71 – – COMAi13018.545p28549.62 G3 S0 (0.14, 34.90, 64.90, 0.00) 0.76 0.97 2.83 0.86 – – COMAi13021.673p275354.81 G3 S0 (0.74, 30.40, 68.90, 0.00) 0.40 1.14 1.71 0.56 – – COMAi13024.823p275535.94 G3 spiral (0.23, 14.20, 85.50, 0.00) 0.58 1.36 3.06 1.20 – – COMAi13051.149p28249.90 G3 S0 (0.05, 16.30, 83.60, 0.00) 0.96 1.57 5.98 1.35 – – COMAi13011.143p28354.91 G3 S0 (0.13, 19.20, 80.70, 0.00) 0.66 2.64 1.48 1.40 – – COMAi125937.990p28003.52 G4 spiral (0.76, 22.60, 67.50, 9.09) 0.37 2.38 1.40 0.50 0.67 0.33 COMAi13018.873p28033.38 G4 S0 (0.00, 54.20, 34.70, 11.10) 0.18 2.95 0.86 1.04 0.51 0.56 COMAi125911.543p28033.32 G3 S0 (0.19, 23.90, 75.90, 0.00) 0.54 0.95 1.55 1.21 – – COMAi125904.797p28301.16 G4 S0 (0.09, 4.23, 76.80, 18.90) 0.21 1.22 2.72 1.12 0.83 0.85 COMAi125909.468p28227.35 G2 E (0.00, 100.00, 0.00, 0.00) 1.88 2.54 – – – – COMAi125935.286p275149.13 G5 E (0.05, 85.80, 14.10, 0.00) 1.37 2.08 0.70 0.31 – – COMAi13005.405p28128.14 G4 S0 (0.00, 14.20, 72.20, 13.60) 0.35 1.18 3.60 0.92 1.29 0.45 COMAi125950.105p275529.44 G4 S0 (0.00, 26.70, 66.00, 7.31) 0.80 2.37 1.99 1.66 0.51 0.28 COMAi13018.772p275613.34 G4 S0 (0.00, 9.13, 69.10, 21.80) 0.49 0.98 2.87 0.69 1.64 0.60 COMAi125938.321p275913.89 G3 spiral (0.08, 25.30, 74.60, 0.00) 0.71 2.06 3.27 0.89 – – COMAi125940.270p275805.71 G4 S0 (0.00, 33.40, 65.70, 0.94) 0.31 3.39 1.82 0.86 0.48 0.14 COMAi125944.208p275730.38 G5 E (0.00, 85.30, 14.70, 0.00) 5.43 5.82 1.95 0.56 – – COMAi125939.659p275714.03 G3 S0 (0.64, 33.70, 65.70, 0.00) 0.32 1.91 1.97 1.08 – – COMAi13044.632p28602.31 G3 S0 (0.00, 26.80, 73.20, 0.00) 0.35 1.51 2.36 0.80 – – COMAi125928.721p28225.92 G4 S0 (0.00, 25.30, 33.70, 41.00) 0.40 1.65 3.28 0.57 1.54 1.05 COMAi125942.301p275529.15 G3 S0 (0.00, 25.20, 74.80, 0.00) 0.08 1.53 0.98 1.48 – – COMAi13017.014p28350.07 G4 S0 (0.00, 47.20, 31.60, 21.20) 0.70 4.67 3.57 0.58 0.80 0.64 COMAi125956.697p275548.71 G4 S0 (0.18, 49.60, 26.20, 24.00) 1.89 4.33 3.57 0.25 2.48 0.41 COMAi13016.534p275803.15 G3 S0 (0.00, 84.10, 15.90, 0.00) 3.26 6.16 3.59 0.48 – – COMAi13006.395p28015.94 G3 S0 (0.00, 66.10, 33.90, 0.00) 1.60 6.78 2.08 0.84 – – COMAi13027.966p275721.56 G4 S0 (0.00, 42.80, 41.30, 15.90) 0.42 2.67 3.32 0.32 1.01 0.98 COMAi13012.868p28431.74 G4 S0 (0.00, 67.10, 19.10, 13.80) 0.77 2.42 5.07 0.41 3.00 0.53 COMAi125943.721p275940.82 G3 S0 (0.00, 69.20, 30.80, 0.00) 0.76 3.20 1.83 0.72 – – COMAi13028.370p275820.64 G4 S0 (0.05, 33.80, 31.40, 34.80) 0.85 2.53 5.02 0.38 3.61 0.59 COMAi13042.832p275746.95 G4 S0 (0.00, 43.90, 46.40, 9.68) 0.75 3.01 3.81 0.47 1.51 0.39 COMAi13038.761p28052.34 G4 S0 (0.13, 16.80, 71.90, 11.10) 0.46 1.68 3.81 0.85 2.86 0.61 COMAi13014.746p28228.69 G3 S0 (0.43, 78.20, 21.40, 0.00) 0.90 3.68 2.26 0.47 – – COMAi13022.170p28249.30 G4 S0 (0.00, 15.20, 73.40, 11.50) 0.31 1.35 3.49 1.24 1.31 0.48 COMAi125931.453p28247.60 G3 S0 (0.00, 78.60, 21.40, 0.00) 1.61 3.51 2.36 0.86 – – COMAi13018.093p275723.59 G2 E (0.17, 100.00, 0.00, 0.00) 1.27 2.37 – – – – COMAi13040.838p275947.80 G5 E (0.13, 99.91, 0.00, 0.00) 3.16 2.34 0.34 1.83 – – COMAi125852.097p274706.15 G5 E (0.00, 50.00, 50.00, 0.00) 2.12 6.95 1.74 1.41 – – COMAi125946.782p275825.99 G4 S0 (0.00, 15.70, 67.70, 16.60) 0.31 1.75 3.44 0.67 1.23 0.72 COMAi13008.003p28442.81 G3 S0 (0.00, 85.00, 15.00, 0.00) 0.99 3.00 1.66 0.57 – – COMAi125929.956p275723.26 G4 S0 (0.37, 24.20, 25.50, 49.90) 0.45 1.75 5.59 0.33 3.15 1.02 COMAi125929.403p275100.46 G5 E (0.00, 100.00, 0.00, 0.00) 2.37 1.86 0.28 2.19 – – COMAi125932.771p275901.04 G4 S0 (0.02, 49.00, 46.70, 4.25) 2.21 6.05 3.01 0.83 0.50 0.54 COMAi125944.407p275444.84 G4 S0 (0.00, 34.30, 62.10, 3.65) 0.75 2.59 2.92 1.09 1.38 0.23 COMAi125930.824p275303.05 G4 spiral (0.36, 41.90, 41.20, 16.50) 0.54 1.89 6.41 0.66 1.79 0.46
at Durham University Library on October 10, 2014
http://mnras.oxfordjournals.org/