Heritability Analysis of Surface-based Cortical Thickness Estimation
on a Large Twin Cohort
Kaikai Shen*
*a, Vincent Doré
a, Stephen Rose
a, Jurgen Fripp
a, Katie L. McMahon
b, Greig I. de
Zubicaray
c, Nicholas G. Martin
d, Paul M. Thompson
e, Margaret J. Wright
d, Olivier Salvado
aa
CSIRO Digital Productivity Flagship, Herston, Queensland, Australia;
bCentre for Advanced
Imaging, University of Queensland, Brisbane, Australia;
cSchool of Psychology, University of
Queensland, Brisbane, Australia;
dQueensland Institute of Medical Research, Brisbane, Australia;
e
Imaging Genetics Center, Institute for Neuroimaging & Informatics, University of Southern
California, Marina del Rey, CA, USA
ABSTRACT
The aim of this paper is to assess the heritability of cerebral cortex, based on measurements of grey matter (GM) thickness derived from structural MR images (sMRI). With data acquired from a large twin cohort (328 subjects), an automated method was used to estimate the cortical thickness, and EM-ICP surface registration algorithm was used to establish the correspondence of cortex across the population. An ACE model was then employed to compute the heritability of cortical thickness. Heritable cortical thickness measures various cortical regions, especially in frontal and parietal lobes, such as bilateral postcentral gyri, superior occipital gyri, superior parietal gyri, precuneus, the orbital part of the right frontal gyrus, right medial superior frontal gyrus, right middle occipital gyrus, right paracentral lobule, left precentral gyrus, and left dorsolateral superior frontal gyrus.
Keywords: Imaging genetics, structural MRI, heritability, cortical thickness analysis, gray matter
1.
INTRODUCTION
Heritability patterns of cortical structures derived from structural MRI have been extensively reported in literature1–7. In
this study we aimed to investigate the genetic influences upon the cerebral cortex within a large twin cohort. To achieve this goal, we studied the heritability of the cortical GM in terms of cortical thickness using structural MRI. As cortical folding varies significantly among population, even between monozygotic twins8, 9, we estimated the cortical thickness
of GM on structural MR images10 and used a surface-based approach to establish the correspondence of cortex across the
population. Vertex-based statistical analysis11 was employed to evaluate the genetic influence on the GM thickness.
2.
METHODS
2.1 Participants and image acquisition
The twin cohort consisted of 328 subjects (118M, 210F) with average age 22.7 ± 2.3 s.d. (range 19-29) years. Among the participants, there were 71 pairs (N=142, 48M, 94F) of MZ twins with average age 22.8 ± 2.2 s.d. (range 19-29) years, and 90 pairs (N=180, 69M, 111F) of DZ twins with average age 22.6 ± 2.4 s.d. (range 19-29) years. The T1-weighted images were acquired by a 4T Bruker Medspec whole-body scanner (Bruker Medical, Ettingen, Germany), with a magnetization-prepared rapid gradient echo (MPRAGE) sequence to resolve anatomy at high resolution. Acquisition parameters were: inversion time (TI)/repetition time (TR)/echo time (TE)=700/1500/3.35ms, flip angle=8°, slice thickness=0.9mm with a 256x256x256 acquisition matrix.
2.2 Structural MR Image Processing
For each subject, the 3-dimensional T1-weighted image was segmented into GM, WM, and cerebrospinal fluid (CSF) using an expectation maximization (EM) segmentation algorithm10. The EM algorithm computed probability maps for
each tissue type, which were discretized by assigning each voxel to its most likely tissue type. Topological corrections were applied to deep sulci, and the GM segmentation was also constrained to be a continuous layer covering the WM12.
The segmentation method used 9 different atlases to reduce the error induced by misregistration of the atlases. Each individual T1-weighted image was then segmented 9 times and a majority voting rule was used to establish a consensus for pure tissue segmentation.
2.3 Cortical Thickness Estimation and Surface-based analysis
Partial-volume effect in MRI is due to the limited image resolution as compared with the size of anatomical structures. This was taken into account using a partial-volume effect correction method10, in which classification and estimation of
tissue composition in voxels and helped to increase the precision of cortical thickness estimation (CTE) in regions such as deep sulci, where the measure of thickness was particularly difficult. Based on the pure tissue segmentations, a further maximum a posteriori classification of voxels into pure tissue WM, GM, and CSF, mixed tissues WM/GM and GM/CSF, along with the GM interface was performed, which produced a map of GM partial-volume effect. The classification also integrated with sulci detection that preserved the topology constraints12.
Once pure tissue segmentation and partial tissue classification were performed, the CTE of the resulting GM was computed using a combined voxel-based approach. The GM partial-volume effect map was used to initialize a combined Lagrangian-Eulerian approach10. The GM partial-volume effect initialization preserved the efficiency of the Eurlerian
approach while improving the accuracy. The left and right hemispheres in the segmented images were split using the Internet Brain Segmentation Repository labeling(Center for Morphometric Analysis at Massachusetts General Hospital, available at http://www.cma.mgh.harvard.edu/ibsr/). Meshes of left and right WM/GM interfaces were generated, and were topologically corrected to enforce the constraint of genus 0 topology using the Taglut tool11. Each mesh was then
geometrically smoothed, and registered to a common mesh atlas with a Multi-scale EM-ICP algorithm13. The local
curvature features at different smoothing levels were iteratively introduced into the registration algorithm to improve the surface registration. The cortical thickness values were then mapped from the image to the template surface via the registered mesh surface. Hence, each vertex of the template was associated with a CTE vector corresponding to the CTE value of all individuals at the same spatial location. A 10-mm Laplace-Beltrami smoothing was then applied to the CTE values on the template mesh.
2.4 Statistical analysis
To estimate the reliability of the MR diffusion measurements, we compared images of the same subjects at two different time points. We used the intraclass correlation (ICC) to evaluate the test-retest reliability of cortical thickness. Measurements were inverse-normalized and corrected for age and sex. The relative influences of genetic and environmental factors were expected to be different among MZ twins and DZ twins, as MZ twins share identical genes whereas DZ twins share on average only half of their genes. Using an ACE model, CTE was assumed to be subject to the influence of three factors: additive genetics A, common environment C, and residual E due to unique environment and measurement errors which are independent between individuals. We thus assumed that
. CTE=A+C+E
An efficient implementation14(available at http://warwick.ac.uk/tenichols/APACE) of least squares method in SPM
framework was used to compute the non-negative least square estimates of the variance components. Based on the variance estimation, we calculated the heritability index
. ) CTE Var( ) Var( 2 A h =
3.
RESULTS
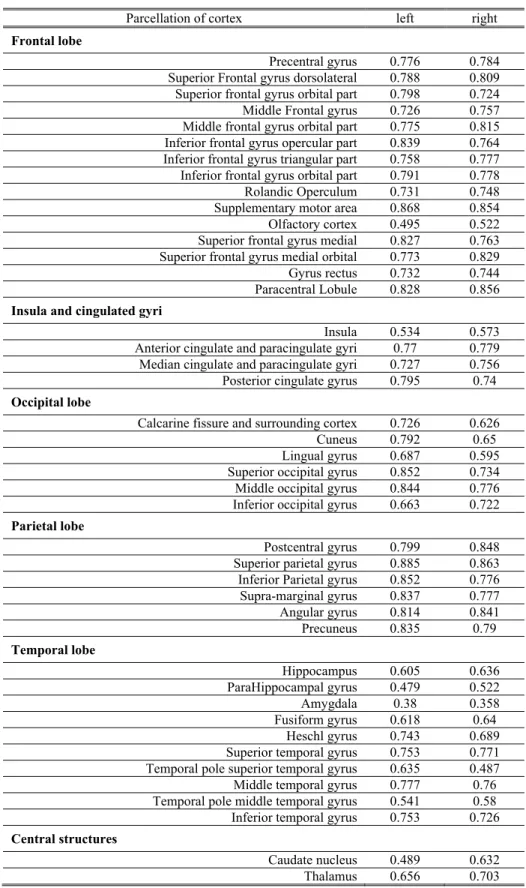
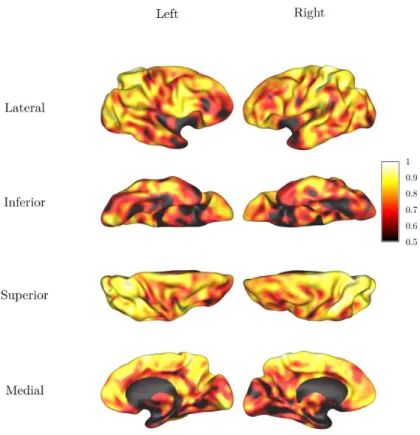
The vertex-based test-retest reliability of CTE plotted on cortical surface is shown in Figure 1. The average ICCs of vertex-based CTE across the percellated ROI by AAL atlas are listed in Table 1. It showed that the CTE pipeline produced reliable estimation in most cortical regions (with average ICC>0.7), while in areas such as olfactory cortex, insula, parahippocampal gyrus, amygdala, right lingual gyrus, temporal poles of middle and right superior temporal gyrus, and left caudate the average test-retest ICCs were below 0.6. In the following analysis, we excluded the heritability results in cortical vertices with test-retest reliability under 0.6 (Guo et al., 2012), in order to draw conclusions only from the regions with estimations of higher reliability.
Table 1. Average vertex-based test-retest reliability of cortical thickness by cortical regions of interest. Parcellation of cortex left right
Frontal lobe
Precentral gyrus 0.776 0.784 Superior Frontal gyrus dorsolateral 0.788 0.809
Superior frontal gyrus orbital part 0.798 0.724 Middle Frontal gyrus 0.726 0.757 Middle frontal gyrus orbital part 0.775 0.815 Inferior frontal gyrus opercular part 0.839 0.764 Inferior frontal gyrus triangular part 0.758 0.777 Inferior frontal gyrus orbital part 0.791 0.778 Rolandic Operculum 0.731 0.748 Supplementary motor area 0.868 0.854 Olfactory cortex 0.495 0.522 Superior frontal gyrus medial 0.827 0.763 Superior frontal gyrus medial orbital 0.773 0.829 Gyrus rectus 0.732 0.744 Paracentral Lobule 0.828 0.856
Insula and cingulated gyri
Insula 0.534 0.573 Anterior cingulate and paracingulate gyri 0.77 0.779
Median cingulate and paracingulate gyri 0.727 0.756 Posterior cingulate gyrus 0.795 0.74
Occipital lobe
Calcarine fissure and surrounding cortex 0.726 0.626 Cuneus 0.792 0.65 Lingual gyrus 0.687 0.595 Superior occipital gyrus 0.852 0.734 Middle occipital gyrus 0.844 0.776 Inferior occipital gyrus 0.663 0.722
Parietal lobe
Postcentral gyrus 0.799 0.848 Superior parietal gyrus 0.885 0.863 Inferior Parietal gyrus 0.852 0.776 Supra-marginal gyrus 0.837 0.777 Angular gyrus 0.814 0.841 Precuneus 0.835 0.79 Temporal lobe Hippocampus 0.605 0.636 ParaHippocampal gyrus 0.479 0.522 Amygdala 0.38 0.358 Fusiform gyrus 0.618 0.64 Heschl gyrus 0.743 0.689 Superior temporal gyrus 0.753 0.771 Temporal pole superior temporal gyrus 0.635 0.487 Middle temporal gyrus 0.777 0.76 Temporal pole middle temporal gyrus 0.541 0.58 Inferior temporal gyrus 0.753 0.726
Central structures
Caudate nucleus 0.489 0.632 Thalamus 0.656 0.703
Lateral Inferior Superior Medial Left Right 0.9 0.8 0.7 0.6 0.5
Figure 1. Test-retest reliability (ICC) of surface-based cortical thickness estimation.
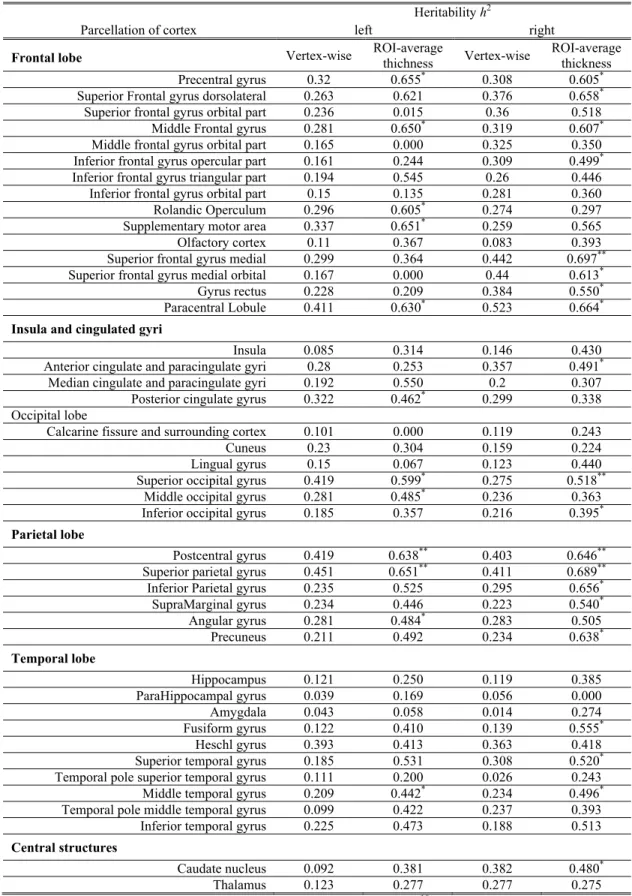
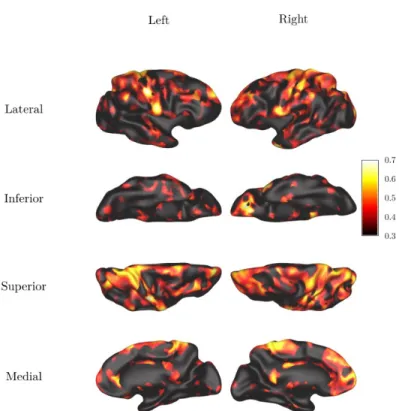
The ROI-wise average heritability of vertex-based cortical thickness and the heritability of ROI-average cortical thickness are listed in Table 2. For visualization, the heritability of cortical thickness estimation was mapped onto the cortical surface and shown in Figure 2, and the heritability of cortical ROI-average heritability is shown in Figure 3. In vertex-based analysis, bilateral postcentral gyri, paracentral lobules, superior parietal gyri, right medial superior frontal gyrus, and left superior occipital gyrus were among the heritable cortical regions with average h2 > 0.4. Significant
additive genetic component was found in the bilateral postcentral gyri, superior occipital gyri, superior parietal gyri, precuneus, the orbital part of the right frontal gyrus, right medial superior frontal gyrus, right middle occipital gyrus, right paracentral lobule, left precentral gyrus, and left dorsolateral superior frontal gyrus.
In the ROI-based analysis, with FDR corrections for 86 ROIs, we detected significant additive genetic influence on the average cortical thickness in bilateral precentral and postcentral gyri, paracentral lobues, middle frontal, superior occipital, superior parietal, middle temporal gyri, left supplementary motor area, rolandic operculum, posterior cingulate, middle occipital, angular gyrus, the medial and dorsolateral part of the right superior frontal, opercular part of the right inferior frontal, right anterior cingulate and paracigulate gyri, right inferior occipital, supra-marginal gyrus, precuneus, fusiform, superior temporal gyri, and caudate.
Table 2. Heritability h2 of cortical thickness by cortical regions of interest.
Parcellation of cortex
Heritability h2
left right Vertex-wise ROI-average thichness Vertex-wise ROI-average thickness
Frontal lobe
Precentral gyrus 0.32 0.655* 0.308 0.605*
Superior Frontal gyrus dorsolateral 0.263 0.621 0.376 0.658*
Superior frontal gyrus orbital part 0.236 0.015 0.36 0.518 Middle Frontal gyrus 0.281 0.650* 0.319 0.607*
Middle frontal gyrus orbital part 0.165 0.000 0.325 0.350 Inferior frontal gyrus opercular part 0.161 0.244 0.309 0.499*
Inferior frontal gyrus triangular part 0.194 0.545 0.26 0.446 Inferior frontal gyrus orbital part 0.15 0.135 0.281 0.360
Rolandic Operculum 0.296 0.605* 0.274 0.297
Supplementary motor area 0.337 0.651* 0.259 0.565
Olfactory cortex 0.11 0.367 0.083 0.393 Superior frontal gyrus medial 0.299 0.364 0.442 0.697**
Superior frontal gyrus medial orbital 0.167 0.000 0.44 0.613*
Gyrus rectus 0.228 0.209 0.384 0.550*
Paracentral Lobule 0.411 0.630* 0.523 0.664*
Insula and cingulated gyri
Insula 0.085 0.314 0.146 0.430 Anterior cingulate and paracingulate gyri 0.28 0.253 0.357 0.491*
Median cingulate and paracingulate gyri 0.192 0.550 0.2 0.307
Posterior cingulate gyrus 0.322 0.462* 0.299 0.338
Occipital lobe
Calcarine fissure and surrounding cortex 0.101 0.000 0.119 0.243 Cuneus 0.23 0.304 0.159 0.224 Lingual gyrus 0.15 0.067 0.123 0.440 Superior occipital gyrus 0.419 0.599* 0.275 0.518**
Middle occipital gyrus 0.281 0.485* 0.236 0.363
Inferior occipital gyrus 0.185 0.357 0.216 0.395*
Parietal lobe
Postcentral gyrus 0.419 0.638** 0.403 0.646**
Superior parietal gyrus 0.451 0.651** 0.411 0.689**
Inferior Parietal gyrus 0.235 0.525 0.295 0.656*
SupraMarginal gyrus 0.234 0.446 0.223 0.540* Angular gyrus 0.281 0.484* 0.283 0.505 Precuneus 0.211 0.492 0.234 0.638* Temporal lobe Hippocampus 0.121 0.250 0.119 0.385 ParaHippocampal gyrus 0.039 0.169 0.056 0.000 Amygdala 0.043 0.058 0.014 0.274 Fusiform gyrus 0.122 0.410 0.139 0.555* Heschl gyrus 0.393 0.413 0.363 0.418 Superior temporal gyrus 0.185 0.531 0.308 0.520*
Temporal pole superior temporal gyrus 0.111 0.200 0.026 0.243 Middle temporal gyrus 0.209 0.442* 0.234 0.496*
Temporal pole middle temporal gyrus 0.099 0.422 0.237 0.393 Inferior temporal gyrus 0.225 0.473 0.188 0.513
Central structures
Caudate nucleus 0.092 0.381 0.382 0.480*
Thalamus 0.123 0.277 0.277 0.275
Lateral Inferior Superior Medial Left Right
dth
i
0.7 0.6 0.5 0.4 0.3 Left Right Lateral Inferior Superior MedialAI Ilkw Ad II)
14ii'll'
410)
I
1 0.8 0.6 0.4 0.2Figure 2. Heritability (h2) map of cortical thickness, masked by test-retest reliability, showing only the heritable measure
with reliability ICC > 0.6.
4.
DISCUSSIONS
We found that cortical thickness was in several cortical regions, including the paracentral gyri, various cortical regions in the frontal lobe, and the superior parietal gyri. In general, heritable cortical thickness measurements were found mainly in frontal and parietal lobes. Similar patterns in the heritability of cortical thickness have been reported in a prior study by Joshi et al.6 on the same cohort (using a different set of subjects) with the thickness estimated using the FreeSurfer
software. We found the pronounced heritability in the thickness of precentral and postcentral gyri bilaterally along with the paracentral lobules continuous to them. Strong genetic influence has been reported in prior studies5, and the
development of the primary somatosensory cortex in these regions has been shown to be highly genetically determined3.
In the frontal lobe, we found thickness in dorsolateral part of bilateral superior frontal gyri, bilateral middle frontal gyri, bilateral supplementary motor areas, medial and medial orbital parts of the right superior frontal gyrus show high heritability which have also been previously reported4, 7. Lenroot et al.3 found significant genetic effects on the thickness
in the frontal pole, dorsolateral and orbital prefrontal cortices, and prefrontal gyrus. VBM study also revealed high heritability in GM density in medial prefrontal cortex and superior frontal gyrus2. Thickness estimated in the right
orbitofrontal cortex was also found to be heritable in our study, in agreement with prior findings of genetic influence in the orbitofrontal cortex3. In contrast, a VBM study found the GM concentration not significantly heritable in this
region15.
In the parietal lobe, our finding of heritable thickness in the superior parietal gyrus agrees with previous reports3, 4. Left
precuneus thickness was found heritable4, while in our results the right precuneus was detected with higher heritability.
Our results confirmed the heritable thickness of superior temporal gyri3, 5, 15, where the GM density was also found
heritable2.
REFERENCES
[1] Thompson P. M., Cannon T. D., Narr K. L., van Erp T., Poutanen V.-P., Huttunen M., Lönnqvist J., Standertskjöld-Nordenstam C.-G., Kaprio J., Khaledy M., Dail R., Zoumalan C.I., Toga A.W., “Genetic influences on brain structure,” Nat Neurosci 4, 1253–125 (2001).
[2] Hulshoff Pol H.E., Schnack H.G., Posthuma D., Mandl R.C.W., Baaré W.F., van Oel C., van Haren N.E., Collins D.L., Evans A.C., Amunts K., Bürgel U., Zilles K., de Geus E., Boomsma D.I., Kahn R.S., “Genetic Contributions to Human Brain Morphology and Intelligence,” J Neurosci 26, 10235–10242 (2006).
[3] Lenroot R.K., Schmitt J.E., Ordaz S.J., Wallace G.L., Neale M.C., Lerch J.P., Kendler K.S., Evans A.C., Giedd J.N., “Differences in genetic and environmental influences on the human cerebral cortex associated with development during childhood and adolescence,” Human Brain Mapping 30,163–174 (2009).
[4] Panizzon M.S., Fennema-Notestine C., Eyler L.T., Jernigan T.L., Prom-Wormley E., Neale M., Jacobson K., Lyons M.J., Grant M.D., Franz C.E., Xian H., Tsuang M., Fischl B., Seidman L., Dale A., Kremen W.S., “Distinct Genetic Influences on Cortical Surface Area and Cortical Thickness,” Cereb Cortex 19, 2728–2735 (2009).
[5] Winkler A.M., Kochunov P., Blangero J., Almasy L., Zilles K., Fox P.T., Duggirala R., Glahn D.C., “Cortical thickness or grey matter volume? The importance of selecting the phenotype for imaging genetics studies,” NeuroImage 53, 1135–1146 (2010).
[6] Joshi A.A., Leporé N., Joshi S.H., Lee A.D., Barysheva M., Stein J.L., McMahon K.L., Johnson K., de Zubicaray G.I., Martin N.G., Wright M.J., Toga A.W., Thompson P.M., “The contribution of genes to cortical thickness and volume,” NeuroReport 22, 101–105 (2011).
[7] Eyler L.T., Chen C.-H., Panizzon M.S., Fennema-Notestine C., Neale M.C., Jak A., Jernigan T.L., Fischl B., Franz C.E., Lyons M.J., Grant M., Prom-Wormley E., Seidman L.J., Tsuang M.T., Fiecas M.J.A., Dale A.M., Kremen W.S., “A Comparison of Heritability Maps of Cortical Surface Area and Thickness and the Influence of Adjustment for Whole Brain Measures: A Magnetic Resonance Imaging Twin Study,” Twin Research and Human Genetics 15, 304–314 (2012).
[8] Bartley A.J., Jones D.W., Weinberger D.R., “Genetic variability of human brain size and cortical gyral patterns,” Brain 120, 257–269 (1997).
[9] Biondi A., Nogueira H., Dormont D., Duyme M., Hasboun D., Zouaoui A., Chantôme M., Marsault C., “Are the brains of monozygotic twins similar? A three-dimensional MR study,” AJNR Am J Neuroradiol 19, 1361–1367 (1998).
[10]Acosta O., Bourgeat P., Zuluaga M.A., Fripp J., Salvado O., Ourselin S., “Automated voxel-based 3D cortical thickness measurement in a combined Lagrangian–Eulerian PDE approach using partial volume maps,” Medical Image Analysis 13, includes Special Section on the 12th International Conference on Medical Imaging and Computer Assisted Intervention: 730–743 (2009).
[11]Acosta O., Fripp J., Doré V., Bourgeat P., Favreau J.-M., Chételat G., Rueda A., Villemagne V.L., Szoeke C., Ames D., Ellis K.A., Martins R.N., Masters C.L., Rowe C.C., Bonner E., Gris F., Xiao D., Raniga P., Barra V., Salvado O., “Cortical surface mapping using topology correction, partial flattening and 3D shape context-based non-rigid registration for use in quantifying atrophy in Alzheimer’s disease,” Journal of Neuroscience Methods 205, 96–109 (2012).
[12]Rueda A., Acosta O., Couprie M., Bourgeat P., Fripp J., Dowson N., Romero E., Salvado O., “Topology-corrected segmentation and local intensity estimates for improved partial volume classification of brain cortex in MRI,” Journal of Neuroscience Methods 188, 305–315 (2010).
[13]Doré, V., Fripp, J., Bourgeat, P., Shen K., Salvado, O., Acosta, O., “Surface-Base Approach Using a Multi-scale EM-ICP Registration for Statistical Population Analysis,” 2011 International Conference on Digital Image Computing Techniques and Applications (DICTA), 13–18 (2011).
[14]Chen X., Blokland, G., Strike, L., Nichols T., “Voxel-wise and cluster-based heritability inferences of fMRI data,” 2013 Organization of Human Brain Mapping (OHBM), Seattle, WA, (2013).
[15]Schmitt J.E., Neale M.C., Fassassi B., Perez J., Lenroot R.K., Wells E.M., Giedd J.N., “The dynamic role of genetics on cortical patterning during childhood and adolescence,” PNAS 111, 6774–6779 (2014).