RISK BASED FRAMEWORK FOR CRITICAL DECISION MAKING
by
© Mark van Staalduinen
A Thesis submitted to the
School of Graduate Studies
in partial fulfillment of the requirements for the degree of
Master of Engineering
Faculty of Engineering and Applied Science
Memorial University of Newfoundland
October, 2016
ii
ABSTRACT
Risk analysis is a science of understanding and quantifying the probability of the occurrence(s) of undesirable event(s). Traditionally, risk assessments have been concerned with the management of safety based incidents. Recent attacks on chemical facilities in the Middle East and Northern Africa illustrate the need to broaden the risk management mindset. This body of work proposes quantitative barrier-based methodologies to assist management of broad-based decision-making processes. This research began by exploiting concepts from security-based research accompanied with a barrier-based methodology from safety research through both fault and event trees. This work expands into mapping the trees onto Bayesian Networks to manipulate the conditional probability table of intermediate variables. This manipulation allows for the implementation of various relaxation assumptions. Case studies accompany each proposed approach to illustrate its execution. The goal of this work is to raise awareness of quantitative security based methodologies and to assist in critical decision-making.
iii
ACKNOWLEDGEMENTS
I would like to recognize my gratitude towards my supervisors Dr. Faisal Khan and Dr. Veeresh Gadag for their comments, mentorship, and guidance through the learning process of this master thesis. Furthermore, I would like to thank them for their insightful support and constructive criticism to endlessly push me to become a better engineer, researcher, and person. To them, I am eternally thankful.
I am grateful for Dr. Genserik Reniers, who assisted and provided remarks in completion of the Chapter 3 manuscript.
Additionally, I would like to thank my parents and immediate family members for their undying support, constant source of love, and encouragement to pursue higher education. I would also like to thank my fiancée, Jennifer, who helped me to stay focused on my graduate studies. Without their help, I would not be the person I am today.
iv
Table of Contents
ABSTRACT ... ii
ACKNOWLEDGEMENTS ... iii
List of Tables ... viii
List of Figures ... xi
List of Symbols, Nomenclature or Abbreviations ... xiv
Introduction and Overview ... 1
Co-authorship Statement ... 7
Chapter 1: A Barrier Based Methodology to Assess Site Security Risk ... 9
1.0 Abstract ... 9
1.1 Introduction ... 10
1.2 Probabilistic Risk Assessment ... 17
1.3 Model Presentation ... 24
1.4 Data Sources ... 35
1.5 Case Study ... 37
1.6 Conclusion ... 47
1.7 References ... 48
Chapter 2: SVAPP Methodology: A Predictive Security Vulnerability ... 52
Assessment Modelling Method ... 52
v
2.1 Introduction ... 53
2.2 Research Backgrounds ... 54
2.3 Proposed SVAPP Methodology ... 62
2.4 Case Study ... 74
2.5 Analysis of Case Study ... 91
2.6 Conclusion ... 92
2.7 References ... 93
Chapter 3: Functional Quantitative Security Risk Analysis (QSRA) to Assist in .... 96
Protecting Critical Process Infrastructure ... 96
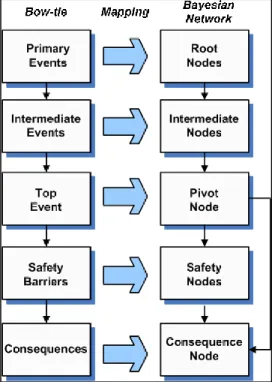
3.0 Abstract ... 96 3.1 Introduction ... 96 3.2 Analysis Techniques ... 100 3.2.1 Bow-Tie Model... 100 3.2.2 Bayesian Network ... 100 3.2.3 Bow-Tie Mapping ... 101
3.3 Quantitative Security Risk Assessment Methodology (QSRA) ... 102
3.3.1 Asset Characterization ... 104
3.3.2 Threat Assessment ... 104
vi
3.3.3 Vulnerability Assessment ... 106
3.3.4 Attack Scenario Likelihood Assessment ... 106
3.3.5 Attack Scenario Consequence Assessment ... 108
3.3.6 Risk Assessment ... 110
3.3.7 Identification of Countermeasures ... 111
3.3.8 Cost Analysis of Risk Reduction Strategies ... 111
3.3.9 Implementation of Countermeasure ... 112
3.3.10 Risk Monitoring and Tracking ... 113
3.4 Case Study ... 114
3.4.1 Asset Characterization ... 115
3.4.2 Threat Assessment ... 116
3.4.3 Vulnerability Assessment ... 117
3.4.4 Attack Scenario Likelihood Assessment ... 117
3.4.5 Attack Scenario Consequence Assessment ... 119
3.4.6 Risk Assessment ... 120
3.4.7 Identification of Countermeasures ... 123
3.4.8 Cost Analysis of Risk Reduction Strategies ... 123
3.4.9 Implementation of Countermeasures ... 124
vii
3.5 Discussion of Case Study Results ... 127
3.6 Conclusion ... 127
3.7 References ... 128
Summary ... 132
viii
List of Tables
Table 1 - 1: Likelihood Terms and Associated Probability Range ... 37
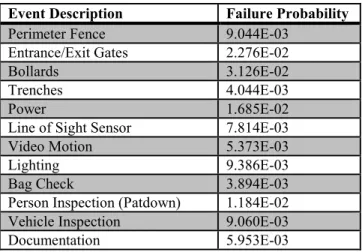
Table 1 - 2: Basic event failure probability for External Security Barrier ... 39
Table 1 - 3: Basic event failure probability for Internal Security Barrier ... 39
Table 1 - 4: Basic event failure probability for Interior Security Barrier ... 40
Table 1 - 5: Basic event failure probability for Critical Security Barrier ... 40
Table 1 - 6: Basic event failure probability for Fail-Safe Security Barrier... 40
Table 1 - 7: Basic event failure probability for Management and Organization Barrier .. 40
Table 1 - 8: Basic event failure probability for Political Barrier ... 41
Table 1 - 9: Failure probability data for each security barrier ... 41
Table 1 - 10: Consequence Occurrence Probability... 42
Table 1 - 11: Assigned Relaxation Assumption Probabilities for each parent event ... 43
Table 1 - 12: Relaxation Techniques Failure Probabilities ... 43
Table 1 - 13: Cumulative Number of Abnormal Events over last 12 months ... 44
Table 1 - 14: Barrier Likelihood Probabilities ... 45
Table 1 - 15: Barrier Posterior Probabilities ... 45
Table 2 - 1: Comparison of Security Methodologies ... 58
Table 2 - 2: Consequence Comparison ... 73
Table 2 - 3: Basic Event Failure probabilities for External Barrier ... 76
Table 2 - 4: Basic Event Failure probabilities for Interior Barrier... 77
Table 2 - 5: Basic Event Failure probabilities for Internal Barrier ... 77
ix
Table 2 - 7: Basic Event Failure probabilities for Fail-Safe Barrier ... 78
Table 2 - 8: Basic Event Failure probabilities for Management and Organization Barrier ... 78
Table 2 - 9: Basic Event Failure probabilities for Political Barrier ... 79
Table 2 - 10: Example Calculation of Intermediate Node ... 80
Table 2 - 11: Failure and Consequence Occurrence Probabilities ... 81
Table 2 - 12: Cumulative Number of Consequence Events from past 12 months ... 81
Table 2 - 13: Developed Likelihood Probabilities ... 82
Table 2 - 14: Scenarios with Respective Probabilities ... 85
Table 2 - 15: External Node CPT Case 3 ... 89
Table 2 - 16: External Node CPT Case 4 ... 89
Table 3 - 1: Threat Credibility ... 105
Table 3 - 2: Consequence Definition ... 106
Table 3 - 3: Asset Group Designation ... 110
Table 3 - 4: Asset Group to Severity Matching ... 110
Table 3 - 5: Security Risk Indicators ... 114
Table 3 - 6: Asset Criticality Designation ... 115
Table 3 - 7: Operation Center Countermeasures ... 116
Table 3 - 8: Attack Scenarios for Operation Center... 117
Table 3 - 9: Primary Node Probabilities ... 118
Table 3 - 10: Intermediate Node Probabilities ... 119
x
Table 3 - 12: Manned Attack Consequence Results ... 120
Table 3 - 13: Vehicle Attack Consequence Results ... 120
Table 3 - 14: Aerial Attack Consequence Results ... 120
Table 3 - 15: Security Countermeasure Proposals ... 123
xi
List of Figures
Figure 1 - 1: Swiss Cheese Model: Swiss Cheese Model (Adapted from Reason, 2000) 12 Figure 1 - 2: SHIPP Conceptual Accident Model (adapted from Rathnayaka et. al, 2011)
... 12
Figure 1 - 3: Rings of Protection from CCPS (2003) ... 14
Figure 1 - 4: Mapping Flowchart (Khakzad et al. 2012) ... 19
Figure 1 - 5: The Attack Model ... 24
Figure 1 - 6: Proposed External Security Barrier Fault Tree ... 26
Figure 1 - 7: Proposed Internal Security Barrier Fault Tree ... 27
Figure 1 - 8: Proposed Interior Security Barrier Fault Tree ... 28
Figure 1 - 9: Proposed Critical Security Barrier Fault Tree ... 29
Figure 1 - 10: Proposed Fail-Safe Security Barrier Fault Tree ... 30
Figure 1 - 11: Proposed Management and Organization Security Barrier Fault Tree ... 31
Figure 1 - 12: Proposed Political Security Barrier Fault Tree ... 32
Figure 1 - 13: Attack Sequence Event Tree ... 33
Figure 1 - 14: External Barrier Mapped in a Bayesian Network ... 35
Figure 1 - 15: Basic Event Failure Pathways ... 36
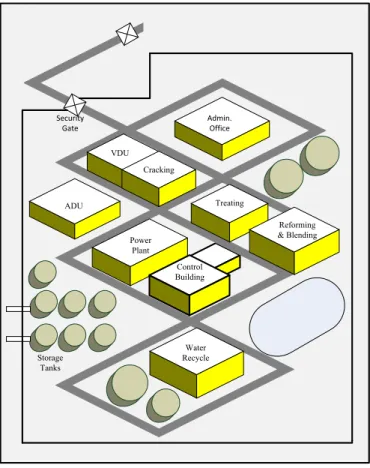
Figure 1 - 16: Case Study Refinery Layout ... 38
Figure 1 - 17: Case Study Control Building Layout ... 39
Figure 1 - 18: Updated Consequence Probability for Safe and Near Miss ... 46
Figure 1 - 19: Updated Consequence Probability for Incident and Light Attack ... 46
xii
Figure 2 - 2: Proposed SVAPP Methodology Phases ... 63
Figure 2 - 3: Proposed Attack Model ... 64
Figure 2 - 4: Proposed Mapping of fault tree for External Barrier ... 66
Figure 2 - 5: Proposed Mapping of fault tree for Internal Barrier ... 66
Figure 2 - 6: Proposed Mapping of fault tree for Interior Barrier ... 67
Figure 2 - 7: Proposed Mapping of fault tree for Critical Barrier ... 67
Figure 2 - 8: Proposed Mapping of fault tree for Fail-Safe Barrier ... 68
Figure 2 - 9: Proposed Mapping of fault tree for Management and Organization Barrier 69 Figure 2 - 10: Proposed Mapping of fault tree for Political Barrier ... 70
Figure 2 - 11: Proposed Event Tree (van Staalduinen and Khan, 2015) ... 71
Figure 2 - 12: Proposed Mapping of the event tree for BN Network ... 72
Figure 2 - 13: LNG Gas Treating Plant... 75
Figure 2 - 14: Posterior Failure Probability of Security Barriers ... 83
Figure 2 - 15: Updated Safe Consequence Occurrence Probability ... 83
Figure 2 - 16: Updated Near Miss Consequence Occurrence Probability ... 84
Figure 2 - 17: Updated Incident Consequence Occurrence Probability... 84
Figure 2 - 18: Updated Light Attack Consequence Occurrence Probability ... 84
Figure 2 - 19: Scenario and Consequence Occurrence Probability ... 86
Figure 2 - 20: Scenario and Consequence Occurrence Probability ... 86
Figure 2 - 21: Scenario and Consequence Occurrence Probability ... 87
Figure 2 - 22: Event Network with Dependencies ... 88
Figure 2 - 23: Case with Barrier Failure Probability ... 90
xiii
Figure 3 - 1: General Mapped Bow-Tie Model ... 102
Figure 3 - 2: The Proposed Methodology ... 103
Figure 3 - 3: Mapped Fault Tree of Attack ... 107
Figure 3 - 4: Mapped BT Model ... 109
Figure 3 - 5: Aerial Attack BT Model ... 109
Figure 3 - 6: Case Study of LNG Facility ... 115
Figure 3 - 7: Graphical Display of Attack Likelihood for Type of Attack ... 119
Figure 3 - 8: Risk Profile based on Mapped BN ... 121
Figure 3 - 9: Risk Profile based on Noisy-OR ... 121
Figure 3 - 10: Risk Profile based on Leaky Noisy-OR ... 122
Figure 3 - 11: Risk Profile based on Noisy-AND ... 122
Figure 3 - 12: Comparison of Changed in Attack Likelihood ... 126
xiv
List of Symbols, Nomenclature or Abbreviations
α – gamma distribution shape parameter β – gamma distribution scale parameter θ – unknown parameter
λ – prior distribution
λp – mean value of posterior distribution ci – causation probability
cL – leaky parameter
k – consequence severity level NF,i – number of failures at barrier i
NS,i – number of success at barrier i
P(E) – basic event failure P(T) – threat probability
qi – inhibitor probability
SBk – security barrier associated with level k si – substitution probability
t – time interval
xi – child node
yn – likelihood distribution data
z – discrete random variable
ACC – American Chemistry Council
ANSI – American National Standards Institute APCI – Air Products and Chemicals Inc.
xv API – Ameircan Petroleum Institute
ASME – American Society of Mechanical Engineers AVM – Asset Vulnerability Model
BN – Bayesian Network BT – Bow Tie
C – Communication
CCPS – Center for Chemical Process Safety
CFATS – Chemical Facility Anti-Terrorism Standards CPT – Conditional Probability Table
DHS – Department of Homeland Security F – Fortification
FRT – Facility Response Team FTA – Fault Tree Analysis LNG – Liquefied Natural Gas NRC – National Research Council
P&ID – Piping and Instrumentation Diagram PRA – Probabilistic Risk Assessment
QSRA – Quantitative Security Risk Assessment
RAMCAP – Risk Analysis and Management for Critical Asset Protection SHIPP – System Hazard Identification, Prevention and Prediction
SRA – Security Risk Assessment SRFT- Security Risk Factor Table
xvi
SVAPP – Security Vulnerability Assessment, Prevention and Prediction TA – Threat Analysis/Assessment
1
Introduction and Overview
Risk analysis is a science of understanding and quantifying the probability of the occurrence of undesired events and associated outcomes. It aims to demystify uncertainty connected with these undesired events and outcomes. The chemical process industry encourages the application of Probabilistic Risk Assessment (PRA) as a risk analysis method to study the occurrence of low probability – high consequence accidents. Through implementation of the methodologies, these accidents and their outcomes can be mitigated. Risk analysis in the area of chemical safety is focused on unintentional acts whereas, in chemical security, risk analysis focuses on intentional acts. Following the attacks on September 11, 2001, the Department of Homeland Security (DHS) was granted the authority to manage security risk in chemical plants within the United States (U.S.) (DHS, 2003). The goal of the DHS was to regulate security of chemical plants involving high risk chemicals (DHS, 2003). This goal led to the development of PRA as a risk analysis method by using estimates of different components of risk, based on opinions of experts in the industry (Sadiq 2013). Furthermore, the development of Chemical Facility Anti-Terrorism Standards (CFATS) imposed federal regulations on chemical facilities considered to be at high risk (DHS, 2007). Later, Sadiq (2013) recognized that CFATS still needed improvements and implored researchers to further investigate how enhancements could be made in PRA technique.
There has been much controversy over which technique is best suited to conduct a risk analysis associated with terrorism. The National Research Council (NRC) (2008) highlighted the difficulty in assessing the proper risk probability as techniques are based solely on expert opinion. However, Ezell et al. (2010) argued that while there are
2
shortcomings in PRA technique, this methodology can still be utilized effectively to understand terrorism risk. The methodologies presented in this thesis go one step further in addressing the concern of the NRC. Within this research, we obtain the initial risk estimates based on the use of existing PRA method. We then use these values as prior probabilities in the Bayesian analysis techniques to continually update the security risk probabilities based on real data on incidents as they unfold over time and provide estimates of realistic risk probabilities in real time.
The methodologies presented in the subsequent chapters are based on barrier approach methods known as epidemiological accident models. Epidemiological accident models can easily be understood through Reason’s “Swiss Cheese” model (1990). Reason’s model proposes that each “slice of cheese” acts as a barrier and an accident occurs when holes in the barriers align. The hole in a barrier can be a failure or a weakness of the system which then illustrates that an accident is a process of multiple causalities. To better depict the complete accident process, Kujath et al. (2010) combined Reason (1990) and Bird and Germain (1996) to develop a conceptual model for an offshore environment. This qualitative barrier approach with five mechanical barriers used both fault trees and an event trees to illustrate the escalation of an accident if a particular barrier was to fail.
Rathnayaka et al. (2011) further enhanced the conceptual model proposed by Kujath et al. (2010) to expand the model to all process industries. System hazard identification, prevention and prediction (SHIPP) methodology added the dimension of event tree analysis and basic probability failure to transform the approach into a probabilistic risk assessment (PRA). In addition, the authors added two more barriers that
3
account for human interaction within the system. The quantitative component was executed through event tree analysis (ETA) and determineed the likelihood of various types of accidents. Rathanayaka et al. (2011) introduced an updating mechanism and predictive component which minimized uncertainties. The predictive component used past history data to determine the expected future events in the subsequent time interval. Meanwhile, the updating mechanism utilized new information and data based on the number of events that occurred as they occur to update the likelihood of each consequence.
Probabilistic risk assessments can be executed through the use of fault and event trees, Bayesian Networks (BN), and Bow-Tie models. Fault and event tree analysis is widely used and is a common approach to determine the failure probability of a system. A top event or system failure can be broken down into further sub systems and components linked through Boolean logic gates. At the base of each fault tree are the basic events, typically failures, that may trigger the gate above it based on the logic assigned. Basic event probability can be found through historical data, literature, or where needed, expert judgment. Event tree analysis is utilized to show the sequence of failures that lead to the various consequences. The top event probability, which can be represented by a barrier or system failure, helps to calculate the occurrence probabilities for each consequence. Delvosalle et al. (2005) described a Bow-Tie model as a fault tree that ties directly into an event tree. The basic events are on the left side and consequences are on the right side. Furthermore, both the fault and event trees can be mapped into Bayesian Networks (BN) (Bobbio et al. 2001). BN are graphical method used to illustrate relationships between events and outcomes. A parent node (event) will have a direct arc
4
to a child node (outcome), where the arc denotes a direct relationship between the two nodes. A BN has the ability to combine any finite number of variables into one joint probability distribution (Díez and Druzdel 2007). Through the graphical presentation, BN have the ability to aid decision makers as they perceive the direction of casual influence of one variable over another. Additionally, BN allows for the conditional probability table (CPT) to be manipulated. Pearl (1988) first introduced the concept of Noisy-OR, where a probability exists that may inhibit the parent node to cause the child node even if the parent node is still active. Other CPT manipulations have been developed such as, the Leaky Noisy-OR and the Noisy-AND (Díez and Druzdel 2007). The Leaky Noisy-OR is a similar cause to the Noisy-OR however, it adds a leak parameter that accounts for causes that could not be explicitly modelled (Adedigba et al. 2016; Abimbola et al. 2016). Meanwhile, the Noisy-AND adds a substitution probability that is replaced when a node is not active. Therefore, in the Noisy-AND technique, a parent node will either have a substitution or inhibitor probability.
While chemical safety risk assessments focus on natural-unintentional events, chemical security risk assessments concentrate on unnatural-intentional acts. Chemical processing facilities are targets for both criminal and terrorist acts as they contain hazardous, expensive materials in large quantities which may cause substantial causalities, economic loss, and have an environmental impact. In 2003, the Center for Chemical Process Safety (CCPS, 2003) released a document that outlined a Security Vulnerability Assessment (SVA) that discussed physical security analysis for a chemical site including management and prevention strategies. The CCPS (2003) described multiple concepts and defined numerous terms such as, rings of protection. Rings of
5
protection is a concept whereby, the most valuable assets are located in the center and each ring has increasing security measures to further protect the asset. An intruder must penetrate numerous rings to reach the asset. The SVA methodology (CCPS, 2003) is broken down into five [5] steps which are: (1) Project Planning, (2) Facility Characterization, (3) Threat Assessment, (4) Vulnerability Analysis, and (5) Identify Countermeasures. The goal of project planning is to outline the objectives and scope developed by a multifaceted team. Facility characterization identifies critical assets, attractiveness of a target, and the possible consequences. Threat assessment defines the threats which may be internal, external, or a combination of an internal source colluding with an external source. The vulnerability analysis step combines an asset with a threat to evaluate the degree of vulnerability through either an asset-based approach and/or a scenario-based approach. Lastly, countermeasures are identified to provide improvements that would meet the security standards designated by the SVA team.
Within this thesis, we combined quantitative measures found in the safety discipline with the qualitative components of the security approach. Through this amalgamation, separate methodologies have been developed and demonstrated through case studies in the subsequent chapters. Chapter 1, entitled ‘A Barrier Based
Methodology to Asses Site Security Risk’, builds the basis for the subsequent two chapters
entitled ‘SVAPP Methodology: A Predictive Security Vulnerability Assessment Modelling
Method’ (Chapter 2) and ‘Functional Quantitative Security Risk Analysis (QSRA) to
Assist in Protecting Critical Process Infrastructure’ (Chapter 3).
In Chapter 1, the initial fault trees for each barrier are developed and the event tree is established. Furthermore, each fault and event tree are mapped into BN and each
6
CPT manipulation technique mentioned is explored. Chapter 2 proposes a Security Vulnerability Assessment, Prevention and Prediction (SVAPP) methodology that builds upon the foundations of Chapter 1 and continues to explore the relationships among the separate mapped barriers. The SVAPP, similar to SHIPP, executes an updating mechanism to continually obtain more accurate estimates of uncertainty (risk). It also has a prediction component to predict the total number of incidents that can be expected for the next time frame.
Chapter 3 is an independent methodology that utilizes the Bow-Tie concept to determine the overall attack probability and the subsequent consequence occurrence probabilities. The mapped fault tree to determine the attack probability adds more to detail the political barrier that was illustrated in Chapter 1. Additionally, the probabilities are altered depending on the various type of attacks that could be orchestrated on a chemical processing plant. If the risk is deemed not acceptable, the QSRA methodology allows for reassessment through a cost analysis of risk reduction strategies. The proposed QSRA approach contains a risk monitoring and tracking component through the use of key indicators, to ensure a re-assessment of the security program if an indicator changes.
As illustrated through the subsequent chapters, the goal of this manuscript is to raise awareness for the need of quantitative security methodologies to assist in an overall risk analysis of a chemical processing plant.
7
Co-authorship Statement
I hereby declare that the manuscript titled A Barrier Based Methodology to Assess Site Security Risk (van Staalduinen M, Khan F. A Barrier Based Methodology
to Assess Site Security Risk. In: SPE E&P Health, Safety, Security, and Environmental
Conference – Americas; 2015 Mar 16 – Mar 18, 2015; Denver, USA. Copy of the document available from Department of Process Engineering, Memorial University, St John’s, Canada). As primary author, I led the development of the framework, its implementation, and analysis of the results with the help of co-author, Dr. Faisal Khan. I have drafted the initial manuscript, which was reviewed and commented by co-authors. Their suggestions were later incorporated in the final manuscript. As co-author, Faisal Khan helped developing the framework, and supported in finalizing the methodology to implement the framework. He also contributed in reviewing and revising the manuscript.
For the manuscript titled SVAPP Methodology: A Predictive Security
Vulnerability Assessment Modelling Method (van Staalduinen MA, Khan FI, Gadag V.
SVAPP Methodology: A Predictive Security Vulnerability Assessment Modelling Method. Loss Prevention in the Process Industries. 2016; 43: 397-413), I declare it was a joint research collaboration between: primary author, Dr. Faisal Khan, and Dr. Veeresh Gadag. I am the lead on this work. With the assistance of co-authors (Dr. Faisal Khan and Dr. Veersah Gadag) I developed the framework and implemented, analyzed and compiled the results. I have drafted the initial manuscript, which was reviewed and commented by co-authors. Their suggestions were later incorporated in the final manuscript. Co-authors (Dr. Faisal Khan and Dr. Veersah Gadag) helped developing the
8
framework and supported in finalizing the methodology to implement the framework. They have also contributed in reviewing and revising the manuscript.
Finally, the third manuscript titled Functional Quantitative Security Risk Analysis
(QSRA) to Assist in Protecting Critical Process Infrastructure (van Staalduinen MA,
Khan FI, Gadag V, Reniers G. Functional Quantitative Security Risk Analysis (QSRA) to Assist in Protecting Critical Process Infrastructure. Reliability Engineering and System Safety. 2017; 157: 23-34). I declare it was a joint research collaboration between: primary author, Dr. Faisal Khan, Dr. Veeresh Gadag and Dr. Genserik Reniers. I am the lead on this work. With the assistance of co-authors (Dr. Faisal Khan, Dr. Veeresh
Gadag, and Dr. Genserik Reniers) I developed the framework and implemented, analyzed and compiled the results. I have drafted the initial manuscript, which was reviewed and commented by co-authors. Their suggestions were later incorporated in the final
manuscript. Co-authors (Dr. Faisal Khan Dr. Veeresh Gadag, and Dr. Genserik Reniers) helped developing the framework, and supported in finalizing the methodology to
implement the framework. They have also contributed in reviewing and revising the manuscript.
9
Chapter 1: A Barrier Based Methodology to Assess Site Security Risk 1.0 Abstract
The recent attacks on petroleum plants in various countries such as Algeria, Nigeria, and Iraq have greatly changed the risk mindset of the chemical industry (Johnson and Gilbert, 2013; Nordland and Al-Sahy, 2014). Risk assessments and management traditionally are conducted on unintended (safety related) incidents and not on intentional acts. These intentional acts could either be from an internal or external source. This paper extends the probabilistic risk assessment methodology (generally focus on safety unintended) to the security facet (focusing on intended incidents) of a processing facility. The methodology is based on the barrier approach. Five security barriers are proposed throughout the facility to help deter an attack. These security barriers are external, internal, interior, critical, and the fail-safe barrier, which are implemented at various stages of a plant with varying objectives. For example, the fail-safe barrier aims to bring the plant to safe shutdown mode, once it observes breach of the barrier. Breach of each barrier is modeled using fault tree approach. A number of monitoring parameters are proposed to track the effectiveness of the barrier, which are modeled as basic events in the fault tree. The occurrence of each basic event is modeled using two failure modes: i) natural, and ii) forced failure. Conditional probability with soft computing theory is used to model occurrence probability. The proposed methodology also takes into account effectiveness of the management, and political parameters in an impeding attack.
In addition, the fault trees modeled are mapped into respective Bayesian Networks. Bayesian networks allow for manipulation of the conditional probability table. There are three relaxation assumptions that manipulate the conditional probability table
10
that is explored in this paper. In order to eliminate uncertainty developed in the data, an updating mechanism is used along with a predictive component to make the model dynamic. This is significant as the model can be become dynamic to reflect any changes that may have occurred.
Finally, a case study of a typical processing facility is presented to demonstrate the effectiveness of the model and to indicate areas of further improvement. This paper aspires to bring awareness to security risk assessments and the need to create a database for security related failures.
1.1 Introduction
Prior to the attacks of September 11, 2001, risk assessments completed for chemical facilities focused primarily on safety incidents or natural events. Through risk analysis, the facilities were able to plan for not only the high frequency-low consequence accidents but also the low frequency-high consequence events. In the years immediately following 9/11, both the American Chemistry Council (ACC) and the American
Petroleum Institute (API) released documents to aid chemical companies in conducting site security vulnerability assessments (SVAs) to help prevent attacks.
With current available security methodology, the need for continual improvement will always exist. In late February of 2006, the Abqaiq refinery in Saudi Arabia went under a terrorist attack from Islamic militants (BBC 2006). Vehicles with explosives attempted to gain access and cause damage to the world’s largest refinery. At the cost of two security guard fatalities, the refinery was able to foil the attack and prevent any disruption. Almost three years after this attack, Iraq’s largest oil refinery was shut down for several weeks due to a terrorist bombing (Al-Bazee 2011). Not only was the
11
production of 150,000 barrels per day halted but four workers lost their lives. The most recent incident was the attack on the In Amenas gas refinery on January 16, 2013 that lasted three days (Hagen 2013). In total, forty [40] workers were killed throughout the duration of the attack. The above examples verify that security failures led to financial loss, material loss and most importantly loss of human life. Therefore, the need to create a proper security risk assessment is crucial.
Existing security risk methodologies are qualitative and based on SVAs that include a threat and vulnerability analysis. There is a need to develop a quantitative model and respective data. Through this quantification, models will have the ability to become more accurate and thus expose the weak points in a security management system. With this knowledge the appropriate measures can be taken to further deter and/or
prevent attacks from happening.
The first methodology for modeling a safety incident was developed by Heinrich (1941). He proposed that accidents happen in chain of events or a sequence, and removal of any one element could therefore prevent the accident from occurring. Later, Reason (1990) developed the infamous “Swiss Cheese” model shown in Figure 1-1 below. This model proposed that each slice was a relevant barrier and each hole represented a weakness or a failure the system. An accident occurs when all of the holes align, otherwise it does not occur.
12
Figure 1 - 1: Swiss Cheese Model: Swiss Cheese Model (Adapted from Reason, 2000)
Further building upon this idea, was Kujath et al. (2010) who showed that each barrier could be described using fault tree analysis (FTA). Based in an offshore environment, the authors illustrated how basic event failures would lead to a barrier failure and thus an eventual accident. To provide a more holistic view, Rathnayaka et al. (2011) developed system hazard identification, prevention, and prediction (SHIPP) methodology based on the Kujath conceptual model. The conceptual accident model of SHIPP is shown Figure 1-2 and similar to Kujath, each barrier is built using FTA. Through the use of reliability data handbooks and expert judgment, the SHIPP method is able to assess and manage risk as well as represent the process accident sequence.
13
This current work is an extension of probabilistic risk assessment that previously focused on unintended or safety incidents. These events could be categorized as natural events, as they are expected to happen without the interference of human occupancy. Security incidents are characterized as intentional or unnatural events. The reason for this simply is that these incidents would not occur unless there is human interaction with the process. Security related accidents can stem from two main sources, internal or external. The American Petroleum Institute (API) recognizes three main threats to a chemical processing facility, which are (API 2003):
Internal External
Internal working with an external
Baybutt and Reddy (2003) indicate that an internal threat can come from either current or former employees or contractors. These threats frequently are intended to inflict economic damage through disruption of the process. An external threat however has a much more serious purpose with intentions to inflict casualties rather than economic damages. However, the most serious circumstance is the combination of an internal and external threat. With an inside knowledge of the facility, a terrorist group or criminal could extort a weakness and cause a major catastrophe.
Chemical sites are major targets for criminals and terrorists because of their hazardous materials and operating conditions. These sites are already at risk with natural events and the chance of an intentional act only increases the likelihood of incident to occur. Since the terrorist attacks on September 11, 2001, companies have begun to
14
include security in their overall site risk assessment. The security culture first began to change with new releases of security guidelines for the chemical industry. One such document, from the American Chemistry Council (ACC 2001) discussed risk assessment, prevention strategies, management issues and physical security for a chemical site. An additional document was released by the Center for Chemical Process Safety (CCPS 2003), which introduced the idea of rings of protection that are shown in Figure 1-3, along with appropriate security countermeasures.
Figure 1 - 3: Rings of Protection from CCPS (2003)
Later, Bajpai and Gupta (2005) completed a work intended to combine these guidelines and develop a security methodology for the chemical process industries. The first step is to complete a threat analysis (TA). The main purpose of this is to recognize or identify any threats that are plausible at a certain plant. Next, a vulnerability analysis (VA) is completed to pair a target asset with a threat to determine its vulnerability. Simultaneously, existing security measures are evaluated to determine their overall
15
effectiveness. Additionally, the vulnerabilities should be ranked based on attractiveness and consequence. At this stage, the authors add a security risk factor table (SRFT) to assess the current risk of a facility. With the security risks known, countermeasures can then be implemented to stop and/or neutralize an attack. The final step is the mitigation and emergency response. The purpose of this step is to finalize an emergency plan when an attack occurs and to ensure the proper authorities will assist in response to the attack. To exemplify this approach, the authors complete a case study of a typical plant and give security recommendations based on the results.
Bajpai and Gupta (2007) further use this and apply it to typical oil and gas infrastructure, a refinery. Through the qualitative analysis, the overall risk was able to be determined and thus appropriate recommendations and countermeasures were made which could further increase the security of the refinery. The proposed methodology and use of the security risk factor table (SRFT) could further be improved if the SRFT was completed at each of the various ‘zones’ to provide a more accurate holistic view of security. With each zone defined, it would be easier to see where improvements could be made.
In order to help the Department of Homeland Security (DHS) to develop a standard SVA, the American Society of Mechanical Engineers (ASME) in conjunction with AcuTech Consulting Group collaborated to develop Risk Analysis and Management for Critical Asset Protection (RAMCAP) (Moore et. al 2006). Moore et. al (2006) describe RAMCAP as a common method for conducting SVAs for owner and operators and in addition help to report vital information on risk to the DHS. The RAMCAP method is a qualitative approach because the US chemical industry did not have enough
16
experience with terrorist attacks to be able to use quantitative methodology to accurately predict an attack. The first step in the RAMCAP method was screening, which was to determine an asset list that would be of interest to the DHS. Its purpose is to determine if the RAMCAP SVA would need to be completed and submitted to the DHS.
The RAMCAP SVA approach consists of seven components of analysis. The first step is asset characterization, which helps to identify the notable assets of a chemical facility. The remaining analysis is only completed on the noted critical assets. Therefore, the next step, threat characterization is used to seek how an attack can be completed against the critical asset. Following this, a consequence analysis is conducted to determine the worst possible outcomes that could be produced from the threat characterization. A vulnerability analysis is then completed to establish the strengths and weaknesses of the asset. Then, there are two threat assessments completed one by the owner and one by the government. This is done to determine the attractiveness of an attack for that particular facility. The final two steps are risk assessment and risk management. Risk assessment will help to create strategies to protect the assets against an attack and risk management will ensure that risk is kept a standard level for a suitable cost.
In 2013, Moore (AcuTech Consulting) worked in conjunction with the American National Standards Institute (ANSI)/American Petroleum Institute (API) to release a Security Risk Assessment (SRA) Methodology (Standard 780) which would be used as a security standard for the petroleum industries (Moore, 2013). Moore (2013) states the purpose of the SRA is to estimate the chance of a threat against a chemical facility that would result in an unwanted consequence. This new ANSI/API Standard 780 is designed
17
to provide the petroleum industry with a holistic SRA. This methodology illustrates that the security risk is the likelihood of a successful act against a chemical facility while assuming both the likelihood of the act happening and the chance for success causing a set of consequences. In order to decrease this risk, there are five inter related steps. The first step is characterization of critical assets followed by the threat assessment to identify attackers and the attractiveness of an attack. Subsequently, a vulnerability assessment is carried out to estimate the likelihood of the various scenarios. The fourth step is the risk evaluation to determine any weaknesses of the critical assets. Finally, risk treatment is completed to establish security countermeasures. The goal of this methodology is to highlight areas of improvement for management and to better define an organizations risk tolerance and requirements.
The current work aims to apply the existing safety barrier method to the security aspect of a chemical facility. Using the probabilistic risk approach, this work intends to provide a holistic view of security risk analysis, which can be applied to all chemical industries. In discussing probabilistic risk assessment, Bayesian Network relaxation assumptions will also be explored. Following this, in Section 3, the security barrier model using fault and event trees will be discussed. In Section 4, data sources will be investigated as there is a current availability for failure events. A case study will be presented in Section 5 to outline the application of the proposed methodology. The final section will be devoted to the conclusions drawn in this paper.
1.2 Probabilistic Risk Assessment
Probabilistic Risk Assessments (PRA) have been widely used in recent years in a safety aspect to help plant managers make informed risk management decisions. One of
18
the highlights of this work is to transition a safety barrier approach method into a security barrier approach. As shown in the previous section, most work in security risk analysis is qualitative and lacks any quantitative methods. PRA is an organized approach to examine highly complex systems that exist in various industries. In its simplest terms, the PRA determines the risk value which is the product of consequence and probability. The main result of the PRA, as described by Modarres (2008) is finding out the system elements that contribute the greatest amount of risk to the system along with the usefulness of various risk reduction strategies. In this work, fault and event tree analysis is first utilized to develop a base case scenario. With the base case built, the fault trees are then subsequently mapped into Bayesian Networks (BN). Furthermore, various relaxation assumptions have been applied to the developed BNs in order to show which case best reflects reality. As uncertainties may arise through calculation, a Bayesian updating mechanism has been added to improve the accuracy of quantification along with a predictive component to further develop existing security strategies.
Fault tree analysis is the most widely used approach when determining the failure probability of barrier (or system). The system is defined by its top event while the tree is composed of other systems and events. These smaller sub systems and events are then combined with various Boolean logic gates that will cause the top event. Probabilities are then assigned to the basic events through historical data or expert judgment. Event tree analysis is used to show which sequence of events can lead to which consequences. Each barrier (system) is assumed to be independent with each branch representing a success or failure. The subsequent barrier is activated when the current barrier fails. The failure
19
probabilities of each barrier when used in an event tree give the occurrence probabilities of the various consequences.
Mapping fault trees into BNs is a simple process that is best described by Bobbi et al (1999). When considering a fault tree with simple AND/OR gates (such as the fault trees proposed), the basic component of the fault tree (leaf node) now represents a root node in a BN. Subsequently, each gate of a fault becomes a BN node and should be labeled appropriately. Similar to that of a fault tree, the connections between a node and its gate will remain the same. These connections are described as arcs between nodes. The arc originates at the ‘parent’ node and ends at the ‘child’ node. This process is illustrated in Figure 1-4 below.
Figure 1 - 4: Mapping Flowchart (Khakzad et al. 2012)
However, a major difference is for each gate turned into a node, the conditional probability table (CPT) must match the logic of the gate (i.e. OR gate). This is an
20
important factor as now the CPT can be manipulated based on various relaxation assumptions. With the CPT logic defined, the BN node probability can be calculated through the following Eq. 1-1 (Díez and Druzdzel 2007) :
𝑃[𝑋1, 𝑋2, … 𝑋𝑛] = ∏𝑛𝑖=1𝑃[𝑋𝑖|𝑃𝑎𝑟𝑒𝑛𝑡(𝑋𝑖)] (1-1)
An example of this mapping technique is shown in a later section of this paper.
As stated above, a key aspect of utilizing a BN over a fault and event tree analysis is the ability to manipulate the CPT. This paper outlines three techniques that can be applied to CPT. These techniques are called Leaky-OR, Noisy-OR, and Noisy-AND are covered in great detail by Díez and Druzdzel (2007) but will be briefly outlined here. The first relaxation assumption discussed is the Noisy-OR, where the term ‘noisy’ references the chance that the event may not occur because it was inhibited by an external independent factor. Simply, a parent node can occur /be present but the child node was not produced due to an inhibitor preventing it. This probability, denoted as ci, is the
probability that the parent produces the child while qi is the probability that the inhibitor
is active. This relationship is shown in Eq. 1-2,
𝑐𝑖 = 1 − 𝑞𝑖 (1-2)
When there are multiple parents to a child node, the child probability can then be calculated through the following Eq. 1-3:
𝑃(𝑍|𝑋1, 𝑋2, … 𝑋𝑛) = ∏𝑖∈𝑥(1 − 𝑐𝑖) = ∏𝑖∈𝑥𝑞𝑖 (3-1)
In the case of a Leaky-OR, a new variable is introduced to account parameters not in the model. As it is nearly impossible to include all causes of a certain effect, the leaky parameter (cL) can account for it. The Noisy-OR is actually a particular case of the
21
Leaky-OR where its leaky parameter is equal to zero. Thus the equation to calculate the probability of the leak parameter is shown below in Eq. 1-4:
𝑃(𝑍|𝑋1, 𝑋2, … 𝑋𝑛) = (1 − 𝑐𝐿) × ∏𝑖∈𝑥(1 − 𝑐𝑖) (1-4)
The last relaxation assumption that will be explored is the Noisy-AND. As Díez and Druzdzel explain, each condition of a child node can be either inhibited or substituted. Similar to Boolean logic, all parent nodes are required in order for the child node to be true. Noisy-AND introduces a new probability, si, which accounts for the parent node
when it is not present. Hence, a parent node in a Noisy-AND model can either contribute an inhibitor or substituted factor based off whether it is present or not. The appropriate Eq. 1-5 for this model is shown below:
𝑃(𝑍|𝑋1, 𝑋2, … 𝑋𝑛) = ∏𝑖∈𝑥𝑐𝑖 × ∏𝑖∈𝑥𝑠𝑖 (1-5)
Based on prior and precursor data, an important feature of the proposed model is the ability to predict the number of abnormal security events. This prediction will be both qualitative and quantitative in order to best provide information to help improve a chemical plant’s security strategies. The predictive model will follow a similar approach used in Rathnayaka et al. (2011) to help determine the number of events in the next time interval.
Hamada et al. (2008) proposed a general predictive Eq. 1-6 for discrete random variable z, based on observed data where the unknown parameter is symbolized by θ, the posterior distribution by p(θ/π), and the sampling distribution by p(z/θ) where π is the data in the posterior distribution.
22
𝑝(𝑧 𝜋) = ∑⁄ 𝑎𝑙𝑙 𝜃𝑝(𝑧 𝜃⁄ )𝑝(𝜃 𝜋)⁄ (1-6)
Eq. 6 is now reestablished into Eq. 1-7 to determine the number of abnormal events where the posterior distribution now becomes p(λ/data) and the sampling distribution is
p(yt+1/λ). The average number of abnormal events is now represented by the variable λ.
𝑝 (𝑦𝑡+1 𝑑𝑎𝑡𝑎) = ∑ 𝑝 ( 𝑦𝑡+1 𝜆 ) 𝑝 ( 𝜆 𝑑𝑎𝑡𝑎) 𝑎𝑙𝑙 𝜃 (1-7)
Rathnayaka (2011) points out that in the above equation, data is equal to the number of observed abnormal events during the time interval t, and the gamma distribution is the most widely used prior distribution for λ. Eq. 1-8 below represents the gamma distribution probability density with the parameters α and β.
𝑝 ( 𝜆
𝛼,𝛽) = 𝛽𝛼
𝛤𝛼𝜆
𝛼−1𝑒−𝛽𝜆 (1-8)
The number of abnormal events is to be considered a discrete and independent variable which follows a Poisson distribution with rate λ. In this assumption, the likelihood distribution for data (y1, … yn) is illustrated in Eq. 1-9:
𝑝 (𝑑𝑎𝑡𝑎
𝜆 ) =
𝜆∑𝑛𝑖=0𝑦𝑛𝑒−𝑛𝜆
∏(𝑦𝑛!) (1-9)
Through the conjugate property, the posterior distribution will also follow the gamma distribution except its parameters 𝛼𝑝 = 𝛼 + ∑𝑛𝑖=0𝑦𝑛 and 𝛽𝑝= 𝛼 + 𝑛. The total number of abnormal events is the summation of all the events over all of the time intervals. In Eq. 1-10, an updated value of λ can be found from the mean value of the posterior distribution.
𝜆𝑝 = 𝐸 ( 𝜆
𝑑𝑎𝑡𝑎) =
𝛼+∑𝑛𝑖=0𝑦𝑛
23
In summary, Eq. 1-11 can determine the predictive probability distribution of occurrence for an abnormal event in the next time interval based on data through an approximated Poisson process.
𝑝 (𝑦𝑡+1 𝑑𝑎𝑡𝑎) =
𝜆𝑝𝑦𝑡+1𝑒𝜆𝑝
𝑦𝑡+1! (1-11)
Through quantification of the fault and event tree analysis, there is room for uncertainty to grow or for the accuracy of the consequence probabilities to decrease. This can arise by using point value form probabilities in addition to the error that may arise by using expert judgment or in literature. Therefore, a Bayesian updating mechanism is utilized to reduce the uncertainty that can occur. Bayes’ theorem allows for initial beliefs to be updated through the use of likelihood probabilities from newly observed data. Similar to the predictive modeling approach, this probability updating method will very closely follow Rathnayaka et al (2011). This updated probability can be calculated by Eq. 1-12 where the denominator represents a normalizing factor:
𝑝 ( 𝑥𝑖
𝑑𝑎𝑡𝑎) =
𝑝(𝑑𝑎𝑡𝑎 𝑥⁄ 𝑖)𝑝(𝑥𝑖)
∑ 𝑝(𝑑𝑎𝑡𝑎 𝑥⁄ 𝑖)𝑝(𝑥𝑖) (1-12)
The prior probability is defined by p(xi) calculated through fault tree analysis and the
likelihood is represented by p(data/xi) is calculated from abnormal event data. The first
step in the likelihood calculation is to determine the number of abnormal events for each month and the relative success and failures of each barrier. In Eq. 1-13, NF,i and NS,i
represent the number of failures and success at each barrier, respectively.
𝑝 (𝑑𝑎𝑡𝑎
𝑥𝑖 ) =
𝑁𝐹,𝑖
24
With the likelihood probabilities estimated and prior probabilities known, each can be placed into Eq. 12 to determine the new posterior probability. Finally, Eq. 1-14 can be used in event tree analysis to update the occurrence probabilities of the accident denoted by p(ck/data). 𝑝 ( 𝑐𝑘 𝑑𝑎𝑡𝑎) = ∏ ( 𝑥𝑖 𝑑𝑎𝑡𝑎) 𝜃𝑖,𝑘 (1 − ( 𝑥𝑖 𝑑𝑎𝑡𝑎)) 1−𝜃𝑖,𝑘 𝑖=𝑆𝐵𝑘 𝑘 = 1, 2, 3, 4, 5 (1-14) 1.3 Model Presentation
Previous security methods have been based on qualitative analysis. An attack is the result of an intentional act to cause harm. In its worst-case form (act of terrorism) it can cause consequential damage to not only human life but economic and environmental as well. The problem with attempting to model an attack is that it can happen in any number of ways and therefore the best countermeasure is to define security measures that can prevent them. Security measures can range in difficulty and thus the more sophisticated security system in place, the less likely an intentional failure can be accomplished. There are however two elements that can influence the attack process at any time, the Management and Organization barrier and the Political barrier. The relationship of all the barriers is shown in Figure 1-5.
25
The cause-consequence relationship is represented with fault and event tree analysis. In fault tree analysis (FTA), the top event signifies a failure for the entire barrier. Each top event will fail when the associated sub element barriers fail. The first four barriers (external, internal, interior, and critical) all have similar sub elements. Reniers (2010) proposed that physical security measures should be based on structural, electronic, a personnel barrier (or security checkpoint in case of external), which is implemented in this model. Even though the plant has been separated into barriers or zones, each measure is likely to overlap with another barrier. This however is not considered in this model. It is assumed that each barrier is a stand-alone entity and does not interact with each other.
The function of the external security barrier is to provide the first line of defense against an attack. Structural countermeasures for a chemical plant can be a perimeter fence, entrance/exit gates, bollards, and trenches. The electronic barrier is divided into power and intrusion detection devices because if the power is lost to the plant then the electronic barrier has failed. The intrusion devices are line of sight sensors, video motion and lighting. The final sub element of the external barrier is the personnel barrier. This barrier acts a security checkpoint in order to gain entrance into the chemical facility. At a security checkpoint there is a bag check, personal inspection (may be completed through image technology), vehicle inspection, and appropriate documentation for employees or contractors. The proposed fault tree for this barrier is shown below in Figure 1-6. Subsequent failure of this fault will allow access on the chemical facility’s grounds.
The purpose of the internal security barrier is to prevent an adversary from gaining access to structural buildings that are on the chemical plant property. The
26
structural barrier is broken down into road conditions, manual locked doors and manual locked windows. Road conditions is a security measure that can often be overlooked. For instance, a well paved and maintained road will make moving around a chemical plant much easier for an attacker. Similar to the external barrier, the internal security electronic barrier is divided into power and intrusion devices. However, it adds a badge swipe component which will have the ability to electronically unlock doors. The personnel barrier includes both a reception area that can be a check-in desk past the security checkpoint and a mobile security unit. This unit would be tasked with making routine rounds throughout the plant. The fault tree for this security barrier is shown in Figure 1-7.
External Barrier Structural Barrier Electronic Barrier Personnel Barrier Perimeter Fence Entrance/ Exit Gates
Bollards Trenches Power
Line of Sight Sensor Video Motion Sensor Bag Check Patdown Vehicle Inspection Document-ation Intrusion Device Lighting
27
Figure 1 - 7: Proposed Internal Security Barrier Fault Tree
Following is the interior security barrier, which would deter unauthorized personnel from gaining access to employee workstations and offices. For the interior structural barrier, limiting the access points and having manual locked doors can deter an attacker. In addition, the electronic barrier includes biometric access and boundary penetration devices. These devices would detect when someone has gained unauthorized entry. However, the effectiveness of the personnel barrier is a function of the vigilance of the employees of the facility. Employees must be aware when unauthorized personnel are on site and should take notice of visitors. The interior security fault tree is shown in Figure 1-8. Internal Barrier Structural Barrier Electronic Barrier Personnel Barrier Road Conditions Manual Locked Doors Manual Locked Windows
Power Intrusion Device
Video Motion Sensor Line of Sight Sensor Lighting Badge Swipe Reception Mobile Security
28
Figure 1 - 8: Proposed Interior Security Barrier Fault Tree
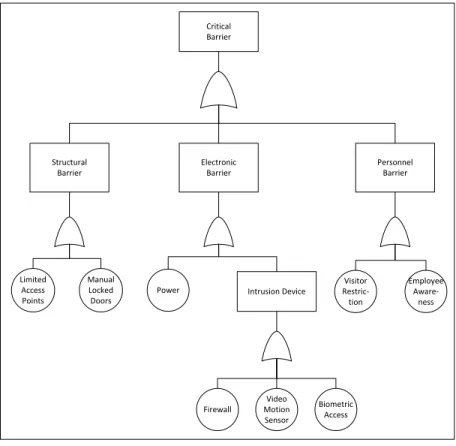
The critical security barrier is to prevent unwanted individuals from accessing the chemical plants control room. Similar to the interior barrier, the structural barrier consists of limited access points and manual locked doors. But in the electronic barrier, a firewall element has been added. The firewall is to prohibit unauthorized users from gaining proprietary information or manipulation of the process controls. Additionally, the personnel barrier should restrict visitor access to this security point. A proposed fault tree for this barrier is displayed in Figure 1-9.
Interior Barrier Structural Barrier Electronic Barrier Personnel Barrier Limited Access Points Card Readers Biometric Access Manual Locked Doors Boundary Penetra-tion Point Sensors Visitor Escort Employee Aware-ness
29
Figure 1 - 9: Proposed Critical Security Barrier Fault Tree
The last security barrier and last line of defense is the fail-safe security barrier. This barrier is separated into two categories of fail-safe mechanisms, manual and electronic. These mechanisms can come from an alarm or a shutdown. The alarm has the ability to warn employees of the unsafe conditions that the processing plant is incurring. Meanwhile the shutdown will end operations in order to revert back safe working conditions. The fault tree for this security barrier is represented in Figure 1-10.
Critical Barrier Structural Barrier Electronic Barrier Personnel Barrier Limited Access Points Manual Locked Doors
Power Intrusion Device
Visitor Restric-tion Employee Aware-ness Firewall Video Motion Sensor Biometric Access
30
Figure 1 - 10: Proposed Fail-Safe Security Barrier Fault Tree
In regards to the above stated security barriers, each barrier’s effectiveness will depend on the devices and security measures that are utilized. However, making economic and cost efficient selection for devices is imperative. For instance, it would be ideal to have biometric access at each door in order to ensure maximum security but the cost to supply this for an entire chemical facility is not feasible. Therefore, management should take the appropriate and practical actions to guarantee each security barrier is well equipped.
The management and organization barrier has the ability for its sub elements to intervene at any stage during an attack. This barrier is difficult to portray as each industry and individual companies will have various standards and protocols. Nevertheless, important factors were determined and a fault tree was designed as shown in Figure 1-11.
Fail-Safe Barrier
Manual Electronic
Alarm
31
Figure 1 - 11: Proposed Management and Organization Security Barrier Fault Tree
The most important barrier in the model is the political barrier. This barrier takes into account the on-going situations around the chemical facility itself. Three main sub-barriers have been developed which are laws and enforcement, crime, and terrorism. The crime sub element is separated into hostage situations, stealing, and armed attack instances. There are five types of terrorism that would consider using a chemical plant as a target. Grothaus (2014) describes these types of terrorism as follows:
State – government use of terror to regulate its population
Religious – individual or groups use ideologies to justify use of terror Pathological – individual or groups that use terror for personal enjoyment
Issue-Orientated – individual or groups inflict terror to bring awareness to a certain problem Management & Organization Barrier Organization Barrier Management Barrier Inadequate Security Program Inadequate Communi-cation Inadequate Staff & Resources Inefficient Manage-ment Practice Inadequate Planning Inadequate Security Practice Poor Communi-cation
32
Separatist – a group that wishes to get rid of the current government and create a new state.
The laws and enforcement barrier is relative to the country or region as it looks at the measures in place to protect both the workers and the operation of the chemical facility. This fault tree is shown in Figure 1-12.
Figure 1 - 12: Proposed Political Security Barrier Fault Tree
In order to determine the consequences of the possible outcomes for an attack on a chemical plant, event tree analysis is applied in conjunction with an event network. The event tree is shown in Figure 1-13.
Political Barrier
Terrorism Crime EnforcementLaws &
Separtist Religious Orientated
Issue-State Pathological Hostage Stealing AttacksArmed Laws Enforcement
Protecting Workers Protecting Operations Protecting Workers Protecting Operations
33
Figure 1 - 13: Attack Sequence Event Tree
Currently available literature does not provide definitions for security analysis consequences. Therefore, descriptions have been developed to accurately depict these security related events.
A ‘near miss’ is described as an event that has potential to cause damage or loss but does not result in any harm. An illustration of this would be a chemical facility receiving a threat of intent to inflict harm and they notify the proper authorities to prevent the action from being executed.
External Barrier Internal Barrier Interior Barrier Critical Barrier Fail-Safe Barrier M & O Barrier Political Barrier Political Barrier M & O Barrier Political Barrier Political Barrier M & O Barrier Political Barrier Political Barrier M & O Barrier Political Barrier Political Barrier M & O Barrier Political Barrier Political Barrier Safe Incident Near Miss Incident Near Miss Light Attack Incident Light Attack Incident Considerable Attack Light Attack Considerable Attack Light Attack Severe Attack Considerable Attack Severe Attack Considerable Attack Devastating Attack Severe Attack Devastating Attack Devastating Attack Fail Fail Fail Fail Fail Safe Safe Safe Safe Safe
34
An ‘incident’ can be defined as an event that can cause minor damage to chemical facility and loss of production is negligible. For example, an intrusion device alerts security personnel that unauthorized individuals have cut the chain link fence and are currently trespassing on the grounds of the plant.
A ‘light attack’ is an event that could cause major damage to a chemical facility with minor loss in production and some harm against employees. One scenario for this case is if an individual breaks onto the processing plant grounds causes a leak in a storage tank and breaks a door down in attempt to gain access to sensitive information.
An event where a ‘considerable attack’ occurs would inflict injury to workers, cause greater financial damage and potential loss in production. In addition, this type of attack would draw local news coverage.
A ‘severe attack’ can be described as an event that may have one or more employee fatalities, major damage done to the environment and create national news. In addition there would be excessive financial losses and production would be stopped.
A ‘devastating attack’ is an event or series of events that would cause multiple fatalities, reach international news, and there would be catastrophic financial losses. Furthermore, the facility may be closed down for a lengthy period of time. An example of this is the recent attack on In Amenas gas refinery.
With the model herein outlined, the next step is to map the above fault trees into Bayesian networks. Shown in Figure 1-14, is an example of one of the barriers (external).
35
Figure 1 - 14: External Barrier Mapped in a Bayesian Network
The importance of this mapping is to verify the fault tree calculation by matching the conditional probability table (CPT) with the logic of the fault tree. In addition, using a BN allows for manipulation of the CPT to reflect various relaxation assumptions which will be shown in the case study. The next section will look into developing probability data that can be utilized for this proposed model.
1.4 Data Sources
When developing a risk model, uncertainties are created when assumptions are made. However, by comparing results of different models with different assumptions the critical components of failure can be recognized. This recognition is more useful than employing data sources as it displays an understanding of the risk model and its key components. Although only one case study is completed in this paper, the model is devised in such a way that it can be applied to multiple scenarios to develop a deeper understanding. The initial probabilities were developed through expert judgment, as there
Perimeter Fence
Entrance/
Exit Gates Bollards Trenches Structural Barrier Power Intrusion Device Line of Sight Sensor Lighting Video Motion Sensor Electronic Barrier Bag Check Patdown Vehicle Inspection Document-ation Personnel Barrier External Barrier
36
is currently a lack of data found in both industry and literature. To minimize the uncertainty that comes with expert judgment assigning probabilities, a soft computing theory has been utilized to help develop such probabilities.
In order to determine the failure probabilities of each basic event it must first be separated into two categories. The reason for this is shown in Figure 1-15. An event can come to failure through either a natural failure (i.e. component failure) or an unnatural (forced) failure. If natural failure data is available for the event described, such as biometric access, then it is sorted into category 2. Otherwise, it is given category 1 in which a probability is directly assigned based on expert judgment, as it cannot have a natural failure.
Figure 1 - 15: Basic Event Failure Pathways
Currently, forced failure data is unavailable and thus the unnatural failure must be calculated through Bayes Theorem shown in Eq. 1-15:
𝑃(𝐸|𝑇) =𝑃(𝑇|𝐸)×𝑃(𝐸)
𝑃(𝑇) (1-15)
Where P(E) denotes the probability of an event due to intended and unintended causes,
P(T) is the probability of a threat, and P(T|E) is assuming the failure of the event E, what is the probability it came from a threat. As this is difficult to calculate, soft computing theory is utilized. Each event likelihood is given a specific term, which has an associated
Operating State Failed State Natural Failure Forced Failure