Ramanathan, Usha (2010) Analysing the role of
information exchange for demand forecasting in
collaborative supply chains. PhD thesis, University of
Nottingham.
Access from the University of Nottingham repository:
http://eprints.nottingham.ac.uk/11538/1/Final_thesis-hardbound-31Aug2010_-_Usha.pdf
Copyright and reuse:
The Nottingham ePrints service makes this work by researchers of the University of Nottingham available open access under the following conditions.
· Copyright and all moral rights to the version of the paper presented here belong to
the individual author(s) and/or other copyright owners.
· To the extent reasonable and practicable the material made available in Nottingham
ePrints has been checked for eligibility before being made available.
· Copies of full items can be used for personal research or study, educational, or
not-for-profit purposes without prior permission or charge provided that the authors, title and full bibliographic details are credited, a hyperlink and/or URL is given for the original metadata page and the content is not changed in any way.
· Quotations or similar reproductions must be sufficiently acknowledged.
Please see our full end user licence at:
http://eprints.nottingham.ac.uk/end_user_agreement.pdf
A note on versions:
The version presented here may differ from the published version or from the version of record. If you wish to cite this item you are advised to consult the publisher’s version. Please see the repository url above for details on accessing the published version and note that access may require a subscription.
Nottingham University Business School
Analysing the role of information
exchange for demand forecasting in
collaborative supply chains
by
Usha Ramanathan,
MSc., BEd.,
MBA
Thesis submitted to Nottingham University Business School for
the degree of
DOCTOR OF PHILOSOPHY
Abstract
It is now widely recognized that supply chains, not individual organisations, are
responsible for the success or failure of businesses. This has necessitated close
coordination among supply chain partners. In the past few decades, in an attempt to
improve the overall efficiency of the supply chain, many companies have engaged in
collaboration with other supply chain members. Consequently, several supply chain
management initiatives such as Vendor Managed Inventory, Efficient Consumer
Response, Continuous Replenishment and Accurate Response have been proposed in
the literature to improve the flow of materials as well as information among supply
chain partners. In this line, Collaborative Planning Forecasting and Replenishment
(CPFR) is a relatively new initiative that combines the intelligence of multiple trading
partners in planning and fulfilment of customer demand by linking sales and marketing
best practices. The role of CPFR has been widely studied in the US retail industry, but it
has not been researched much in the UK and also in Asian countries. Hence, this
research focuses on the adoption of CPFR in the UK and India.
Levels of collaboration and information sharing differ to a great extent across the supply
chains based on the needs of individual businesses. Accordingly, the importance of
CPFR varies in different supply chains. The study reported in this research explores the
operations of CPFR and highlights the corresponding benefits in different firms using
case studies of Indian (4 cases) and British (2 cases) companies operating in
Make-To-Stock (MTS) and Make-To-Order (MTO) environments. In this research, information
exchange among collaborating partners is analysed with a focus on its role in demand
forecasting and timely replenishment.
In order to identify potential benefits of CPFR, this research has adopted a four stage
3 companies helped to develop a clear understanding of the collaborative arrangements in
each company. In stage two, a conceptual model called the Reference Demand Model
(RDM) was developed. RDM is a specific model representing the dependency of
demand projection on information from different supply chain members involved in
supply chain processes. When fully developed, the RDM will serve as a decision tool
for the companies involved in collaboration to decide on the level of collaboration and
the type of information exchange in order to improve supply chain planning and
forecasting.
Further, to explore how demand information collected through RDM can help improve
forecasts accuracy, a quantitative approach is employed in the next two stages.
Therefore, stages 3 and 4 were studied only for the cases with detailed sales data. In
stage 3, structural equation models were developed to establish the underlying
relationships among demand factors that were identified using RDM. In stage 4,
regression forecast models of sales were developed using the demand factors identified
through RDM. The forecast models showed an improved accuracy and thus this
research suggested the case company (Soft Drink Co.) to use the demand information
(identified from RDM) in the demand forecasts.
The results strongly support CPFR in a MTS environment with promotional sales, and
exchanging the detailed sales information from downstream to upstream supply chain
members may improve the accuracy of demand forecasts. Information exchange is also
required to ensure timely replenishment for MTS products. However, in a MTO
environment, there is less need for collaboration with downstream supply chain partners
Publications based on this research
Journal article
Usha Ramanathan and Luc Muyldermans, 2010, ‗Identifying demand factors for promotional planning and forecasting: A case of a Soft Drink Company in the UK‘, International Journal of Production Economics. doi:10.1016/j.ijpe.2010.07.007
Conference presentations
Ramanathan, U.; Muyldermans, L.; MacCarthy, B., 2009, "Improving forecasting
accuracy of sales promotions through Reference Demand Model and Multiple Linear
Regression analysis", in POMS 2009, 20th Annual Conference of the Production and
Operations Management Society, Orlando, Florida, May.
Ramanathan, U.; Muyldermans, L.; MacCarthy, B., 2008, "Forecasting Promotional
Sales Using Linear Regression Models", in INFORMS Annual Meeting, Washington
DC, 12-15 October.
Ramanathan, U.; Muyldermans, L., 2007, "Supply Chain Collaboration: A Review and
Scope for Future Research", in the proceedings of the Logistics Research Network
5
Acknowledgements
First of all, I would like to thank my PhD advisor Dr Luc Muyldermans for his support
and guidance. He played a key role in introducing the topic of supply chain
collaboration to me. I would also like to thank Prof Bart MacCarthy, Prof Kul Pawar,
Dr Jane Guinery for their valuable comments during progress of my research.
Second, I would like to thank all the case study companies involved in this research.
Many individuals in the case study companies facilitated the research. In particular
Rachel, James and Sarah from the Soft Drink Company, Srinivasan and Ramesh from
the Packaging Company, Vishnu Priya from the Textile Company, and other
anonymous helpers from the Electrical Equipment Company and the Crude Oil
Company .
Third, I am grateful to all my colleagues in the PhD room who have always been with
me throughout my period of study. I also express my sincere thanks to Ms Andrea
Tomlinson, administrator of the PhD programme and also to Ms Alison Parrett,
secretary of the Operations Management Division.
Fourth, I record my sincere gratitude to my husband Ram and my children Bharat and
Nila for their endless support and love during my long PhD journey.
Finally, I would like to thank the University of Nottingham for awarding me a ‗Special scholarship‘ to fund a part of my tuition fees.
I dedicate this research to my parents, especially to my father, Sankaralingam, who was
always interested in my higher education. I am sure my research will earn my mother,
Table of Contents
Abstract ... 2
Publications based on this research ... 4
Acknowledgements ... 5
Chapter 1 Introduction ... 12
1.1 Background of supply chain management ... 13
1.2 What is supply chain collaboration? ... 14
1.3 Purposes and strategies of supply chain collaboration ... 16
1.4 Research focus ... 18
1.5 Research approach ... 19
1.6 Structure of the thesis ... 20
Chapter 2 Literature Review ... 22
2.1 Introduction ... 22
2.2 Supply chain collaboration ... 22
2.2.1 A brief history of the evolution of SCM practices ... 24
2.2.2 CPFR framework ... 27
2.3 Impacts of supply chain collaboration: Models and case studies ... 32
2.4 Establishing supply chain collaboration... 39
2.4.1 Levels of collaboration ... 40
2.4.2 The role of information exchange ... 41
2.5 Forecasting promotional sales ... 46
2.6 Gaps in the literature ... 50
2.7 Summary ... 52
Chapter 3 Research questions and Research Methodology ... 53
3.1 Introduction ... 53
3.2 Main Research Question ... 53
3.3 Research design ... 57
3.4 Research Methods ... 58
3.5 Case study ... 60
3.6 Conceptual model development ... 62
3.7 Structural equation models (SEM) ... 63
3.8 Multiple linear regression models ... 65
3.9 Summary ... 66
Chapter 4 Case studies - UK ... 67
4.1 Introduction ... 67
4.2 RDM for Study 1 - Soft Drink Manufacturing Company (Soft Drink Co.) ... 67
4.2.1 Company profile ... 67
4.2.2 Product portfolio and promotion mechanisms ... 68
4.2.3 Planning cycle at Soft Drink Co ... 71
4.2.4 Supply chain collaboration at Soft Drink Co. ... 73
4.2.5 The current forecasting method employed by Soft Drink Co. ... 74
4.2.6 Some complexities ... 75
4.3 Study -2 Wholesale customer of Soft Drink Co... 76
4.3.1 Company profile ... 76
4.3.2 Relationship between Soft Drink Co. and Wholesale Co. ... 77
4.3.3 Relationship of Wholesale Co. with their customers ... 79
7
4.3.5 Potential improvements in forecasting and inventory management ... 82
4.3.6 Enhancing Wholesale Co. – Soft Drink Co. collaborative arrangement .. 86
Chapter 5 Case studies – India ... 88
5.1 Introduction ... 88
5.2 Study 3 –Textile manufacturing company ... 88
5.2.1 Company profile ... 88
5.2.2 Business strategy of Textile Co. ... 89
5.2.3 Capabilities ... 91
5.2.4 Supply chain collaboration at Textile Co. ... 96
5.2.5 Planning cycle at Textile Co. ... 98
5.2.6 Value of information in planning and forecasting at Textile Co. ... 102
5.2.7 Purpose of collaborative forecasting in Textile Co. ... 105
5.2.8 Some complexities ... 107
5.3 Study 4 – Crude-oil refiners and distributors ... 108
5.3.1 Company Profile ... 108
5.3.2 Collaborative arrangement ... 110
5.4 Summary ... 112
Chapter 6 Conceptual model development ... 114
6.1 Introduction ... 114
6.2 Development of Reference Demand Model (RDM) ... 114
6.2.1 Purpose of RDM ... 115
6.2.2 Role of information exchange in developing RDM ... 115
6.2.3 Step1 of RDM - Information on demand factors ... 117
6.2.4 Step 2 of RDM - Attributes of the information ... 120
6.2.5 Step 3 of RDM - Evaluation and interpretation of information ... 127
6.3 RDM for Textile Co. ... 130
6.3.1 Analysis of RDM –Textile Co. ... 133
6.4 What is RDM for collaborating companies? ... 135
6.5 Summary ... 136
Chapter 7 Cross Case analysis - Qualitative study ... 137
7.1 Introduction ... 137
7.2 Role of the case companies in the supply chain ... 137
7.3 Cross-case comparison ... 139
7.4 Role of RDM in case companies ... 144
7.5 Supply chain collaboration in the case companies ... 147
7.5.1 Current practice and suggestions ... 147
7.5.2 New perspective of SC collaboration ... 148
7.6 Summary ... 150
Chapter 8 Data Description ... 151
8.1 Introduction ... 151
8.2 Data collection methodology ... 151
8.3 Scales used to represent quantitative data ... 157
8.4 Descriptive analysis of sample data ... 163
8.5 Summary ... 165
Chapter 9 Structural equation modelling ... 166
9.1 Introduction ... 166
9.2 Conceptual demand-factor model and hypotheses development ... 167
9.2.1 The influence of promotional strategies on sales volume ... 168
9.2.2 Influence of non-promotional demand factors on sales ... 169
9.3 Data ... 173
9.5 Stage 2: Model construction and testing ... 180
9.6 Structural equation model for 2ltr pet bottles ... 185
9.7 Analysis of the model for 2ltr pet bottles ... 185
9.8 Structural equation model for 6packs-330ml cans ... 187
9.9 Structural equation model for 500ml pet bottles ... 190
9.10 Discussion ... 193
9.11 Summary ... 194
Chapter 10 Multiple Linear Regression Forecast Models ... 195
10.1 Introduction ... 195
10.2 Promotional sales factors ... 195
10.2.1 Rules for developing MLRM ... 196
10.3 Development of Multiple Linear Regression Models ... 198
10.4 The MLRM for Retailer R1 ... 199
10.5 MLRMs explained ... 206
10.6 Advantage of using Multiple Linear Regression Models ... 209
10.7 MLRM for Retailer R2 ... 212
10.8 Forecasting sales uplift ... 218
10.9 Discussion of MLRMs ... 222
10.10 Summary ... 227
Chapter 11 Discussions and conclusions ... 228
11.1 Introduction ... 228
11.2 Discussions of case studies and conceptual model ... 228
11.2.1 Discussion of Quantitative Models ... 229
11.3 Contribution to knowledge ... 231
11.4 Scope for future research ... 233
References ... 236
Appendix-I Case study-5 ... 250
Appendix-II Case study-6 ... 262
9
Table of figures
Figure 1-1 Traditional versus Modern supply chain ... 14
Figure 1-2 Supply chain strategies ... 17
Figure 1-3 Position of the case companies in the supply chain ... 19
Figure 2-1 CPFR Process Model ... 29
Figure 2-2 Sales forecast and dispatch forecast ... 30
Figure 2-3 Different levels of collaboration ... 40
Figure 3-1 Research plan ... 59
Figure 3-2 An example of a measurement model ... 64
Figure 4-1 Effect of promotions on sales ... 71
Figure 4-2 Planning cycle at Soft Drink Co. ... 72
Figure 4-3 Various levels of relationships in Soft Drink Co. ... 78
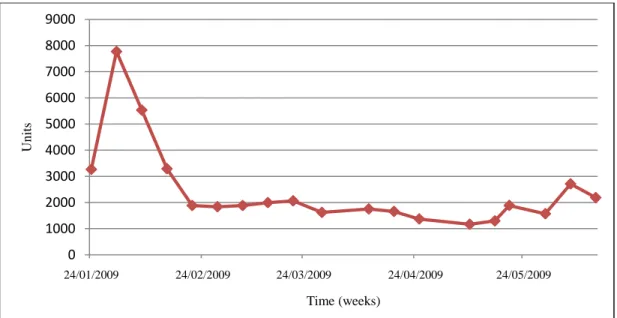
Figure 4-4 End customer demand and orders of Wholesale Co. ... 81
Figure 4-5 Inventory level at Wholesale Co. ... 82
Figure 4-6 Demand forecast of Soft drinks at Wholesale Co. ... 83
Figure 4-7 (R, Q) model ... 85
Figure 4-8 Evolution of inventory at Medway warehouse ... 87
Figure 5-1 Business strategies of Textile Co. ... 90
Figure 5-2 Importance of forecasting in Textile Co. ... 95
Figure 5-3 Current supply chain collaboration of Textile Co. ... 98
Figure 5-4 Sales at Textile Co ... 100
Figure 5-5 Planning cycle at Textile Co. ... 101
Figure 5-6 Information exchange in Textile Co supply chain ... 105
Figure 5-7 Forecasting at Textile Co. ... 106
Figure 5-8 Application of supply chain information and forecasts ... 107
Figure 5-9 Products of Crude-Oil Co. ... 109
Figure 5-10 Supply chain of Crude-oil Co.– Information flow and material flow ... 112
Figure 7-1 Main role of case companies studied ... 138
Figure 8-1 Percentage of types of promotions offered by four retailers ... 155
Figure 8-2 Example of average sales during promotions at R2 for 2ltr bottles ... 156
Figure 8-3 Example of average sales during promotions at R4 for 2ltr ... 158
Figure 9-1 Conceptual demand-factor model ... 167
Figure 9-2 Measurement model ... 183
Figure 9-3 Model - 1 ... 183
Figure 9-4 Model - 2 ... 184
Figure 9-5 Complete structural equation model of demand -2ltr pet bottles ... 184
Figure 9-6 Structural model of 330ml cans ... 189
Figure 9-7 Structural equation model of 500ml pet bottles ... 192
Figure 10-1 Example 1- Regression and forecast (Orange drink 500ml) ... 201
Figure 10-2 Example 2 - Regression and forecast (6-pack of 330ml cans) ... 202
Figure 10-3 Extent of explanation of linear models ... 206
Table of tables
Table 2-1 Purpose of supply chain relationships ... 23
Table 2-2 Some existing models in collaborative supply chain from the literature ... 35
Table 2-3 Literature overview of some case studies and reviews on CPFR ... 37
Table 2-4 Literature on information sharing ... 44
Table 2-5 Some models on promotional forecasting ... 48
Table 2-6 Gaps in the literature ... 51
Table 3-1 Research study plan ... 57
Table 3-2 Research approach ... 60
Table 3-3 Details of case company interviews ... 61
Table 4-1 Components of promotional calendar ... 69
Table 4-2 MAPE of seasonal forecasting at Wholesale Co. ... 84
Table 4-3 Inventory at Medway warehouse ... 86
Table 6-1 Step1 of RDM - List of information on demand factors ... 119
Table 6-2 Step 2 of RDM - Attributes of information ... 124
Table 6-3 RDM of Soft Drink Co ... 126
Table 6-4 Analysis of RDM of Soft Drink Co ... 129
Table 6-5 RDM of Textile Co. ... 132
Table 6-6 Analysis of RDM of Textile Co. ... 134
Table 7-1 Basic designs for case studies ... 138
Table 7-2 Case study details ... 141
Table 7-3 Suggested techniques ... 146
Table 7-4 Supply chain collaboration strategy ... 149
Table 8-1 Number of promotions at retail stores‘ for leading products ... 153
Table 8-2 Scales used in the data analysis ... 162
Table 8-3 Promotional and non-promotional sales ... 164
Table 9-1 Descriptive statistics of first order observed variables ... 175
Table 9-2 Exploratory factor analysis for 2ltr pet bottles ... 177
Table 9-3 Results of confirmatory factor analysis (Factor loading) -2ltr pet bottles ... 178
Table 9-4 Description of model fit indices ... 179
Table 9-5 Model summary of structural equation models – Fit indices ... 182
Table 9-6 Testing of structural model for different data sets of 2ltr pet bottles ... 185
Table 9-7 Exploratory factor analysis for 330ml cans ... 188
11
Table 9-9 Exploratory factor analysis for 500ml bottles ... 190
Table 9-10 Results of confirmatory factor analysis (Factor loading) 500ml bottles .... 191
Table 9-11: Significant demand factors ... 194
Table 10-1 Examples of output ... 198
Table 10-2 Summary output - Example 1 ... 200
Table 10-3 Summary output - Example 2 ... 203
Table 10-4 R2 value in regression analysis ... 205
Table 10-5 Average MAPE during regression period and forecast period – R1 ... 207
Table 10-6 Comparison of regression and traditional forecasts for R1 (year 2007) .... 211
Table 10-7 Average MAPE during regression period and forecast period – R2 ... 213
Table 10-8 Comparison of regression and traditional forecasts for R2 (year 2007) .... 215
Table 10-9 MAPE during regression period and forecast period – Retailer 3 ... 216
Table 10-10 MAPE during assessment period and forecast period – Retailer 4 ... 217
Table 10-11 Comparison of MAPEs in three forecasts – Retailer R1 ... 219
Table 10-12 Comparison of MAPEs in three forecasts – Retailer R2 ... 220
Table 10-13 Summary of results ... 222
Chapter 1
Introduction
Supply chain collaboration was regarded as a major research topic in the late 1990s
within the area of supply chain management. Firms interested in improving either cost
effectiveness or overall supply chain performance tend to collaborate with other supply
chain players (McIvor et al., 2003; McCarthy and Golicic, 2002; Matchette and Seikel,
2004). In general, businesses with similar objectives work closer together in order to
achieve the desired excellence in common supply chain processes such as planning,
forecasting, production and replenishment. However, the extent and intensity of
collaboration vary greatly based on individual business objectives, which in turn define
the level of supply chain collaboration (Larsen et al., 2003, ECR Europe, 2002).
At all the levels of supply chain collaboration, information exchange is considered an
integral part of bridging all the members in the collaborative arrangement. While
exchange of point of sales information and inventory records are widely encouraged
within the supply chain (Gavirneni et al., 1999; Raghunathan, 1999), the role of other
information such as promotional plans, forecasts and production levels are not much
discussed in the literature. The importance of transparent information exchange in the
supply chain is not explained in such a way to persuade many supply chain members to
be a part of collaboration (Barratt and Oliveira, 2001; Ryu et al., 2009). The main focus
of this research study stems from this aspect of supply chain collaboration.
Consequently, this research attempts to identify the role of information exchange in
supply chain collaboration in six different companies. After that, this research will
further analyse the potential benefits of collaboration in these companies. In this attempt,
the research goals and specific research questions are developed further in Chapters two
13 To understand the basic idea behind this research, it is important to know the
background of supply chain management and collaboration. For this reason, the
following sections outline an overview of the developments in supply chain
management over the past two decades with reference to practitioners‘ and researchers‘ viewpoints. The general purposes and strategies of supply chain collaboration are
explained further. Also, this chapter briefly outlines the research focus, contributions
and research approach. This chapter also summarises the structure of the thesis.
1.1 Background of supply chain management
Generally, supply chain management refers to the organisation and management of all
activities of a supply chain from suppliers through manufacturers, wholesaler, retailers
and customers. In other words,
Supply chain management is the management of upstream and downstream
relationships with suppliers and customers to deliver superior customer value at less
cost to the supply chain as a whole (Christopher, 1998).
Normally, suppliers are referred to as upstream members and customers are referred to
as downstream members in the supply chain (Chen and Paulraj, 2004). Traditionally,
the supply chain was designed with more focus on the movement of materials rather
than information flow (see Figure 1-1). Due to ever increasing competition in the
business world, the supply chain also has taken a twist from its traditional way of
functioning. This has resulted in a modern supply chain in which the integration of
material flow and information flow is a key aspect.
Although the supply chain has taken different forms, such as agile and lean supply
chains, over the past two decades, the core idea of the supply chain has always been
the traditional way of pushing inventory from upstream to downstream i.e. from
supplier to customer (Simchi-Levi et al., 2003a, pp-17). Similarly, the traditional way of
forecasting product demand independently by individual members is slowly being
replaced by collaborative forecasting arrangements (Aviv, 2007). Collaborative
forecasting involves exchanging information from different supply chain members so
that the demand for the final product (and hence the demand for components to be
supplied by different members) can be predicted more accurately (Aviv, 2007).
Although some recent supply chains include reverse flow of goods such as product
returns (Dowlatshahi, 2000; Daugherty et al., 2001), this research concentrates on the
forward supply chain with one-way material flow and two-way information flow as
shown in Figure 1-1.
Figure 1-1 Traditional versus Modern supply chain
1.2 What is supply chain collaboration?
A supply chain (SC) comprises suppliers, manufacturers, wholesalers, retailers and
customers (Christopher, 1998). All or some of these supply chain members can
coordinate their processes (namely planning, forecasting, production, and Goods flow …... Information flow Retailer Supplier Manufacturer Wholesaler Customer Traditional supply chain
(Flow of goods)
Modern supply chain
(Flow of goods and information)
15 replenishment) to make the supply chain more effective in terms of cost, revenue
generation and timely replenishment (SCC, 2001). When this supply chain coordination
formally continues to accommodate dynamic changes in various supply chain processes,
it will evolve into a collaborative supply chain. A collaborative supply chain encourages
exchange of relevant information to improve the accuracy of demand forecasts.
However, today‘s competitive and unpredictable business world makes demand forecasting a complicated task. In many supply chains, order variability increases from
downstream to upstream and can result in excess inventory and huge obsolescence
throughout the supply chain (Lee et al., 1997; Lee and Padmanabhan, 1997; Lee and
Whang, 1999). To avoid such problems, information exchange and collaboration in SCs
are encouraged in the literature. Fisher et al. (1994) have conducted a case study of
Sports Obermeyer (manufacturer of fashion skiwear) and found that the real success of
a product was dependent on the customers‘ response to the product. They have also found that the exchange of point of sales data from downstream members helped the
upstream members to understand demand patterns, which in turn assisted the future
planning, production and replenishments. However, Toktay et al. (2000) have observed
that the information exchange was possible only when the two supply chain members
expected mutual benefits from the partnership.
To reap maximum benefit from collaboration, each member of the supply chain may
need to make different levels of infrastructural investment. Companies do collaborate
for new product design and launch; but this aspect is beyond the scope of this research.
This research will identify the role of information exchange and the potential benefits
for companies that are involved in supply chain collaboration, for the purpose of
1.3 Purposes and strategies of supply chain collaboration
Businesses have been collaborating for several decades in many different forms for
various purposes (Horvath, 2001; Barratt, 2004; Danese, 2007). Some of the purposes
of collaboration are - improve overall business performance, reduce cost, increase profit
and improve forecast accuracy (McCarthy and Golicic, 2002; McIvor et al., 2003;
Matchette and Seikel, 2004). Lucrative benefits of collaboration encourage many supply
chain members to initiate the process of collaboration. This is reflected in recent supply
chains having information exchange among supply chain members as one of the core
processes in a formal or less formal collaboration (Chang et al., 2007). Generally in the
SC literature, the purpose of supply chain collaboration is related to the company‘s business goals, objectives and business strategies. This research aims to identify
benefits of such collaboration in various supply chains. In this effort different
companies, Make-To-Order (MTO) and Make-To-Stock (MTS), are studied for their
collaborative arrangement with their downstream partners.
In an attempt to identify the right supply chain for various products, Fisher (1997) has
classified products under two main categories, namely functional products and
innovative products, depending on their demand pattern. In general, functional products,
such as groceries and food products, show less demand uncertainty while innovative
products, such as music players and mobile phones, show high demand uncertainty.
Subsequently Lee (2002) has presented a framework that matched supply chain
strategies with demand and supply uncertainties of both functional and innovative
products (see Figure 1-2). Lee‘s framework is the starting point of this research. According to his framework, functional products with low supply uncertainty need to
have supply chain strategies aiming at the highest cost efficiency. However, the same
17 with inventory pooling and resource sharing. Innovative products with low supply
uncertainty need to have responsive supply chains (responsive to customer demand) and
innovative products with high supply uncertainty need to have agile supply chains with
the combined strengths of ‗hedged‘ and ‗responsive‘ supply chains. Figure 1-2 Supply chain strategies
Demand Uncertainty
Efficient supply chains Responsive supply chains
Risk-hedging supply chains Agile supply chains
Source: Lee (2002)
Each supply chain mentioned in Lee‘s framework has different characteristics and hence necessitates a different supply chain coordination mechanism. For example, to
achieve Lee‘s ‗efficient supply chain‘, with low demand uncertainty and low supply uncertainty, a simple transactional level of collaboration between suppliers and buyers
may be sufficient. However, to achieve Lee‘s ‗agile supply chain‘, with high demand uncertainty and high supply uncertainty, a close level of collaboration among different
supply chain members may be needed.
Lee (2002) and Fisher (1997) have defined functional products as those with stable
demand patterns. However, their demand need not be quite stable in the presence of
sales promotions. In recent years, sales promotions at retail outlets have become a
common practice, especially in the UK. These sales promotions increase normal sales of
functional products and hence the functional products will also have uncertain demand
Su pp ly Uncer ta inty Low (Stable process) High (Evolving process) Low (Functional products) High (Innovative products)
during the period of promotional sales. In such cases, the promotional sales of
functional products will not follow a stable demand pattern as defined in Lee (2002) and
Fisher (1997). To execute sales promotions, an active participation from all supply
chain partners is highly critical. Aviv (2007) has highlighted that Collaborative
Planning Forecasting and Replenishment (CPFR) may be a good option to improve the
agility in supply chain. This is mainly because the CPFR framework encourages
transparent information exchange as one of the key elements of collaboration. This
particular aspect of CPFR is considered further in this research to identify the role of
information exchange in planning, forecasting and replenishment processes at various
companies.
1.4 Research focus
The main focus of this research will be on the analysis of collaborative arrangements
and related information exchange, specifically for supply chain collaboration initiatives
such as CPFR. Originally CPFR emphasised infrastructure of information technology
(IT) as part of collaborative planning and forecasting. However, IT infrastructure is not
the main aspect of this research. This research will focus on the collaboration among
supply chain members aiming to improve demand forecasting through information
exchange. Demand patterns of products and their respective information requirement for
CPFR will be analysed through a conceptual model called the ―Reference Demand Model‖ in case companies. This will assist managers in drawing conclusions on the need for collaboration in various businesses.
While considering the benefits of CPFR, this exploratory research is also focusing on
the underlying factors that have significant impact on the demand. This research is
exploratory in the sense that it considers larger sets of demand factors, systematically
19 processes of the supply chain is discussed with evidence from the literature and case
studies.
1.5 Research approach
This research employs both quantitative and qualitative approaches. Initially the case
study approach, which is a qualitative approach, is used to understand the extent of
collaborative arrangements between manufacturers and downstream supply chain
members. Case studies are conducted in different companies namely, a soft drink
manufacturer, a wholesaler of soft drink products, a textile material manufacturer, a
packaging material manufacturer, an electrical equipment manufacturer, and a crude oil
refiner and distributor. All these case companies practice supply chain collaboration
with their downstream customers. The position of these companies in the supply chain
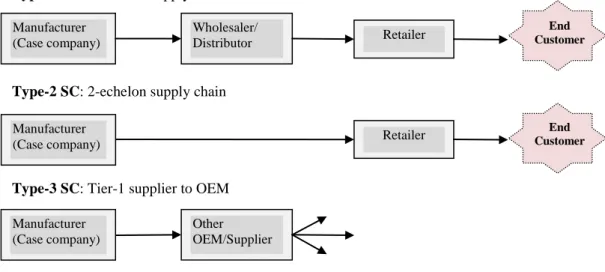
is classified as type-1; type-2 and type-3 (see Figure 1-3).
Figure 1-3 Position of the case companies in the supply chain
Type-1 companies have 3-echelon supply chains involving a manufacturer dealing with
wholesalers and retailers. Type-2 companies have 2-echelon supply chains involving a Type-1 SC: 3-echelon supply chain
Type-2 SC: 2-echelon supply chain
Type-3 SC: Tier-1 supplier to OEM
End Customer Retailer Wholesaler/ Distributor Retailer Manufacturer (Case company) Manufacturer (Case company) Other OEM/Supplier Manufacturer (Case company) End Customer
manufacturer dealing with retailers. Type-3 companies are manufacturers/suppliers of
raw materials either to original equipment manufacturers (OEM) or to other suppliers.
In the case studies, attention was paid to understand the role of information exchange at
various tiers of the supply chain. This information was then used to create a conceptual
‗Reference Demand Model‘ (RDM), presenting the factors and events on which the final product demand was based. In this attempt, some steps to identify the need for
improving the RDM were also suggested. This approach has helped to identify the
potential benefits of information exchange in supply chain collaboration, which is the
main focus of this research.
For one of the case companies, Soft Drink Co, detailed quantitative sales data was
available. Hence, more sophisticated quantitative modelling methods such as structural
equation modelling and multiple regression analysis have been employed to understand
the underlying demand structure. While structural equations were developed to establish
the general structure of demand, regression models were developed to forecast demand.
Knowledge gained through the RDM and other quantitative models will assist managers
in decision making on future collaborative information exchange.
1.6 Structure of the thesis
The thesis is structured as follows. Chapter two starts with a literature review to
facilitate appropriate direction for this research and to identify the research goals. Based
on these goals, research questions are formulated and explained along with an
appropriate research methodology in Chapter three. Chapter four reports the case
studies from British companies and Chapter five reports the case studies from Indian
companies. Chapter six explains the development of the conceptual Reference Demand
21 discusses the cross-case analyses of all of the cases studied in chapters four and five.
Chapters eight to ten provide a quantitative perspective to the RDM framework
developed in Chapter six. The quantitative approach is applied to only one case study
company - a Soft Drink Manufacturer that has supply chain collaboration with major
retailers and wholesalers. Data description is detailed in Chapter eight. Structural
equation models are developed in Chapter nine. These models assist in grouping
products based on their characteristics of demand. Chapter ten uses multivariate linear
regression analysis models for analysing demand data. Chapter eleven summarises the
contribution of this research. This final chapter also includes some ideas for future
Chapter 2
Literature Review
2.1 Introduction
Perceived and expected benefits of supply chain collaboration (SCC) have prompted
supply chain (SC) partners to develop sophisticated ways of exchanging information for
better management of supply chain processes (namely planning, forecasting, production
and replenishment). Improved accuracy of forecast of product/component demand has
been recognised as a key benefit of such collaboration (Ireland and Crum, 2005). Better
forecasting is said to reduce the problem of the so called bullwhip effect, which refers to
an amplification of demand variability, resulting in excess inventory in all levels of the
supply chain (Lee and Padmanabhan, 1997). The information needed to forecast
demand varies depending on the nature of product (e.g., functional or innovative), on
the position of the partner in the supply chain (e.g., a retailer or a manufacturer or a
supplier of raw material/components) and also on business objectives (e.g., businesses
with promotional sales need to collaborate for promotional planning). This chapter deals
with the literature on supply chain collaboration with special emphasis on the
Collaborative Planning Forecasting and Replenishment (CPFR) framework to
understand the structure and the role of information exchange. Studies on promotional
sales forecasting are also discussed. Important gaps in the literature are identified and
discussed at the end of this chapter.
2.2 Supply chain collaboration
Although the literature on supply chain management (SCM) is rich with several
research ideas, concepts, models and case studies, the concept of collaboration has only
really evolved over the past two decades. But, several companies or businesses have
23 (Horvath, 2001; Barratt, 2004; Danese, 2006, 2007). In the past three decades several
academics have researched the purposes behind various types of SC relationships.
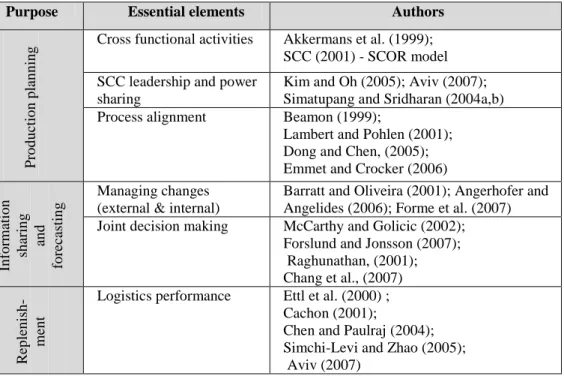
Table 2-1 reports the purpose of various SC relationships into three main headings:
production planning, information sharing and forecasting, and replenishment.
Companies that collaborate for production planning may need to have cross functional
activities and clear power sharing agreement to better align their production processes
(Akkermans et al., 1999; Beamon, 1999). Companies that collaborate for information
sharing and forecasting may need to accept organisational changes, both internal and
external to the company, to improve their performance (Barratt and Oliveira, 2001;
Forme et al., 2007). This will help the SC partners in joint decision making. Companies
that collaborate for timely replenishment need to be good in logistical performances
(Simchi-Levi and Zhao, 2005; Chen and Paulraj, 2004).
Table 2-1 Purpose of supply chain relationships
Purpose Essential elements Authors
Pro d u ctio n p lan n in g
Cross functional activities Akkermans et al. (1999);
SCC (2001) - SCOR model SCC leadership and power
sharing
Kim and Oh (2005); Aviv (2007); Simatupang and Sridharan (2004a,b)
Process alignment Beamon (1999);
Lambert and Pohlen (2001); Dong and Chen, (2005); Emmet and Crocker (2006)
In fo rm atio n sh ar in g an d fo rec asti n g Managing changes (external & internal)
Barratt and Oliveira (2001); Angerhofer and Angelides (2006); Forme et al. (2007)
Joint decision making McCarthy and Golicic (2002);
Forslund and Jonsson (2007); Raghunathan, (2001); Chang et al., (2007) R ep len is h - m en t
Logistics performance Ettl et al. (2000) ;
Cachon (2001);
Chen and Paulraj (2004); Simchi-Levi and Zhao (2005); Aviv (2007)
Most of these studies have discussed the purpose of the SC relationship, but in isolation
in these studies. Some supply chain practices such as Vendor Managed Inventory (VMI)
and Collaborative Planning Forecasting and Replenishment (CPFR) use demand
information in supply chain processes. The next section continues with a brief history of
the evolution of these supply chain management practices. Supply chain collaboration,
with particular interest to the CPFR framework, is discussed in detail in later sections.
2.2.1 A brief history of the evolution of SCM practices
Several practices such as Vendor Managed Inventory (VMI), Efficient Consumer
Response (ECR), Continuous Replenishment (CR) and Accurate response (AR) have
been suggested to improve material and information flows in supply chains. (Barratt and
Oliveira, 2001)
VMI developed in mid 1980s when Wal-Mart and Procter & Gamble jointly decided to
implement the initiative as a pilot project. After the successful implementation, VMI
was subsequently adopted by many other leading companies such as Nestle and Tesco,
Boeing and Alcoa (Micheau, 2005). VMI is one of the most popular partnering
initiatives for encouraging collaboration and information sharing among trading
partners. In VMI, vendor decides on the appropriate inventory level of each of agreed
product, and the appropriate inventory policy to maintain these levels, whereas the
retailers provide access to real-time inventory information (Sari, 2008).
In VMI, communication technology has become essential to help vendors in order to
access retailers‘ inventory status. Waller et al (1999) stated that the success of VMI implementation depends on computer platforms, communications technology, and
product identification and tracking systems which should be in place at both the retailers
and suppliers. They also pointed out that the software systems are the most important,
25 stock levels, transportation routing and inter facility trans-shipments. Advanced
Technologies such as EDI (Electronic Data Interchange) are an enabler. However,
Holmström (1998) showed that VMI could be enabled via fax, emails and spreadsheets.
VMI is expected to help retailers gain competitive advantage by improving product
availability and service level as well as decreasing inventory monitoring and ordering
cost (Sari, 2008). Increased information flow in VMI can help making fast decisions
and reducing the bullwhip effect (Disney and Towill, 2003). In addition, it may result in
better utilization of manufacturing capacity and better synchronization of replenishment
process (Waller et al 1999).
Even though many benefits have been identified, there are also many challenges. For
instance, Sari (2008) showed that Sparton Stores, a grocery chain, shut down its VMI
effort in about one year due to VMI vendors‘ inability to deal with product promotions. Similarly Kmart cut a substantial amount of VMI contracts because Kmart was not
satisfied with the forecasting ability of VMI vendors. A major obstacle of VMI
initiative was ineffective usage of retail level information. Since retailers are closer to
the marketplace, they may have better knowledge about customer behaviours, products
and marketplace (Sari, 2008). However, in early VMI programs, this unique
knowledge of the retailers was not included into inventory decisions. This is because in
a typical VMI program, retailers were excluded from the demand forecasting process.
Continuous replenishment (CR), introduced in the late 1980s, is a result of some
improvements over VMI. It involves replenishing inventory continuously in smaller
batches. CR uses point of sale (POS) data for replenishment. During its initial stages,
CR was considered a success by the companies that applied it. For example, initially,
(Cachon and Fisher, 1997; Fisher, 1997). However, the benefits of CR did not prove to
be sustainable owing to a lack of coordination between suppliers and buyers in sharing
the cost information (Fisher, 1997). Also CR was not successful in avoiding excess
inventory in the pipeline at Procter & Gamble (Barratt and Oliveira, 2001).
In an effort to achieve better supply chain collaboration, an integration of VMI and CR
was attempted by some companies. Companies also harnessed the advances in
information technology in the form of Electronic Data Interchange (EDI) to make point
of sale data available to supply chain partners. These three developments, VMI, CR and
EDI, have been successfully employed by some companies (such as P&G) under the
name of ECR to reduce the information distortion in supply chains and also to reduce
lead time (Andraski, 1994).
In all of the above supply chain practices, the impact of inaccurate forecasts on its
performance was not considered as a major issue. Later in 1997, Sports Obermeyer, a
leading sports company has adopted a new approach called ‗Accurate Response‘ (AR) (Fisher et al., 1997). Using this approach the company has suggested observing its
customer demand to make accurate forecasts and to incorporate this customer demand
information in their own production plans and production plans of suppliers. The
attractive feature of AR is the use of early market signals to predict demand of highly
unpredictable items (Fisher et al., 1997). The use of AR improved supply chain
flexibility, reduced production costs and reduced production lead times of Sports
Obermeyer, but was not considered effective in the case of high supply uncertainty.
With the arrival of the internet, new and hitherto unexpected channels for sharing
information have become available to supply chain members. Given the increasing
27 information technology and the use of the internet, a new supply chain management tool
has emerged in the last few years for supply chain collaboration. This new tool is the so
called Collaborative Planning, Forecasting and Replenishment (CPFR) framework. This
framework exploits computer networking, information technology and other internet
based technologies. Some researchers see CPFR as a second generation ECR (Seifert,
2003) to help companies to rapidly respond to consumer demand (Sherman, 1998).
2.2.2 CPFR framework
CPFR was introduced as a pilot project between Wal-Mart and Warner-Lambert in the
mid-nineties, aiming to be highly responsive to consumer demand. According to the
Voluntary Inter-industry Commerce Standards Association (VICS) (2004), CPFR can
be perceived as a new collaborative business framework that could combine the
intelligence of multiple trading partners in the planning and fulfilment of customer
demand by linking sales and marketing best practices. Due to its flexible and adaptive
nature, the companies practicing CPFR reaped early successes in the US retail industry;
but it is still in its infancy in Europe (Seifert, 2003).
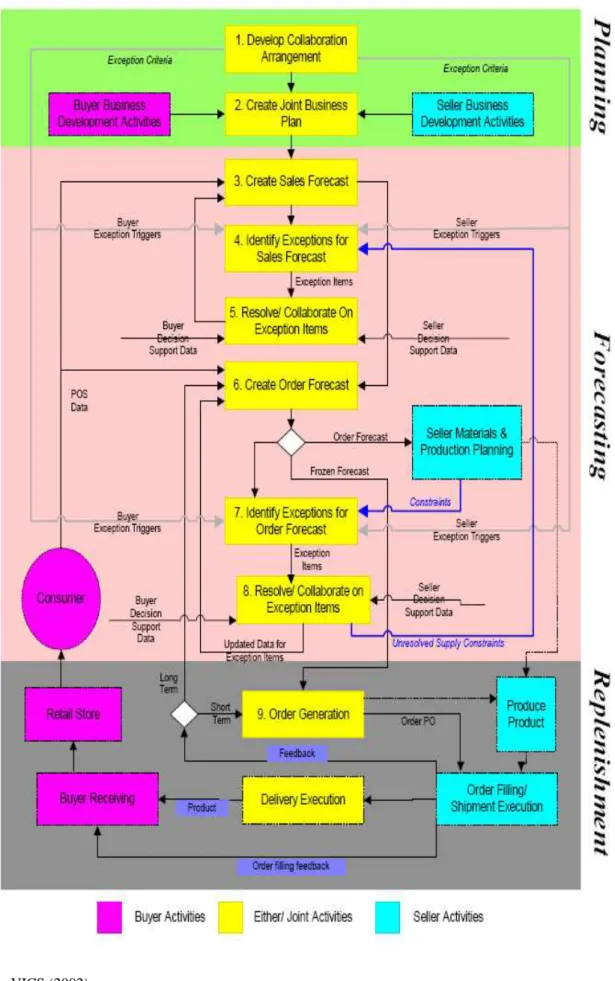
The CPFR Process Model (VICS, 2002; Ireland and Crum, 2005 and Seifert, 2003)
involves nine steps, grouped under three stages called planning, forecasting and
replenishment (see Figure 2-1 for CPFR process model). In stage one, the collaborative
arrangement is formally agreed by supply chain members. In stage two, forecasts from
individual supply chain members along with sales information are exchanged to arrive
at a single demand forecast figure. In the final stage, products are replenished based on
Stage I: Planning the collaboration
Collaborative planning aims at improving the visibility between upstream and
downstream partners. Implementing CPFR needs to begin with understanding of CPFR
practices at all levels. Conflicting areas such as resource sharing and allocation need to
be resolved before initialising CPFR (VICS, 2002; Ireland and Crum, 2005). At this
stage of collaborative planning, five important questions need to be answered by all the
partners intending to initiate collaboration:
Who are the collaborating partners?
What is the role and task of each player?
What is the incentive for each player in the supply chain collaboration?
What types of resources need to be shared?
How and what type of information will be shared?
In CPFR, the planning stage comprises the development of the collaboration
arrangement and the creation of joint business plans (Steps 1- 2).
Step 1 - Develop collaboration arrangement: CPFR mission statement, goals and
objectives are formed in this stage. Identification of core competencies, resource and
information sharing, and role of each player are discussed in detail to avoid
disagreements. Front-end agreement is created and updated time to time to reflect any
new developments.
Step 2 - Create joint business plans: This stage comprises of definition of product
category roles, objects, tactics etc. The development of joint business plans facilitates
29 Figure 2-1 CPFR Process Model
Stage II: Forecasting
This stage includes creating sales and order forecast, identifying exceptions for sales
and orders forecast and resolving exception items (VICS, 2002). Sales forecasts are
made based on the historic sales that assist production planning. Order forecasts (or
dispatch forecasts) are based on sales forecasts but possibly adjusted for existing
inventory, and time-phased (to account for distribution lead times) to ensure timely
replenishment (see Figure 2-2). Initially, internal forecasts are developed by all supply
chain partners independently, based on the information available to them. Internal
forecasts by each supply chain partners are reconciled to produce a Collaborative
Forecasting (CF). CF is ‗advanced demand information‘ based on the forecasts figures from the other partners (Aviv, 2007).
Figure 2-2 Sales forecast and dispatch forecast
Proper use of available information can assist achieving improved forecast accuracy.
Answering the following questions will help to better understand the process of CF.
What information or data is needed to forecast demand?
31
How frequently will the data be exchanged and how?
What technology will be used to exchange the data?
How will CF be calculated?
How is the CF figure incorporated into production planning?
VICS (2002) created steps 3 - 8 in the CPFR process model to explain the collaborative
forecasting.
Step 3 - Create sales (demand) forecast: Sales forecasts are made on the basis of
historical POS data and other information on planned events such as promotions.
Step 4 - Identify exceptions for sales forecast: Exceptions to the sales forecast such as
seasonal and trend values are identified in the data.
Step 5 - Resolve/collaborate on exception items: Once the exceptions to sales forecast
are identified, clarification is made to create a new sales forecast through mutual
communication.
Step 6 - Create order forecast: POS data is linked to the individual inventory strategy to
help generate specific order forecast. Short term forecasts and long term forecasts are
used to generate actual order and overall planning respectively.
Step 7 - Identify exceptions for order forecast: In this step, exceptions to the
collaboratively determined acceptance of the order forecast are identified.
Step 8 - Resolve/collaborate on exception items: Exceptions are resolved through
communicating with the partners and new forecast is created incorporating exceptions.
It was identified that the effective information sharing (Raghunathan, 2001) and joint
generation and avoid bullwhip effect (Lee et al., 1997; Lee and Padmanabhan, 1997).
Also by sharing inventory status companies can ensure timely replenishments
(Gavirneni et al., 1999).
Stage III: Replenishment
In the CPFR process model (see Figure 2-1), demand forecasts by individual supply
chain members are aggregated to generate orders, which in turn are used to make
decisions on replenishment.
Step 9 - Order generation: Based on the order forecast, order generation is handled
either by manufacturer or retailer depending on their competence in the process, access
to appropriate technology and the availability of resources. Through joint planning and
decision making, the understanding of the replenishment process is becoming clearer
(Barratt and Oliveira, 2001); which is considered as one of the positive features of
collaboration.
These nine steps of CPFR framework are combined to form the CPFR business process
model, which has been adopted by companies such as Wal-Mart, Sara Lee Corporation,
Motorola, Hewlett-Packard Corporation, Gillette, Procter & Gamble, IBM etc. It is
important to note that all steps of CPFR need not be performed by all supply chain
players.
2.3 Impacts of supply chain collaboration: Models and case studies
The CPFR business process model is based on the experiences of practitioners and their
business strategies (Ireland and Crum, 2005; Fliedner, 2003). However, increasing need
to better align supply with demand has prompted academics and practitioners to suggest
33 collaboration (Chung and Leung, 2005; Corsten and Felde, 2005). Chung and Leung
(2005) have suggested inclusion of market information in the CPFR processes to
improve responsiveness of the supply chain and also to incorporate ‗engineering change control’ in the business process. This process of engineering change control is aimed to integrate knowledge of different supply chain players. Chang et al. (2007) have
proposed ‗an augmented CPFR model‘ to include market data in forecasting to improve its accuracy and to reduce the bullwhip effect. Humphreys et al. (2001) have ascertained
that supplier collaboration and level of trust have positive impact on innovation and
success of the supply chain. In SC collaborations, the performance of suppliers can be
improved through knowledge transfer programs (Modi and Mabert, 2007). The
conceptual model developed by Corsten and Felde (2005) has related impact of trust,
dependence and supplier collaboration on innovation, purchase cost reduction and
financial performance. Some models have related internal and external collaboration
with logistical service performance in order to maximise the benefits of supply chain
collaboration (Cooper et al., 1997; Stank et al., 2001; Cooke, 2002; Caridi et al., 2005).
Almost all conceptual frameworks have been designed to explain the organisational and
functional aspects of the supply chain collaboration whereas mathematical or simulation
models have focused more on the performance evaluation in the way of identifying the
quantifiable benefits. This also helps to identify the areas for improvement.
Collaborative forecasting has been described in the literature to improve forecast
accuracy (McCarthy and Golicic, 2002; Aviv, 2007). Information sharing plays an
important role to improve forecast accuracy. This is evident from mathematical models
developed by Lee et al. (2000) and Raghunathan (2001). Simulation models of Kim
performance evaluation of supply chain collaboration to identify the areas that need
improvement. Table 2-2 covers the literature on models of CPFR.
VICS (2002) claims that CPFR will help to save cost and gain competitive advantage.
Several case studies have been reported in the literature that examined the impact of
collaboration. Some of the studies are tabulated in Table 2-2. Tangible and intangible
benefits of collaboration are evident through a specific case study on West Marine (see
www.vics.org). Wal-Mart‘s initiative of constructing purchase patterns on the profiles
of customers has helped to increase visibility of demand throughout the value chain
(Mclvor et al., 2003). The importance of information exchange and demand forecast
based on the sales data have helped Sport Obermeyer to improve forecast accuracy
amidst demand uncertainty (Fisher et al., 1994). In general, most of the CPFR cases
reported improved inventory levels and forecast accuracy. This is evident from the cases
of Burlington Northern Santa Fe (BNSF) and P&G. However, poor forecast capability
of some players in the European grocery sector have made collaborative forecasting
complicated (Smaros, 2007). Many case studies listed in Table 2-2 and Table 2-3 are
Table 2-2 Some existing models in collaborative supply chain from the literature
Author Type of model Purpose and findings
Conceptual models
Chung and Leung (2005)
An improvement to CPFR model
Purpose: To be responsive to market changes.
Key insight: Inclusion of ‗Engineering change management‘ increases the responsiveness to market changes. Simatupang and Sridharan (2004a) Simatupang and Sridharan ( 2004b) Collaborative performance system
Empirical evidence for performance of supply chain collaboration
Purpose: Measure the current status of the performance of supply chain collaboration and to systematically improve the identified gaps.
Key insight: Collaborative enablers are directly linked with collaborative performance metrics.
Four types of collaboration identified: Efficient, underrating, prospective and synergistic.
Stank et al. (2001) Model related internal and
external collaboration with logistical service performance
Key insights: To achieve logistical effectiveness, firms should promote collaboration across internal processes. Collaboration with external supply chain partners along with internal support will improve logistical services.
McCarthy and Golicic (2002)
Collaborative forecasting Increased revenues and earnings are possible with collaborative supply chain.
Lambert and Pohlen (2001)
Developed a framework with following seven steps:
supply chain mapping, identifying value addition process, identifying the effect of relationship on profitability, realign supply chain processes accordingly, measure individual performance, compare value with supply chain objectives, replicate steps at each link in the supply chain
Caridi et al. (2005) Multi agent model to optimise
benefits of supply chain collaboration
Insight: Mutli-agent system can be used to automate and optimise supply chain collaboration.
Singh and Power (2009) Structural Equation Model Insight: Firm performance will increase if both supplier and customer are involved in collaborative relationship.
Simulation models
Angerhofer and Angelides (2006)
Performance measurement Model helps to identify the areas need improvement by measuring the performance of the supply chain
Kim and Oh (2005) Performance measurement Purpose: To check the impact of structure of decision making process in the collaborative
Author Type of model Purpose and findings
Key insight: Collaborative (balanced) decision-making in the supply chain creates more value in the system level.
Fu and Piplani (2004) Evaluation of supply-side
collaboration
Key insight: Supply-side collaboration can improve the distributor‘s performance.
Chang et al. (2007) Simulation model to verify
forecast accuracy
Purpose: To test A-CPFR (Augmented CPFR) on forecasting accuracy and reduction of the bullwhip effect.
Key insight: A-CPFR, with application of service provider, will have access to market information and hence can improve forecast accuracy and achieve considerable reduction of inventory.
Optimisation and other models
Aviv (2001)
Aviv (2007)
Aviv (2002)
Mathematical model for forecasting
Mathematical model for forecasting
Mathematical model for joint forecasting and replenishment
Purpose: Finding the usefulness of collaborative forecasting in supply chain by quantifying the inventory and service performance of supply chain
Key insight: Products with shorter lead time have more benefit from supply chain collaboration.
Purpose: Study the potential benefits of collaborative forecasting in a decentralized supply chain
Key insight: Dominance or power of partnership, agility of the supply chain and internal service rate affect the benefits of collaborative forecasting.
Key insight: Auto-regressive demand process can decrease the demand uncertainty in VMI and CFAR (Collaborative Forecasting and Replenishment) programmes.
Chen and Chen, (2005) Mathematical model for joint
replenishment
Purpose: To develop four decision making models to determine optimal inventory replenishment and production policies in a supply chain considering three-level inventory system in a two echelon supply chain; Model also includes major and minor set-up cost for manufacturers, and major transportation and minor processing cost for the retailer.
Raghunathan, (2001); Lee et al. (2000)
Mathematical model Inventory reduction and cost reduction can be achieved with efficient use of information sharing (Lee et al, 2000) and there is no need to invest in inter-organizational systems for information sharing if order history is available (Raghunathan, 2001).
Mishra and Shah (2009) Structural equation model New product development will benefit from collaborative effort of supplier and customer, and cross functional involvement.
37 Table 2-3 Literature overview of some case studies and reviews on CPFR
Author Name of industry adopted CPFR Purpose to adopt CPFR/Collaborative forecasting Modification/ improvement to the original CPFR framework Benefit or impacts Barriers of implementati on How was it resolved? Collaboration (supplier/ manufacturer/ retailer) Technology and forecasting Ireland and Crum (2005); Parks (2001) Wal-Mart-Retailer Reduce bullwhip effect and improve SC performance.
Initiated development of CPFR framework along with VICS Association Improved product availability and reduced price, reduced inventory Less accuracy in forecasting Using technology and frequent information sharing Supplier - Retailer Initially used Electronic Data Interchange then developed a private information exchange called Retail Link Steermann (2003) Sears-Michelin Improve inventory disparity Included evaluation and assessment in each stage Inventory level cut by 25 % Less information visibility Using technology and frequent information sharing Producer-Retailer GNX(GlobalNetX change) with Manugistics Smith (2006) West Marine Inc-Consumer goods retailer Accelerate business performance by adopting appropriate technology and cross-functional support Added performance improvement steps Increased forecasting accuracy Need to change core culture Supplier training programme Retailer-suppliers JDA/E3 forecasting systems Wise and Fagan (2001) Burlington Northern and Santa Fe (BNSF)-Coal manufacturer Improve resource planning ---- Improved coal movement between manufacturer (supplier) and customer Information sharing Web based collaborative forecasting tool Supplier-buyer Web-based collaborative Coal Forecasting tool Schachtman (2000); Ireland and Crum (2005) Procter & Gamble - manufacturer Improve forecast accuracy, reduce inventory, reduce operating expenses
Pilot test was successful Improved cycle time, reduced out of stock problem Internal forecasting system Using Syncra collaboration tool Manufacturer-Retailer Syncra Ct trading collaboration tool Cadilhon and Fearne (2005)
Metro Cash & carry - grocery wholesaler
Not formal CPFR, but engage in collaboration, joint planning and information sharing to optimise forecasting and product replenishment ---- Trust based relationship Information sharing Using frequent communicatio n through simple mode like phone/fax Wholesaler (supplier)-retailer Tele-communication
Author Name of industry adopted CPFR Purpose to adopt CPFR/Collaborative forecasting Modification/ improvement to the original CPFR framework Benefit or impacts Barriers of implementati on How was it resolved? Collaboration (supplier/ manufacturer/ retailer) Technology and forecasting Chung and Leung (2005) Copper clad laminate industry Reduction of -- inventory, stock-outs, obsolescent scrap, running cost; improvement in - accuracy of sales and order forecast, response to engineering change
CPFR process was modified with engineering change control Increased sales with reduced cost. Improved supply chain performance and profitability Lack of point of sale data. Frequent changes in product design Engineering change control was introduced in CPFR process Manufacturer-end user
For the pilot project: sales forecast using MRP program developed by EDP programmers and Data exchange using Excel spread sheet. Smaros (2007) European grocery sector Observation of the challenges of implementing collaborative forecasting in the European grocery sector ---- Findings: Technology in collaboration is not a key obstacle. Retailers and manufacturers have different forecasting and collaboration needs Findings: 1. Retailers‘ limited forecasting capability is a key obstacle. 2. Lack of integration and long production interval are barriers to collaborate --- ---- ----