Procedia Computer Science 48 ( 2015 ) 574 – 581
1877-0509 © 2015 The Authors. Published by Elsevier B.V. This is an open access article under the CC BY-NC-ND license (http://creativecommons.org/licenses/by-nc-nd/4.0/).
Peer-review under responsibility of scientific committee of International Conference on Computer, Communication and Convergence (ICCC 2015) doi: 10.1016/j.procs.2015.04.138
ScienceDirect
International Conference on Intelligent Computing, Communication & Convergence
(ICCC-2014)
Conference Organized by Interscience Institute of Management and Technology,
Bhubaneswar, Odisha, India
An Approach to EEG Based Emotion Recognition and Classification
using Kernel Density Estimation
Prashant Lahane
1, Arun Kumar Sangaiah
21Department of Computer Engineering, MIT College of Engineering, Pune, Maharashtra, India 2School of Computing Science and Engineering, VIT University, Vellore, Tamil Nadu, India
[email protected] [email protected]
Abstract
This paper aims to proposed emotion recognition using electroencephalography (EEG) techniques. Recognizing emotion by using computers is becoming popular these days. This paper is based on calculating EEG signals and recognizing emotion from human brain activity. Electroencephalogram (EEG) signals are taken from the scalp of the brain and assessed in responds to several stimuli from the four basic emotions on the IAPS emotion stimuli. Features from the EEG signals are captured using the Kernel Density Estimation (KDE) and classified via the artificial neural network classifier to recognise emotional condition of the subject under test. Results are obtained to prove that the proposed modified KDE gives better results in terms of accuracy. Also, the proposed method gives better estimation of emotion of the subject from streaming EEG data by using the concept of cluster kernels.
© 2014 The Authors. Published by Elsevier B.V.
Selection and peer-review under responsibility of scientific committee of Missouri University of Science and Technology.
Keywords: Electroencephalography (EEG) Signals; Independent Component Analysis (ICA); Kernel Density Estimation (KDE); Artificial Neural Network (ANN);
© 2015 The Authors. Published by Elsevier B.V. This is an open access article under the CC BY-NC-ND license (http://creativecommons.org/licenses/by-nc-nd/4.0/).
Peer-review under responsibility of scientific committee of International Conference on Computer, Communication and Convergence (ICCC 2015)
___________________________________________________________________________________________
1. Introduction
In the past, bio signals have been used for many purposes besides the conventional uses of clinical diagnosis and cognitive neuroscience. The paper aims is emotion recognition through EEG signals. As we know emotions play an important role in day to day life of human beings, the need and importance of emotion recognition has grown with increasing role of Brain Computer Interface (BCI). EEG-based technologies were initially used only in medical applications like epilepsy and seizures. Since availability of new wireless headsets that are portable, price effective
* Corresponding author. Tel.: +91-8108333923 ,+919842935634 E-mail address- [email protected];[email protected]
and easy to use are available in the market. It expands the possibility to spread the technology to the areas such as entertainment, e-learning, virtual worlds, etc. Automatic emotion detection from EEG signals is receiving more attention with the development of new forms of human-computer interaction with digital media. The goal is to perform real-time emotion classification using automatic machine learning algorithms.
The system aims to recognize emotion from EEG signals. The input of the system consists of EEG signals and the output of the system will be some indicator about what emotion the subject experiences. Main Goals of the system are using KDE method.
Precise density estimation of streaming data.
Optimum memory usage during processing of streaming data using kernel density estimation. Attain efficient classification and clustering of EEG and ECG data stream.
2. Related Work
Earlier studies have used physiological signals to detect emotion. For example, Choppin1 has built an emotion
recognizer for patients suffering from amyotrophic lateral sclerosis (als). Moreover, Choppin1 have investigated
only EEG signals to recognize emotion, in order to provide those people with the possibility to express their feelings. In addition, this study have used neural networks to classify the EEG signals online, and achieved a correct classification rate for new unseen samples of about 64%, when using three emotion classes and limited training data sets. Musha et al.2 have explored EEG signals to read a person's emotion. They have extracted cross-correlation
coefficients between the EEG activities from different locations and computed an `emotion matrix' to transform these coefficients linearly into a four element vector that corresponds with four basic emotions. The numbers in the vector denote how strong that particular emotion is found in the EEG signals. Earlier study3 have investigated the
estimated subjective feeling via neural networks to categorize emotional states on the basis of EEG features. Moreover, this study has reported that average accuracy range from 54.5% to 67.7% for each of four emotional states. Subsequently, Heraz et al.4 established an agent to predict emotional states during learning. The best
classification in the study was an accuracy of 82.27% for distinguishing eight emotional states, using k-nearest neighbours as a classifier and the amplitudes of four EEG components as features. In addition, Chanel et al.5 have
reported an average accuracy of 63% by using EEG time-frequency information as features and SVM as a classifier to characterize EEG signals into three emotional states. Further, Zhang and Lee6 proposed an emotion understanding
system that classified users’ status into two emotional states with the accuracy of 73.0% ± 0.33% during image
viewing. Moreover, this system employed asymmetrical characteristics at the frontal lobe as features and SVM as a classifier. Finally, Lin at al.7 applied machine learning techniques to categorize EEG signals according to subject
self-reported emotional states during music listening. They propose a framework for systematically seeking emotion specific EEG features and exploring the accuracy of the classifiers. In particular, they applied support vector machines to classify four emotional states: joy, anger, sadness, and pleasure. As given in the literature survey, there has been continuous research in the field of emotion recognition.
3. Research Gaps from Existing work
Higher order crossings (HOC) analysis used HOC-emotion classifier (HOC-EC), which has implemented and tested via four different classifiers [quadratic discriminant analysis (QDA), k-nearest neighbour, Mahalanobis distance, and support vector machines (SVMs)], in order to accomplish efficient emotion recognition7. In addition, this
techniques was efficient and having the limitations of computation time and complexity. In Hidden Markov Models, a larger database is needed for the training, and possibly the subjects should be classified according to some categories, such as ethnic background and gender8. The tests also showed that some emotions are greatly confused
as against others (anger, disgust, sadness and fear). To overcome the drawbacks of the previous work, we have tried to come up with a more efficient system, which is high level of accuracy for all types of emotions. Our system uses best technique for pre-processing, extraction and classification and as we have made use of single technique in each step of emotion recognition, the computational time is reduced and complexity also9.
4. Contributions of the proposed work
The construction of a program to recognize emotion from brain activity, with the help of EEG signals.
4.1 Optimum memory usage.
The provided method is equivalent to their best offline counterparts, which have unlimited resources at hand and arbitrary access to all elements.
4.2 Efficient processing of data stream.
In order to keep pace with transient and volatile data streams, an analysis technique meets the following stringent processing requirements:
Each element is processed only once. The per-element processing time is constant. The amount of allocated memory is constant. Classification and extracting features using ANN.
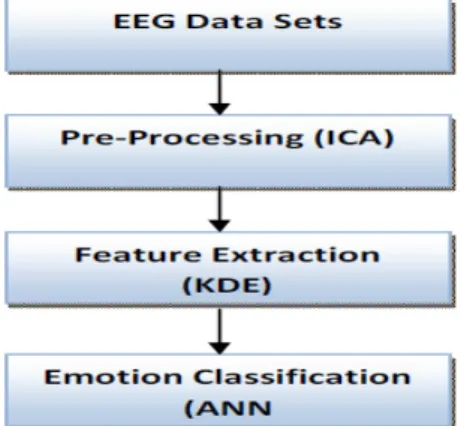
5. Architecture of the proposed system
The Architecture of the proposed system consists of two parts. The first part is for training the system. Moreover, the system gives the relationship between the EEG signals and emotion. This is done automatically, by the training part. This process does only have to be run once, since the system will then be able to recognize emotion from new EEG signals. The other part shows the normal execution of the system. This part does exactly the same pre-processing and feature extraction steps as the training part. After the feature extraction, it will use the relationships extracted in the training phase to classify the EEG signals into emotions.
Fig 1.Architecture of proposed system
5.1 Input
The input to the system consists of measured EEG signals from the scalp of the various subjects.
5.2 Different process used are:
5.2.1 Independent Component Analysis (ICA)
It is a statistical procedure used for splitting up a set of mixed signals into its sources .ICA considers that the observed EEG signal is a mixture of several source signals coming from multiple activities. ICA therefore expresses the resulting EEG signal x (t) in relation to their sources s (t) as:
The resulting EEG signal is as:
Where, =any unknown mixer function = an additive random noise vector = source of signal
= output vector
The dimension of output vector is equal to the number of measured data channels. The whole ICA problem consists in the calculation of the un mixing function by inverting f and obtaining an estimation of , by mapping
to the source space.
ICA is divided into two different models based on . These models may be a linear or nonlinear function. The nonlinear problem is usually too complex and generally intractable due to its high number of in determinations. It is possible to rewrite it as a matrix multiplication where A is the mixing matrix.
Linear ICA model equation:
Noise can be removed from above equation by assuming that the observed data is noiseless or that the noise is too weak for consideration. Finally, and are obtained from by using Infomax algorithm. ICA has been proven to be a powerful and robust tool for artifact removal in signal analysis.
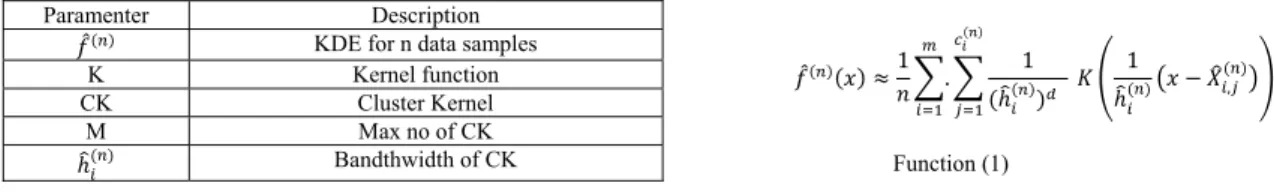
5.2.2 Kernel Density Estimation (KDE)
using kernel-smoothing method12. The probability kernel density estimation n function (1) is given below, where
k(x) is symmetric function that integrates to 1 and h>0 is the kernel smoother parameter also called bandwidth which is a statistical technique for estimating a real valued function by using its noisy observations. The estimated result is smooth, and the level of smoothness is decided only by a single parameter13.
Function (1)
The benefits of kernel density estimation highly recommend its adaptation to data streams as the resulting estimate gives a comprehensive statistical model of the distribution described by the stream data.
6. Artificial Neural Network (ANN)
An artificial neural network is made-up of many artificial neurons which are linked together according to specific network architecture. The aim of the neural network is to transform the inputs into meaningful outputs to match the specific target values as closely as possible4. An ANN is defined by three types of parameters: The interconnection
pattern between the different layers of neurons, learning process for updating the weights of the interconnections and activation function that converts a neuron's weighted input to its output activation5.
In ANN, the number of neurons in the input layer and hidden layers varies according to the feature types used, whereas the number of neurons in the output layer is nothing but the four emotional states.
7. Data Sets
In order to validate these techniques, it is crucial to follow different real-world data streams. Because of this, we have used a variety of heterogeneous one-dimensional data streams from the time-series archive of the University of California Riverside. The streams originate from diverse fields like facility monitoring, networking, and medicine and exhibit different characteristics, e.g., noisy/smooth, stationary / non stationary, and autocorrelation. We additionally included a synthetic data set, called CLAW, whose density is a mixture of Gaussian densities.
8. Results
The implementation of KDE and proposed KDE compasison is shown in Fig. 2 shows as x-axis shows the total number of EEG data samples to be processed & y-axis shows MSE. With these techniques, we continuously computed density estimates and compared them with the best offline KDEs. More precisely, we compared them in terms of the MSE, which we computed each 500 processed elements.
Fig 2.MSE analysis with KDE & KDEP
The Fig 3 shows that Proposed KDE algorithms mininmun and continues decrease in MSE than KDE algorithms.
Kernel Density Estimation graph comparisons shows that smoothness of OKDE is good than KDE_OVR
Paramenter Description
KDE for n data samples
K Kernel function
CK Cluster Kernel
M Max no of CK
Fig 3.KDE Analysis graph with OKDE & KDEP for EEG data stream
The fig. 4 shows the comparison between optimun KDE & KDEP as x-axis shows the total number of samples to be processed & y-axis shows MSE. The MSE is continuously decreases by Proposed KDE method.
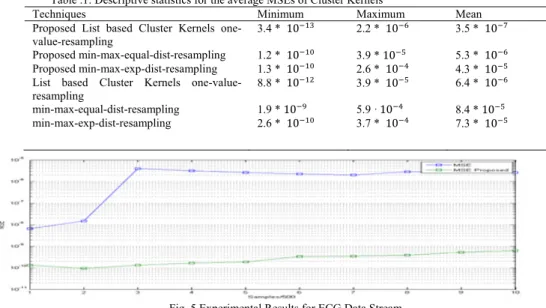
Fig 4. KDE Comparison Graph of EEG data stream Optimum KDEP & KDEP_OVR. Table .1: Descriptive statistics for the average MSEs of Cluster Kernels
Techniques Minimum Maximum Mean
Proposed List based Cluster Kernels one-value-resampling
3.4 * 2.2 * 3.5 * Proposed min-max-equal-dist-resampling 1.2 * 3.9 * 5.3 * Proposed min-max-exp-dist-resampling 1.3 * 2.6 * 4.3 * List based Cluster Kernels
one-value-resampling 8.8 * 3.9 * 6.4 *
min-max-equal-dist-resampling 1.9 * 5.9 · 8.4 * min-max-exp-dist-resampling 2.6 * 3.7 * 7.3 *
Fig .5 Experimental Results for ECG Data Stream
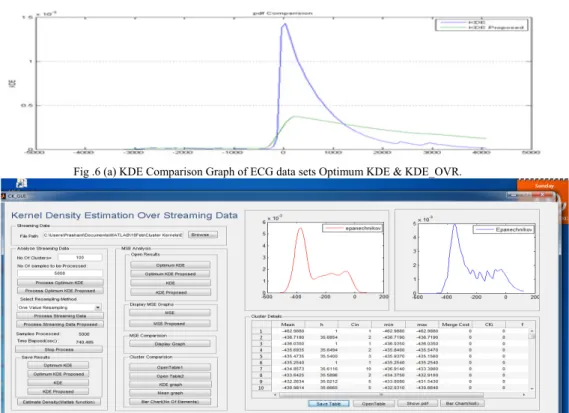
In graph Fig 6 (a) & Fig 6 (b) we see that when proposed method of KDE was used the mean square error (MSE) and uniform clustering is done. The above graph displays Cluster Kernel variants after processing the complete stream as well as the best offline KDE for this stream for EEG brain signal & ECG Heart Rate stream. The implementation of Cluster Kernels using mean-resampling and Min-Max resampling with equal distances and exponential distances respectively.
Fig .6 (a) KDE Comparison Graph of ECG data sets Optimum KDE & KDE_OVR.
Fig .6 (b) Kernel Density Estimation over streaming Data
8. Future work
Different participants may have different things on their mind. Even though people are triggered to experience some emotion, their brain activity may be still very much influenced by other thoughts and brain processes. We can use music or video data to trigger the emotions in the person's brain10, 11.
Some other techniques can be used to perform better on noise removal or artifact removal. Better features extraction And classification techniques can also be employed in future. System can be extended to implement some applications like Brain Computer Interface, Mental State detection, Controlling devices, automatic music player control depending upon person’s emotions, etc.
Conclusions
The proposed work provides a better view in understanding the emotion recognition using EEG signals. We have used the EEG technique gives better results of EEG for signal acquisition, ICA for signal enhancement, Kernel Density Function (KDE) in feature extraction and finally we propose Artificial Neural Network (ANN) Classifier for classification to get the emotional state. In experimental results, it is observed that KDE enhanced algorithm allows online computation of KDE and gives better results for clustering of EEG and ECG data stream. MSE analysis of the results of the algorithm shows gradual decline in MSE. KDE provides low processing cost and combines heterogeneous real- world data stream like EEG, ECG data streams.
References
1. A. Choppin, “EEG-based human interface for disabled individuals: Emotion expression with neural networks”, Tokyo Institure of Technology, 2000.
2. T. Musha, Y Terasaki, H.A. Haque, and G.A. Ivanitsky, “Feature extraction from EEGs associated with emotions”, Artificial Life and Robotics, 1(1):15-19, 1997.
3. K. Ishinoand, M. Hagiwara, “A feeling estimation system using a simple electroencephalograph,” in Proc. IEEE Int. Conf. Syst., Man Cybern., vol. 5, pp. 4204– 4209. (2003)
4. A. Heraz, R. Razaki, and C. Frasson, “Using machine learning to predict learner emotional state from brainwaves,” in Proc. 7th IEEE Int. Conf. Adv. Learning Technol., pp. 853–857,2007.
5. G. Chanel, J. J. M. Kierkels, M. Soleymani, and T. Pun, “Short-term emotion assessment in a recall paradigm,” Int. J. Human-Comput. Stud., vol. 67, no. 8, pp. 607– 627, Aug. 2009.
6. Q. Zhang and M. H. Lee, “Analysis of positive and negative emotions in natural scene using brain activity and GIST,” Neurocomputing, vol. 72, no. 4–6, pp. 1302– 1306, Jan. 2009.
7. Lin, Y.-P., Wang, C.-H., Jung, T.-P., Wu, T.-L., Jeng, S.-K., Duann, J.-R., Chen, J.-H.: “EEG-Based Emotion Recognition in Music Listening”. IEEE Transactions on Biomedical Engineering ,57(7), 2010.
8. K.H. Kim, S.W. Bang, and S.R. Kim, “Emotion recognition system using short term monitoring of physiological signals”. Medical and Biological Engineering and Computing, 42:419-427, 2004.
9. M.B. Kostyunina and M.A. Kulikov. “Frequency characteristics of EEG spectra in the emotions”. Neuroscience and Behavioural Physiology, 26(4):340-343, 1996.
10. C.M. Krause, V. Viemero, A. Rosenqvist, L. Sillanmaki, and T. Astrom, “Relative electroencephalographic desynchronization and synchronization in humans to emotional film content: an analysis of the 4-6, 6-8, 8-10, and 10-12 hz frequency bands”. Neuroscience letters, 286(1):9-11, 2000.
11. F.C. Murphy, I. Nimmo-Smith, and A.D. Lawrence, “Functional neuroanatomy of emotions: A meta-analysis”. Cognitive, Affective & Behavioral Neuroscience, 3:207-233, 2003.
12. C. Heinz and B. Seeger, "Resource-Aware Kernel Density Estimators over Streaming Data," Proc. 15th ACM Int',l Conf. Information and Knowledge Management, 2006.