University of Wollongong
Research Online
Faculty of Science, Medicine and Health - Papers
Faculty of Science, Medicine and Health
2015
Measuring data quality through a source data
verification audit in a clinical research setting
Lauren Houston
University of Wollongong, [email protected]
Yasmine Probst
University of Wollongong, [email protected]
Allison Martin
University of Wollongong, [email protected]
Research Online is the open access institutional repository for the University of Wollongong. For further information contact the UOW Library: [email protected]
Publication Details
Houston, L., Probst, Y. & Martin, A. (2015). Measuring data quality through a source data verification audit in a clinical research setting. Studies in Health Technology and Informatics, 214 107-113.
Measuring data quality through a source data verification audit in a clinical
research setting
Abstract
Health data has long been scrutinised in relation to data quality and integrity problems. Currently, no
internationally accepted or "gold standard" method exists measuring data quality and error rates within
datasets. We conducted a source data verification (SDV) audit on a prospective clinical trial dataset. An audit
plan was applied to conduct 100% manual verification checks on a 10% random sample of participant files. A
quality assurance rule was developed, whereby if >5% of data variables were incorrect a second 10% random
sample would be extracted from the trial data set. Error was coded: correct, incorrect (valid or invalid), not
recorded or not entered. Audit-1 had a total error of 33% and audit-2 36%. The physiological section was the
only audit section to have <5% error. Data not recorded to case report forms had the greatest impact on error
calculations. A significant association (p=0.00) was found between audit-1 and audit-2 and whether or not
data was deemed correct or incorrect. Our study developed a straightforward method to perform a SDV audit.
An audit rule was identified and error coding was implemented. Findings demonstrate that monitoring data
quality by a SDV audit can identify data quality and integrity issues within clinical research settings allowing
quality improvement to be made. The authors suggest this approach be implemented for future research.
Disciplines
Medicine and Health Sciences | Social and Behavioral Sciences
Publication Details
Houston, L., Probst, Y. & Martin, A. (2015). Measuring data quality through a source data verification audit in
a clinical research setting. Studies in Health Technology and Informatics, 214 107-113.
Measuring Data Quality hrough a Source
Data Verification Audit in a Clinical
Research Setting
Lauren HOUSTON, Yasmine PROBST and Allison HUMPHRIES School of Medicine, Faculty of Science, Medicine and Health,
University of Wollongong, Australia
Abstract. Health data has long been scrutinised in relation to data quality and integrity problems. Currently, no internationally accepted or “gold standard”
method exists measuring data quality and error rates within datasets. We conducted a source data verification (SDV) audit on a prospective clinical trial dataset. An audit plan was applied to conduct 100% manual verification checks on a 10% random sample of participant files. A quality assurance rule was developed, whereby if >5% of data variables were incorrect a second 10% random sample would be extracted from the trial data set. Error was coded: correct, incorrect (valid or invalid), not recorded or not entered. Audit-1 had a total error of 33% and audit-2 36%. The physiological section was the only audit section to have <5% error. Data not recorded to case report forms had the greatest impact on error calculations. A significant association (p=0.00) was found between audit-1 and audit-2 and whether or not data was deemed correct or incorrect. Our study developed a straightforward method to perform a SDV audit. An audit rule was identified and error coding was implemented. Findings demonstrate that monitoring data quality by a SDV audit can identify data quality and integrity issues within clinical research settings allowing quality improvement to be made. The authors suggest this approach be implemented for future research.
Keywords. Source data verification, data quality, quality assurance, clinical trial
Introduction
High quality data and effective data evaluation are crucial within clinical research as conclusions and recommendations rely largely on the outcomes of data. It is estimated an average of 976 errors (~10%) per 10 000 data points exist from transfer of source data to electronic data records [1,2]. Health data has long been scrutinised in relation to data quality and integrity problems [3,4]. To ensure data quality is an integral component of clinical trials best practice recommends personnel training, standard operating procedures (SOPs), and data monitoring are required to avoid scientific misconduct and assure compliance with the International Conference on Harmonisation (ICH) Good Clinical Practice (GCP) guidelines [5].
Currently no internationally accepted or “gold standard” method exists to measure data quality and error rates within datasets. Dissimilarities between methods make it
difficult to determine “acceptable” data quality. Data entry errors may introduce bias
risking misleading and/or false results [2,6]. Multiple issues such as error type, extent and variables where errors are found, play an important role in the statistical analyses
T
Driving Reform: Digital Health is Everyone’s Business A. Georgiou et al. (Eds.)
© 2015 The authors and IOS Press.
This article is published online with Open Access by IOS Press and distributed under the terms of the Creative Commons Attribution Non-Commercial License.
doi:10.3233/978-1-61499-558-6-107
in determining data quality [7]. Through the use of routine verification checks, transcription errors can be detected [8].
Auditing is a recognised method used for centuries to assess and develop the quality of products, services and information [9-11]. An auditor’s role is to validate data collected on source documents against data entered into electronic records and/or databases. Medical audits are employed to detect and evaluate patient care, services and documented discrepancies [12,13]. Quality assurance audits within clinical settings are an extensively used process recognised to ensure high quality data is produced [1,2,7,14-16]. Many organisations collect and analyse data for the benefit of their own research for quality control and SOPs. Unpublished audit methods and their subsequent results leave a gap within the published literature.
Source data verification (SDV) is the process of comparing source data (original or certified copy) documents to data recorded or entered to a case report form (CRF), electronic record or database. Data integrity can be ensured through different data monitoring techniques, including logic, consistency and range checks, which are useful for determining major errors that are “out-of-the-ordinary”. SDV is considered a more
accurate method, because it identifies all major and minor errors. Minor errors may seem insignificant, however, consistent minor errors add up and potentially lead to low quality data. Therefore, the aim of this research was to monitor data quality through the use of SDV audits to ensure data integrity within a clinical research setting.
1.Methods
1.1.Planning and Procedure of Data Audit
A SDV audit was performed on baseline data of a prospective clinical trial dataset to determine data quality. Audits occurred between September 2014 and February 2015 at the University of Wollongong and the Illawarra Health and Medical Research Institute (IHMRI). One auditor conducted the audit to ensure consistency. Consensus with the research team on points of uncertainty was conducted prior to commencing.
Paper, handwritten CRFs were used as the source document to collect and store participant information during trial consultations. A team of five clinical Accredited Practising Dietitians transcribed data from CRFs into an electronic spreadsheet record (ESR). To limit bias the SDV audit was blinded from the participating clinical dietitians. A pre-test, post-test style of audit was applied across this research related to a quality improvement framework.
An audit plan was applied to conduct 100% manual verification checks on a 10% random sample of participant files. Verification of original source documents was conducted to determine data quality [17]. During audits, comparison between source documents to data listings entered into the ESR were made. A quality assurance rule was developed, whereby if >5% of data variables were incorrect a second 10% random sample (excluding files already sampled) would be extracted from the data set. A researcher independent of the SDV extracted a 10% random sample of enrolled study participants using SPSS software (version 22 2013, IBM Australia, Lane Cove, NSW, Australia). This approach was based on a monitoring plan by the Acute Respiratory Distress Syndrome (ARDS) network, a National Institute of Health-sponsored clinical trial [1], where a 10% random sample of participants were extracted for review to confirm eligibility and validation of all erroneous data point incidents.
L. Houston et al. / Measuring Data Quality Through a Source Data Verification Audit 108
For audit-1 conducted on 1st October 2014, 21 files containing CRFs were extracted from filing cabinets and scanned. A snapshot of the data was taken the same day CRFs were scanned to ensure no changes were made to the ESR during the audit period reducing the risk of introduced bias. The audit was segmented into three relevant sections: anthropometric, physiological and medication data. Sections were determined in relation to the relevant source documents and time-points used for data collection. Each individual data point recorded in the CRF of the above sections was considered. Audit outcomes were coded and recorded into a separate ESR for analysis. Due to audit-1 findings (>5% error rate) in two of three sections, audit-2 was completed on anthropometric and medication data only. Audit-2 commenced on 15th December 2014 and the same procedure for audit-1 was applied. Participants included in audit-1 were excluded from audit-2. Recommendations for continuous quality improvement (CQI) within the context of each dataset were made to ensure future data integrity during the trial.
1.2.Error Classification
During the audit process, data points were categorised using standard audit codes derived from the European Organisation for the Research and Treatment of Cancer (EORTC) [18]. Audited data was coded: Correct (code 1) – Data values entered to the ESR match the values recorded on CRF; Valid incorrect (code 2) – Minor error discrepancies where data had been transcribed incorrectly but had no direct impact on the studies outcome. E.g. values incorrectly rounded to the nearest integer, values entered incorrectly which fell within a predetermined range or incorrectly spelt medications; Invalid incorrect (code 3) – Major errors discrepancies were data that had been transcribed incorrectly that the auditor considered clinically significant. E.g. Missing documents or values entered incorrectly which fell outside a predetermined range; Not recorded (code 4) – Data not recorded on CRF but values exist in ESR; Not entered (code 5) – Data recorded on CRF however had been missed and left blank when entered to ESR.
1.3.Statistical Analysis
To examine data quality and integrity, the total error rate was calculated by dividing erroneous data points (code 2,3,4) by total data points (code 1,2,3,4). Data not entered was excluded from the error calculation, as data not entered was not deemed incorrect. Chi square analyses were used to examine any potential associations between audit-1 and audit-2 and whether data was correct or incorrect.
Data was analysed using SPSS (version 22) statistical analysis software.Statistical significance was set at p<0.05. This study was approved by the University of Wollongong Human Research Ethics Committee.
2.Results
A total of 42 randomly selected participant CRFs were extracted for audit-1 (n=21) and audit-2 (n=21). A total of 1505 data points were audited, 958 correct, 20 valid incorrect, 55 invalid incorrect, 260 not recorded and 212 not entered. Of the 212 data points not entered, 44% were from the anthropometric, 1% physiological and 55% medications L. Houston et al. / Measuring Data Quality Through a Source Data Verification Audit 109
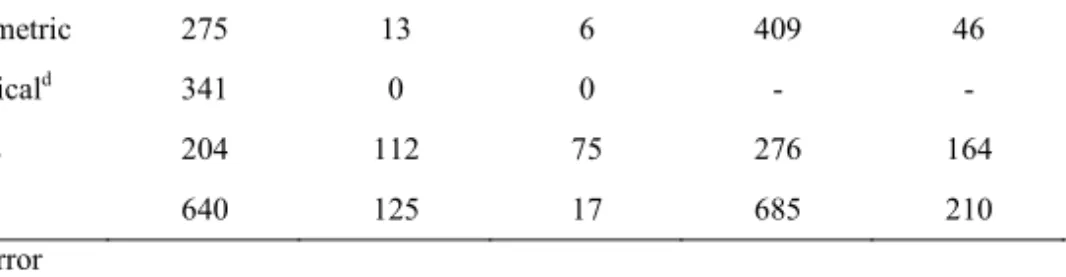
data sections of the two audits. Both audit-1 and 2, not recorded data had the greatest contribution to total error rate, 33% and 44%, respectively. Table 1 shows the number of variables audited at audit-1 and 2 and error rate for each section.
Table 1. Audited sections and the percent of erroneous data during audit-1 and 2 for each section.
Audit-1 Audit-2
Audit section Na N
Errb % Errc N Nerr %Err
Anthropometric 275 13 6 409 46 13 Physiologicald 341 0 0 - - - Medicines 204 112 75 276 164 77 Total 640 125 17 685 210 36 Err: Error a
Count of data points (N) (code 1,2,3,4,5)
b Count of data erroneous data (Nerr) (code 2,3,4)
c Percent of erroneous data (code 2,3,4 divided by code 1,2,3,4,)
d Physiological audit section did not complete audit-2 due to QA rule (<5% error rate from audit-1)
Error rates ranged from 0-77% within the three audited sections. All audited data records within the physiological section were correct, therefore, the error was <5%, a second audit was not deemed necessary. Anthropometric data error more than doubled, increasing by 7% and medications data error increased by 2%. The medications section had the largest error >75%. Total error more than doubled (17% versus 36%) when comparing audits. Audit-1 and 2 had similar error rates when the physiological data section was excluded, with 33% and 36% error rate, respectively. Exclusion of physiological data from audit-1 increased overall error by 16%.
Chi squared analysis results found significant association between audit-1 and audit-2 and whether or not data was correct or incorrect: χ2 (4, 1293) = 672.405, p =
0.00. The proportion of correct audit-1 data was significantly related to the proportion of correct audit-2 data. According to these results, 74% of data was deemed correct and 26% was deemed incorrect when combing the results of audit-1 and audit-2.
3.Discussion
Limited published literature exists on the method used for SDV audits and the success of detecting systematic and random errors. Our study developed and applied a straightforward method to perform a SDV audit. An audit rule was identified and error coding was implemented, a process easy to replicate for future research. The error classification method for coding data is consistent with other studies [1,18,19]. Examining the heterogeneity of error coding and what the literature classifies as an error differs. A definition to determine data quality and error within published literature is warranted.
Our finding that >30% of total error in both audits indicates the importance of a SDV audit for identifying error. The proportion of error trended upward as length of study increased, which is consistent with the Duke Clinical Research Institute [7].
L. Houston et al. / Measuring Data Quality Through a Source Data Verification Audit 110
However, completing multiple audits throughout the length of the study and providing CQI can improve data quality and integrity. It is accepted in published literature that if >10% of a dataset is erroneous, the data be considered unreliable [20]. A 5% quality assurance rule was selected within this research setting. This study had five data entry personnel and a relatively small dataset conducted at a single-site, therefore, expectations for quality of data was high. Within audit-1 physiological data was the only section to have an error rate <5%, as data for this section was electronically generated; therefore, not recorded data had no impact on error calculation. Anthropometric and medicines data sections increased in error recording a total error >10% for audit-2. Greater error rate could be due to data obtained through ‘participant recall’, which is subjective to communication and memory.
In tightly regulated prospective clinical trials most databases have a lower acceptance criteria of 0.5% error [7]. However, in a clinical research setting, the average error rate of a source-to-database audit is roughly 10% [1,19]. Duda et al. [19] reported on having an error >10% ranging from 2% to 34% across seven different audit sites. Similarly, the EROTC study [18] found across 15 centers correct data ranged from 78-98% finding data quality was influenced by training and knowledge of data management and those entering data. In comparison to findings in this study, the percentage of error ranged within different data sections of the audit and an increase in error could be due to five different personnel reporting, recording and entering data. Conflicting with previous research Nahm, Pieper and Cunningham [2] took a holistic approach to assess data quality and found a significant decrease of 4% when verifying source-to-database. Within the literature, there are inconsistent findings regarding
“acceptable” error rates. Therefore, a standardised method for SDV audits needs to be
recognised.
After reviewing the limited published literature we believe a 5% error rate within
electronic datasets should be the “gold standard” for determining data quality within a
clinical setting and believe a 10% error rate published within multiple studies is too large to draw on reliable and valid results. Errors vary depending on the type of dataset, and a 10% error rate may be more acceptable for manually transcribed data.
This study’s results are limited to the University of Wollongong and IHMRI and development of clinical trial operations. Audit results are subject to variations in procedure and disclaimer of trials design. Audits results presented here are limited to source-to-ESR audits and from the authors’ understanding this is the first of it’s kind
within published literature. Based on our experience with an audit methodology and rule, the use of different error coding and variations in method design for calculating error rates vary widely across the industry. One auditor completed the audit process and results are limited to their knowledge and critique. Knowledge and experience was gained throughout the audit process. Hence, audit-2 may be more likely to uncover errors when compared to audit-1. Only a 10% random sample of participant records was audited and a true error rate may differ from the estimated error rate reported in this paper.
The SDV audit allowed for identification of weaknesses within the data recording, collection and storing process and how these can be resolved before erroneous data can cause problems within results. It is recommended a CQI cycle framework is developed to plan, do, check and act on erroneous data points. Conducting an educational training workshop focusing on the importance of data collection and entry highlights the significance of data quality to data entry personnel, and research team. Standardised procedures are required to structure CRFs to ensure consistent documentation is L. Houston et al. / Measuring Data Quality Through a Source Data Verification Audit 111
produced. Double-checking and revising 100% of data points entered to the ESR before a third SDV audit aims to maximise quality assurance. Future research should focus on implementing a more standardised method of SDV audits.
4.Conclusion
The findings of this study demonstrate that monitoring data quality through the use of a SDV audit can identify data quality and integrity issues within a clinical research setting. The study has developed a simple yet effective method that can be employed to determine error within a dataset. This can be applied not only to clinical research but also to all data quality assurance studies.
References
[1] M. Mealer et al., Remote Source Document Verification in Two National Clinical Trials Networks: A Pilot Study, PLoS One, 8 (2013), e81890
[2] M.L. Nahm, C.F. Pieper and M.M. Cunningham, Quantifying Data Quality for Clinical Trials Using Electronic Data Capture, PLoS One, 3 (2008), e3049
[3] Y.W. Lee et al., Journey of Data Quality, MA:MIT Press, Cambridge 2006
[4] M.N. Zozus et al., Assessing Data Quality for Healthcare Systems Data Used in Clinical Research (version 1.0), National Institutes of Health (NIH) Health Care Systems research Collaboration, 2014; Available from: http://sites.duke.edu/rethinkingclinicaltrials/assessing-data-quality/
[5] International Conference on Harmonisation. Harmonisation. Harmonized Triparitite Guideline: Guideline for Good Clinical Practice, 1996; Available from: http:www.ich.org/cache/compo/276-254-1.html
[6] C. Baigent et al., Ensuring trial validity by data quality assurance and diversification of monitoring methods, Clinical Trials (London England), 5 (2008), 49-55
[7] R. Rostami, M. Nahm, C.F. Pieper, What can we learn from a decade of database audits? The Duke Clinical Research Institute experience, 1997—2006, Clinical Trials (London, England), 6 (2009), 141-150
[8] R.V. Gómez-Rioja et al., Current status of verification practices in clinical biochemistry in Spain,
Clinical Chemistry And Laboratory Medicine: CCLM / FESCC, 51 (2013), 1739-1746
[9] G.J. Kuperman et al., Developing data content specifications for the Nationwide Health Information Network Trial Implementations, Journal of the American Medical Informatics Association, 17 (2010), 6-12
[10] T. Luukkonen et al., The measurement of international scientific collaboration, Scientometrics, 28
(1993), 15-36
[11] S.N. Duda, F.H. Wehbe and C.S. Gadd, Desiderata for a Computer-Assisted Audit Tool for Clinical Data Source Verification Audits, Studies in health technology and informatics,160 (2010), 894 [12] C.S. Wagner and L. Leydesdorff, Mapping the network of global science: comparing international
co-authorships from 1990 to 2000, Internation Journal of Technology and Globalisation, 1 (2005), 185-208
[13] M. McKee, Routine data: a resource for clinical audit? Quality Health Care, 2 (1993), 104-111 [14] Centre for Clinical Governance Research in Health (CCGR), Clinical audit: a comprehensive review of
the literature, Faculty of Medicine, University of New South Wales, Sydney Australia, 2009; Available from:
http://www.health.vic.gov.au/clinicalengagement/downloads/pasp/literature_review_clinical_audit.pdf [15] N. Dixon and M. Pearce, Guide to Ensuring Data Quality in Clinical Trials, Healthcare Quality
Improvement Partnership, 2010; Available form: http://www.hqip.org.uk/assets/LQIT-uploads/Guide-to-ensuring-data-quality-in-clinical-audits-8-Sep-10.pdf
[16] R.C. Macefield, A.D. Beswick, J.M. Blazeby and J.A. Lane, A systematic review of on-site monitoring methods for health-care randomised controlled trials, Clinical Trials (London, England), 10 (2013), 104-124.
L. Houston et al. / Measuring Data Quality Through a Source Data Verification Audit 112
[17] World Health Organisation (WHO) Regional Office for the Western Pacifica, Improving Data Quality A guide for developing countries, 2003; Available at: http://www.wpro.who.int/publications/docs/ Improving_Data_Quality.pdf
[18] K. Vantongelen, N. Rotmensz and E. Van Der Schueren, Quality Control of Validity of Data Collected in Clinical Trials, European Journal of Cancer and Clinical Oncology, 25 (1989), 1241-1247
[19] S. N. Duda et al., Measuring the Quality of Observational Study Data in an International HIV research Network, PLoS One, 7 (2012), e33908
[20] D.R. Clarke, Verification of data in congenital cardiac surgery, Cardiology in the Young, 18 (2008), 177-187