Q
UANTITATIVE
F
INANCE
R
ESEARCH
C
ENTRE
Research Paper 180 July 2006
DMA Trading and Crossings
on the Australian Stock Exchange
Vladimir Kazakov and Tom Vasak
QUANTITATIVE FINANCE
RESEARCH CENTRE
�������������������� ���������������DMA Trading and Crossings
on the Australian Stock Exchange
Vladimir Kazakov
¹
and Tom Vasak
²
Abstract
The feature that differentiates the Australian Stock Exchange (ASX) from all other markets is the unique set of rules that govern crossings – internal trades between two clients of the same broker. The recent rise of the low-margin direct market access (DMA) trading has created new interest for the use of crossing. In this paper we discuss the use of crossings on the ASX, its benefits, risks and costs. We identify stock properties that determine these benefits and risks. We estimate these properties from the historic data.
¹ UTS, vladimir.kazakov@uts.edu.au
1. Introduction
Qualitative benefits of internalisation are well-known – reduced market impact and volatility, faster execution and price improvement. Internalisation has been quite widely studied in the electronic US markets where brokers can divert flows to ECN markets where crossing usually takes place generally at the mid-price of best bid/ask spread. There is no compulsion for brokers to trade through the exchange on which the security is listed or even to report the trade to that exchange. Furthermore the execution fees for any trades matched on an ECN will typically be at a discount to having executed through the listing exchange.
In comparison, the Australian market is considerably more regulated in that crossings need to take place in accordance with a rigid set of ASX business rules. For parcels of stock with a value of under $AU1m, these must be crossed via an on-market crossing. Crossings in excess of this value can be executed as an off-market crossing and are subject to less onerous rules – they can be transacted at any price and other off-market participants cannot interfere in their transaction1. This paper will constrain its discussion exclusively to
on-market crossings.
The current interest in use of crossing is the direct result of the recent increase in the DMA trading. DMA orders submitted to the broker by electronic means from the buy side and are routed with the lowest latency possible into the market. It allows the buy side to have almost complete control over the trading of their orders in the market. DMA as a percentage of total broker order flow is growing steadily. In the US, DMA accounted for somewhere between 33% and 39% (as of 2004) of all activity [1,3] and in Australia, it is 7% [2] and growing steadily. Typically the broker provides the buy side with a fast electronic pipe into the market. The broker does not interact with the order flow other than to perform a range of compliance checks than ensure that the orderly conduct of the market is maintained. The buy side pays a significantly discounted brokerage fee.
The growth of DMA at the expense of traditional full service broking is eroding broker profit margins. One possible way for brokers to compensate for this is to leverage this flow by crossing it against
complementary order flows. Unlike conventional order flow that has no real latency constraints, speed to market is critical for DMA platforms to support buy-side algorithmic trading strategies. This means that the ability for the broker to leverage the full value of the DMA flow by being able to cross other agency flow against it is very difficult. The only way to derive additional value from this flow is through the use of a very high speed fully automated crossing program.
The aims of this paper are to
(a) Determine the risks and benefits of crossing orders on the ASX
(b) Find factors that determine these risks and benefits and then estimate them from trading data. (c) Estimate risks and benefits for different stocks and intra-day periods.
2. Definitions
There are two types of on-market crossings that can be transacted.
The first type is where a broker enters an order that, due to normal order priority, matches one of the broker’s own pre-existing orders already in the market. Such a crossing can occur either intentionally or accidentally. If the order that matches the broker’s pre-existing order is placed intentionally, ASX business rules dictate that the pre-existing order had to be in the market at the current price for at least 10 seconds. If the order that matches the broker’s pre-existing order is placed as a result of client-originated DMA flow, this 10 second rule is waived.
1 Consequently off-market trades are typically not included in the calculation of the value-weighted average
The other type of crossing is called a priority crossing. Here the broker submits a cross order to the market which consists of two complementary buy/sell orders at the specified crossing price. It is intended that these orders execute against each other if circumstances permit. One of these orders can be thought of as the market order (crosses the prevailing spread), while the other is a limit order (does not cross the spread). In the context of the DMA trading, the market order is typically a DMA order while the limit order is an order from the broker’s internal liquidity pool. An alternative nomenclature is to refer to the market order as the active side while the limit order is termed the passive side. Crossing order receives time priority at the crossing price ahead of all the other orders, already waiting in the book. However, any orders at a better price than the crossing price will be executed before the crossing orders. Crossing engine uses such time-priority suppressing on-market crossings to transact in the market. In the remainder of the paper, we shall refer to an on-market priority crossing simply as a crossing.
ASX Market Rule 17.2.4 imposes a condition that a so-called “crossing market” (where the bid-ask spread of the security is a single price step has been in place for at least 10 seconds) before a priority crossing can be executed. This is known as the ACE rule:
• Appear at the crossing price (have a quote at this price);
• Create a crossing market; and
• Execute the crossing.
If broker wants to cross two orders and spread is wider than the minimal price step, then he submits a dummy order (typically one share order) one price step from the bid or ask and waits 10 sec to see if crossing market will be established. If spread widens again before 10 sec ends, then he may choose to try again or abandon the crossing attempt. The frequent use of one share orders on the ASX is the direct consequence of this unique microstructure rule.
3. Pools of Liquidity
There are two logical pools of liquidity available to the broker. One is the broker’s internal liquidity pool of orders being worked over the day. This is termed just as the Liquidity Pool. The other pool is the set of broker’s limit orders currently sitting in the market’s order book.
4. Crossing Benefits
4.1 Immediacy for liquidity supplier
When the broker decides to cross two orders, he checks if a crossing market exists. If it does then the crossing order at the best book price will result in immediate trade between limit and market order components of the crossing, ahead of all the other orders in the book. If spread widens by the time the crossing order is received, then the crossing fails and its liquidity (both components) are returned to the broker without exposing it to the market.
4.2 Better price or higher volume at the same price for market order side
When the crossing price is not the current best bid or best ask price, then price priority intervenes. The market order side of the cross first executes all orders in the market’s limit order book at a better price, and then crosses its residual volume against its limit order side. Suppose a crossing market exists, the broker has liquidity he is prepared to trade at the second best book price and which he does not want to show to the market, and he also has a market order with the quantity exceeding all quantity at the first and second price levels in the book. If he submitted this market order directly into the market then it would "walk up" the book, trading partially at first, second and third best prices. If the cross order at the second best book price is submitted which consists of the same market order and of a limit order for the quantity equal to the market order’s quantity minus best price quantity in the book, then the market order will be partially traded against book’s liquidity at best price and its residual will be traded against limit side of the cross. Here again liquidity will not be shown to the market before trade occurs or if it fails, and this liquidity will be traded ahead of all orders already waiting execution at the second best price. Thus, the market order side of
the cross obtains better price that if it would if traded directly in the market. Limit order side traded more volume without disclosing it if cross fails to execute. Thus, the cross can be constructed with market side volume larger than the limit book side’s volume, to rely on time priority to execute its market side volume partly against market’s limit book and partially against broker’s liquidity pool.
To summarize, the benefits of crossing in comparison to the direct on-market execution are:
1. Market order side of the cross may get better price and may make lesser price impact if crossing price is different from the current best bid/ask price;
2. Market order side of the cross may get to trade more volume at the same price.
3. Limit order side may be able to trade immediately and still collect the spread, and be able to conceal liquidity from the market in cross fails.
4. Limit order side may be able to transact faster.
5. Limit order side may get to trade more volume at the same price over the same period. 5. Crossing Risks
5.1 Under-execution of the limit order side
If the crossing price is worse than the best bid or the best ask then the broker needs to know the depths at all price levels below the crossing price in order to achieve execution he planned, which includes trade of all volume in the limit order side against a part of the volume in market order side of the cross. The necessary condition for the predicted and achieved execution being the same (including predicted and achieved prices being the same) is the state of the limit order book when crossing order is transacted being the same as broker assumed it to be when he formulated the crossing.
It is possible that when a crossing order is transacted, then this depth is larger, that is, the limit book contains more limit orders from other brokers priced better than the crossing price than it had when this crossing order was constructed. The crossing order then will transact more volume from other brokers and less broker’s own volume of the limit side than it was planned. Theoretically this could happen extremely rarely, when another broker happens to submit his order during short time window between submission of the cross and its transaction. In practice, various delays in SEATS engine operations/ communications may result in the broker observing a slightly out-of-date state of the market’s limit order book. Therefore, the information about book depths used to plan the crossing order execution can be inaccurate resulting in under execution on the limit side much more frequently than in the ideal system with instantaneous communications/ transactions and no errors/ delays.
Another factor that prevents the broker from finding the true depth is the appearance of orders with hidden volume in the book – undisclosed orders (currently used on the ASX) and/or iceberg orders (to be
introduced by the ASX in its new ITS trading system in October 2006). It is known that hidden orders are widely used in other order-driven markets, e.g. on the NASDAQ, where hidden liquidity represents 20% of the inside depth on the 100 largest stocks [4][5], on Spanish Stock Exchange where 26% of all trades involve hidden volume [6], on Euronext Paris, the hidden depth represents 45% of the total depth at the five best quotes and 55% of the total depth at the best price [7]. This large scale use of hidden liquidity leads to the discrepancy between the pre-calculated crossing behavior using data from the observed limit order book and the actual achieved transaction prices for 37% of all orders submitted to Euronext, with average size of 0.86% [8].
It was reported [9] that in 1993, 6% of orders on the ASX with approximately 28% of the total volume where undisclosed. Subsequent increases in the threshold in 1994 and 1996 led to the reported decrease in the share of undisclosed orders by 32% for low cap stocks and by 9% for high cap stocks [10].
Our own analysis shows that currently the use of the undisclosed orders on the ASX has become so infrequent that it poses virtually no risk of under execution for crossing orders.
5.2 Over-execution on the limit order side
When crossings are transacted against limit orders already in the market, there is no explicit connection between the crossing limit order and the limit order in the market being crossed. The broker effectively submits an independent pair of orders when executing a crossing. The existing limit order that is notionally being crossed must be reduced or cancelled. It is possible that in times of high market activity that the crossing could be transacted successfully but the limit order that was logically crossed could also execute before it could be cancelled. In order to minimize the chance of over-execution, it might appear to be wise to first reduce the quantity of this order to one share, before transacting the crossing. However, this sacrifices the ability to take advantage of a favorable time-priority position in the order book if there is further liquidity in the Liquidity Pool at a compatible price that can be shifted into the market.
5.3 Market order side price risk from delayed execution
In effect when the broker commits to a cross, he takes a position on the market order side of this cross. If crossing market does not exist then the broker has to wait until it is created. He has to hold this position when he waits. There is no certainty that waiting will be successful and cross will be executed as planned. If crossing market is not established then the marker order side of the cross must be liquidated – either at the current price which may be inferior to the crossing price or by trading it over some time period. Either way, the broker here bears the risk. The longer the wait is, the higher is this risk. The waiting time (or its proxy - the number of attempts to create crossing market by submitting dummy one share orders) as well as the crossing price, volume of the limit/market order sides and where the limit side is (in the book or in the liquidity pool) are the control parameter of a cross.
6. Simulation and Analysis Techniques
Analyses and simulations were based upon data captured from the ASX SEATS Open Interface. Captured ASX data include the complete set of order quotes, trading records and market status changes for the entire market. Software has been developed for replaying market trading using these quotes and market status changes. It includes the complete trade execution logic of the ASX. The user can modify the quotes and then to replay the modified market. The result of the simulation will be exactly the same as if clients modified their quotes in this way in the original market. This market trading simulation model has two principal weaknesses. Firstly, it is not possible to determine whether the order that crossed the spread was a market order with no price limit (that is, that order was to buy the given amount of shares) or market order with price limit (to buy everything up to some price) which leaves the residual in the market’s limit order book. Both interpretations are equivalent for the actual trading trajectory and remain equivalent as long as the perturbed trajectory remains close to the original one. Secondly, because the replayed market cannot react to the user modification of the quotes, the amount of perturbance has to be low, to make simulations valid. For example, this can be achieved if the volume of the modified quoted is kept below 3% of the daily turnover.
7. Empirical Analysis of the aspects of trading on the ASX relevant for crossing
This section examines empirical factors that determine the risks and benefits associated with crossing on the ASX
• The higher is the average fraction of the trading day when crossing market “naturally” exists in a given security, the lower is the probability that the crossing market does not exist when required, less expected waiting time is necessary, and the smaller is the price risk for market side from delayed execution.
• The intra-day variation of the fraction of the trading time when crossing market exists in a given security determines the distribution of the price risk for market side across trading day.
• The waiting time for a limit order submitted at the best bid/ask price . The higher is this time, the higher is the potential time saving if a cross is used instead of limit order. The higher the average depth in the book, the higher is the potential saving in execution time from a cross.
• The lower is the fraction of limit orders submitted at the best bid or ask which were executed, the higher will be the potential from being able to cross at the current best price rather than being forced to offer an inside spread or market order to force execution.
• The more minimal price stepsbetween is between two best priced asks/ bids, the higher is the feasible reduction in price impact that can be negotiated between the market side and limit sides of crossing.
• The higher is the fraction of the stocks with undisclosed orders and higher is their frequency, the higher is the probability on under execution on the limit order side. The higher is the average size of undisclosed orders in comparison to the current depth, the more inaccurate will be the depth measurement and the higher will be the expected under-execution.
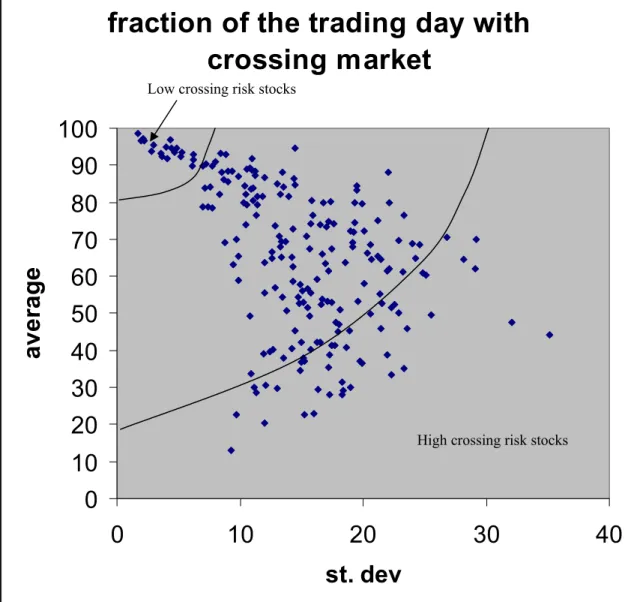
7.1 Crossing Risk by Security via the average portion of the trading day with crossing market It is clear that the price risk of crossing due to delayed execution for a particular security is inversely proportional to the fraction of the trading day when a crossing market existed for the security. We
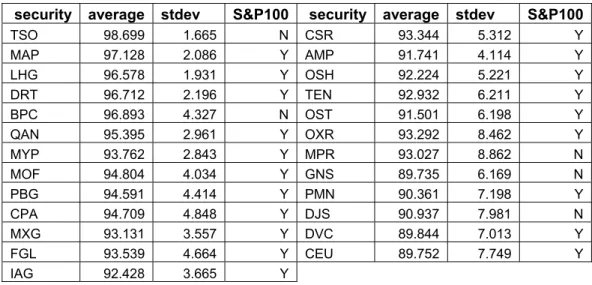
measured it for stocks over 45 day sample. The results are shown in Figure 1. The summary tables 1 and 2 list stocks with low and high crossing risks. Complete table of crossing risks for all stocks in the sample are given in the Appendix A.
fraction of the trading day with
crossing market
0
10
20
30
40
50
60
70
80
90
100
0
10
20
30
40
st. dev
aver
ag
e
Figure 1. Average vs. standard deviation of the fraction of the trading day when crossing market exists for securities in
the sample, measured over 45 trading days.
Low crossing risk stocks
security average stdev S&P100 security average stdev S&P100 TSO 98.699 1.665 N CSR 93.344 5.312 Y MAP 97.128 2.086 Y AMP 91.741 4.114 Y LHG 96.578 1.931 Y OSH 92.224 5.221 Y DRT 96.712 2.196 Y TEN 92.932 6.211 Y BPC 96.893 4.327 N OST 91.501 6.198 Y QAN 95.395 2.961 Y OXR 93.292 8.462 Y MYP 93.762 2.843 Y MPR 93.027 8.862 N MOF 94.804 4.034 Y GNS 89.735 6.169 N PBG 94.591 4.414 Y PMN 90.361 7.198 Y CPA 94.709 4.848 Y DJS 90.937 7.981 N MXG 93.131 3.557 Y DVC 89.844 7.013 Y FGL 93.539 4.664 Y CEU 89.752 7.749 Y IAG 92.428 3.665 Y
Table 1. List of stocks where the risk crossing failure is low. For each security it lists the average percentage of
security average St dev S&P100 security average St dev S&P100 JBM 51.502 15.529 N LEI 38.088 15.108 Y FWD 52.305 16.616 N WPL 33.627 10.928 Y GUD 52.97 17.444 N APA 45.924 23.552 N CDR 60.202 25.104 N UTB 40.659 18.636 Y TPI 55.227 21.333 N TSE 37.162 15.234 N KCN 53.245 19.535 N CTX 36.763 14.948 Y ADB 49.322 15.655 N ANN 38.875 17.253 Y HIL 51.132 18.17 N BEN 34.623 14.859 N THG 62.082 29.14 N CSL 29.914 11.126 Y IVC 52.641 21.517 N ASX 30.482 12.077 Y SHL 45.292 14.429 Y WOR 35.418 17.161 N BBG 47.561 17.754 Y RIO 28.604 11.299 Y SIG 52.304 22.541 N SPT 37.023 19.724 N FKP 49.89 20.606 N SDG 38.849 21.982 N VSL 51.435 22.263 N SGM 29.651 13.045 Y BKN 47.014 18.016 N SMS 36.455 19.934 N WES 40.184 12.654 Y LSG 47.684 32.062 N MYO 50.281 22.86 N CRG 29.499 16.372 N NWSLV 39.19 11.878 N NUF 31.404 18.336 N ORI 42.275 15.017 Y MBL 22.534 9.696 Y SGB 39.556 12.463 Y IFL 35.102 23.302 N ALS 45.059 17.99 N AEO 33.346 22.303 N BNB 40.621 14.183 Y NRT 30.023 19.014 N SEV 45.252 18.858 N SBC 28.138 17.303 N FMG 42.291 16.259 N CXP 29.205 18.405 N RHC 42.23 16.543 N FLT 27.992 18.268 N NCM 38.082 13.502 Y PBB 44.194 35.16 N UGL 40.272 15.747 N COH 20.374 12.03 Y IRE 45.898 21.438 N AQP 22.721 15.207 N ADZ 49.579 25.558 N FOA 22.969 16.04 N BOQ 41.368 17.465 N PPT 13.166 9.266 Y SFE 41.344 17.714 N
Table 2. List stocks where the risk of crossing failure is high. For each security, it lists the average percentage of
trading day that a crossing market existed, the standard deviation and whether the security is in the S&P100.
These tables clearly show that high cap securities from S&P100 tend to have low crossing risk and high crossing risk securities tend to be low cap (non S&P100) ones. The banking stocks are an exception, with high/medium level of crossing risk.
7.2 Estimating intra-day Distribution of Crossing Market Risk
Analysis of the percentage of trading time when crossing market exists within equal-size time bins shows that typically the first 36 trading minutes have the highest relative risk of crossing failure. This is most likely attributable to the settling of inherent imbalances of liquidity immediately following the opening auction period. Figures 2 and 3 show intraday distributions of crossing markets for AXA and TOL. Their character appears to be similar to the inverted J-shape in the US market [8] – a large spread in the first minutes of trading declining over about 15 minutes to a level which lasts until the last few minutes of the day. The absence of the increase in the spread on the ASX during lasttrading minutes in comparison with NYSE can be possible explained by the absence of the closing auction on the NYSE.
AXA intra day bin
0 10 20 30 40 50 60 70 80 90 1 2 3 4 5 6 7 8 9 10 time bin % bi n w it h c ross ing ma rk e tFigure 2. Percentage of time that a crossing market existed for AXA over 10 equal time buckets over the day (averaged
over 45 trading days).
TOL Intra day crossing market
0 20 40 60 80 100 1 2 3 4 5 6 7 8 9 10 time bins % o f t h e bi n w it h c ros si n g ma rk et t ime
Figure 3. Percentage of time that a crossing market existed for TOL over 10 equal time buckets over the day (averaged
over 45 trading days).
7.3 Empirical analysis of under execution risk due to undisclosed orders
Analysis of the trading data from Nov 2005 shows that on average 9.75% of securities contained
undisclosed orders, the average fraction of the trading day when an undisclosed order appeared in the book was 2.36% (estimated as ½ of the time shown in Table 3, when undisclosed orders appearance on both bid and ask were counted), and if an undisclosed order was present at best ask/bid price then on average it represented between 3.04% and 6.08% of all depth at this price level. Therefore the probability of having an undisclosed order can be estimated as 0.23% and the difference between the observed and true full depth at the best price was below 6%. Therefore, the risk of under execution due to hidden liquidity is currently very low.
% names % of day % of depth % of order
1-Nov
8.37
6.19
4.31
0.20
2-Nov
5.42
5.37
2.36
0.08
3-Nov
6.15
1.40
1.30
0.10
4-Nov
11.17
3.07
4.15
0.14
7-Nov
8.86
3.76
3.00
0.13
8-Nov
11.88
6.12
3.08
0.14
9-Nov
11.76
5.09
3.10
0.19
11-Nov
3.19
6.39
2.36
0.35
14-Nov
11.50
3.48
0.94
0.12
15-Nov
12.38
8.86
3.07
0.13
16-Nov
10.99
3.29
3.32
0.10
17-Nov
8.42
6.32
4.85
0.13
18-Nov
10.84
9.31
3.76
0.14
22-Nov
15.00
3.59
3.84
0.12
24-Nov
11.00
2.45
2.44
0.10
25-Nov
9.95
3.61
2.85
0.21
28-Nov
10.14
5.26
4.13
0.20
30-Nov
8.50
1.39
1.89
0.12
average
9.75
4.72
3.04
0.15
Table 3. % of securities where undisclosed orders where used during normal trading. % of the normal trading time when undisclosed orders appear in the book (for these names), undisclosed % of total depth at the best bid and best ask levels, % of undisclosed orders among all limit orders
While the use of undisclosed order within the ASX market is currently insignificant for the transaction of crossings, the advent of the iceberg order type with the new ITS trading system may change that should it gain greater acceptance.. Iceberg orders can be considerably smaller (minimum 1000 shares compared to $200,000 order value for undisclosed orders). Given previous experiences on the ASX with undisclosed orders (see section 5.1), there may become significant from the crossing perspective. Furthermore, the iceberg order presents additional problems over and above those of undisclosed orders because the market does not publicly identify iceberg orders as such. However, once an iceberg order has exhausted its visible quantity and this visible quantity been replenished for the first time, it is possible to identify the order as an iceberg order.
7.4 Transaction Cost of Crossing
Orders entered into the market are charged $0.20 per order plus GST, all further modifications of the order including deletion, are free. Executed volume is charged at the same rate as orders executed against other brokers, namely, $2.00 per $100,000 plus GST (both sides pay this fee) capped at $20 plus GST.
Currently, it is no cheaper to transact a crossing on the ASX than it is execute against another broker in the market. However, as part of the ASX full pricing review as part of the CLICK migration, this may change in future.
In addition to the costs of executing the crossing, there are additional costs of auxiliary order entry for the purpose of creating the crossing market and appearing at the crossing price. This can be exacerbated if other participants hit these orders and force the broker to re-try.
7.5 Time and depth estimate. Stocks gaining most from crossing at best bid/ask price and those which gain most from crossing away from it.
The reduction in time from using crossing can be estimated as the average time a limit order submitted into the best price step waits until it has time priority (that is, when it is first) minus 10 sec (see tables in the Appendix B and C). Alternatively, it can be estimated from the average depth in the limit book, measured in terms of the average market orders hitting it (table in the Appendix D). The stocks with the largest depth at best price and with the longest waiting time would provide the largest benefit from crossing at best price level. Similarly, the stocks with small depth at best price may benefit more from deeper inside book crossing, required to fill the required amount.
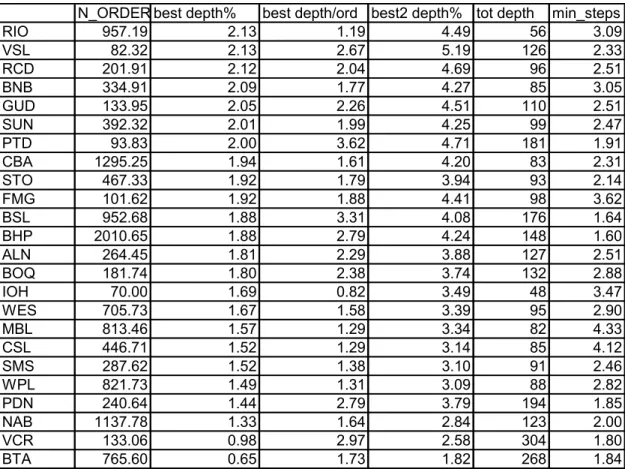
Table 4 shows the stocks with the smallest fraction of liquidity in the book appearing at best price. Thus, these are securities where liquidity depth in the book is distributed further away from the bid and ask. Here market order whose volume exceeds the best depth can expect to walk up the book at least one price step incurring price impact of the order of average minimal price steps (last column in Table 4). If orders volume exceeds the volume on two best prices then walk up will include at least one more level, etc. For example, suppose DMA client submits market order to trade parcel of stocks of RIO 1.5 size of average market order. One can expect here that
79.33%
100*(1.19)
1.5
=
to be traded at best bid/ask and100*(1.5 1.19)
20.67%
1.5
−
=
with be transacted with premium of 3.09 minimal price steps. If liquidity pool has available volume, and cross is transacted one minimal step worse than the best price, then the DMA order would reduce price impact for 20.67% of its volume from 3.09 minimal price steps to 1 minimal price step.Securities, listed in Table 5, have the largest depth at best price level (measured in terms of average market order size). Here the maximal potential benefit in terms of waiting time saving goes to the limit order side of the crossing. For example, if DMA market order to trade CPA arrives then crossing it against limit pool order would save for the limit order side sitting in the book waiting until 13 market orders hit the book. It worth noting that crossing allows the broker to keep time priority if further liquidity is behind.
N_ORDER best depth% best depth/ord best2 depth% tot depth min_steps RIO 957.19 2.13 1.19 4.49 56 3.09 VSL 82.32 2.13 2.67 5.19 126 2.33 RCD 201.91 2.12 2.04 4.69 96 2.51 BNB 334.91 2.09 1.77 4.27 85 3.05 GUD 133.95 2.05 2.26 4.51 110 2.51 SUN 392.32 2.01 1.99 4.25 99 2.47 PTD 93.83 2.00 3.62 4.71 181 1.91 CBA 1295.25 1.94 1.61 4.20 83 2.31 STO 467.33 1.92 1.79 3.94 93 2.14 FMG 101.62 1.92 1.88 4.41 98 3.62 BSL 952.68 1.88 3.31 4.08 176 1.64 BHP 2010.65 1.88 2.79 4.24 148 1.60 ALN 264.45 1.81 2.29 3.88 127 2.51 BOQ 181.74 1.80 2.38 3.74 132 2.88 IOH 70.00 1.69 0.82 3.49 48 3.47 WES 705.73 1.67 1.58 3.39 95 2.90 MBL 813.46 1.57 1.29 3.34 82 4.33 CSL 446.71 1.52 1.29 3.14 85 4.12 SMS 287.62 1.52 1.38 3.10 91 2.46 WPL 821.73 1.49 1.31 3.09 88 2.82 PDN 240.64 1.44 2.79 3.79 194 1.85 NAB 1137.78 1.33 1.64 2.84 123 2.00 VCR 133.06 0.98 2.97 2.58 304 1.80 BTA 765.60 0.65 1.73 1.82 268 1.84
Table 4. Securities with smallest best (relative) best price depth. Column 2 – the average number of market orders, column 3, the average size of best depth (on one side of the book) as a % of total depth, column 3- the average size of best depth measured in average market orders, column 3 – the average depth of 2 best price levels in the book as % total depth, the total depth measured in average market orders, number of minimal steps between 2 best prices.
7.6 Potential for crossing between price steps
Clearly, the larger is the number of minimal price steps between the two best prices on the same side of the limit order book the large is the potential benefits that can be negotiated between the market and the limit sides of the cross. For example, consider PPT stock that on average has 9.58 minimal price steps between two best bids or ask (see Tables in Appendix D and E). Market order that transacts more volume than is available in the book at the best price will incur a large price impact. Limit order submitted between two best prices may never get executed. Cross at the price between two best prices (say, giving two minimal price steps premium to the limit order side) allows the market side to reduce its price impact and the limit side to obtain immediacy, non-disclosure and substantial liquidity premium on top of the spread. 8. Automated Strategies for Pricing Liquidity Pool Orders
The use of Liquidity Pool to facilitate crossing of DMA orders cannot be done manually due to the above-described time constraints. It requires an automated decision making about the fraction of the pool offered for crossing at any particular point in time and about its current pricing. This section is looking at better ways of pricing liquidity.
One strategy is to change the price on the liquidity pool order in line with changes in the security’s market spread. An example is to automatically price it a given number of price steps away from the best price. This could be implemented as an automated strategy under the control of the sales traders.
Using such a strategy solves the problem of the market price moving, thereby leaving the liquidity exposed at an unfavourable price. However, this is very simplistic approach and on statistics gathered, leaves the liquidity order out of the money unless the liquidity order was priced at the 0 price steps away from the best price .Furthermore, it tells nothing about manage the volume of the liquidity order side of the cross.
N MAR ORD best best % best2 %
TLS 1570 30.28 7.15 17.12 THG 57 16.22 8.50 17.96 BPC 173 14.07 8.31 18.61 CPA 157 12.46 16.62 29.30 MOF 134 12.27 11.93 28.64 ENV 65 11.68 6.28 15.58 DUE 132 11.41 10.91 16.98 IPG 182 10.61 19.98 32.73 CEUCA 101 10.35 7.40 14.43 GSA 81 9.61 25.67 45.33 CEU 104 9.47 17.10 33.01 MPR 92 9.14 9.71 21.71 MAP 415 9.01 4.80 9.93 OXR 425 8.82 4.84 11.35 HDF 71 8.68 7.21 16.02 HGI 137 8.30 7.43 15.40 QAN 357 7.99 6.50 14.37 DRT 178 7.59 18.07 34.27 IIF 119 7.40 21.28 39.86 FKP 102 7.16 4.62 12.87 TSO 87 6.95 21.62 40.24 BJT 88 6.91 9.08 17.53 IOF 96 6.88 9.80 18.17 GAS 91 6.61 5.92 13.08 LHG 392 6.52 4.68 10.15 MDT 103 6.47 15.31 30.14 HVN 163 6.37 10.12 17.41 BCA 98 6.31 16.99 42.84 VPG 69 6.20 14.49 29.68 OMP 79 6.07 5.24 13.54 DJS 183 5.81 6.02 12.54 RIC 76 5.69 6.02 12.75 MIG 429 5.62 6.30 12.38 SDG 64 5.61 4.09 7.81 SGN 92 5.49 6.16 13.02 APA 80 5.43 5.88 11.48
Table 5. Securities with largest best price depth. Column 2 – the average number of market orders, Column 3 - the average size of best depth measured in average market orders, the average best price depth (on one side of the book) as a % of total depth, column 4 – the average depth of 2 best price levels in the book as % total depth.
An attractive approach would be to employ a VWAP-like pricing algorithm for the Liquidity Pool which would automatically set and quantity available.
9. Crossing Strategy Refinements. Crossing at fractions of a Price Step
Trading on the ASX is currently constrained to occur at discrete prices determined by the price step interval for a security. These price steps are determined by a combination of the security type as well as the price at which the security is currently trading2. This can add significantly to the cost of trading as it causes orders wishing to trade to cross a wider spread.
It is possible to trade inside a single price step spread. Suppose the spread between the current bid price B
and current ask price A is equal to the minimal price step
Δ
. Suppose broker has two complementary (one buy one sell) orders to tradeN
shares. It turns out that he can trade them at any price on a much finer than minimal price grid withN
Δ
step. This can be achieved by transacting two crosses – first for
N
1 shares with crossing price equal bid price B (N
1is any integer from [0,N] interval) and the second for N2 shares(
N
2= −
N N
1) with crossing price equal ask price A. The effective price delivered to the original buy and sell orders will beC
A
N
1N
Δ
= +
. The higher is the size of the order N the smaller will be the minimal price step available to transacting.From an operational perspective, this approach does involve a slight increase in complexity because two crossings need to be carried out, and also slightly greater risk of the crossing being frustrated by the market. However, the transactional costs of the crossing are only slightly greater (to account for the submission of additional crossing order) but this would be more than offset by the gains.
12. Conclusions
The key conclusions that can be drawn from the preceding results and analyses fall into several categories. Firstly, the paper provides a solid foundation for the understanding of the benefits, risks and costs
associated with the use of the crossing. It demonstrates that crossing in the high cap securities is generally very low risk on the ASX, mainly because the crossing markets tend to exist for these securities for most of the day (banking stocks are an exception). Crossing is slightly more risky in the period after market open due to market volatility. The acceleration of the execution of Liquidity Pool orders due to reuse of crossed orders can also be significant.
The study also demonstrates that additional benefit could be derived from the systematic use of crossing orders in automated trading including possibility to extend the space of feasible trade into inter-spread fine grid, increasing the incentives to trade by removing the need to cross the spread.
2 It is possible to transact off-market trades at average prices but these are out of scope for this discussion
13. References
[1] Ivy Schmerken, Direct-Market-Access Trading,
http://www.wallstreetandtech.com/showArticle.jhtml?articleID=59301336
[2] Transcript of ASX's full-year results briefing, 27 July 2005,
http://www.asx.com.au/about/pdf/analyst_transcript_fy05.pdf
[3] Dan Safarik, Direct Market Access – The Next Frontier,
http://www.wallstreetandtech.com/showArticle.jhtml?articleID=60404150
[4] Hasbrouck and Saar, Limit orders and volatility in hybrid markets: The island ECN, Working papers, Stern School of Business, New York University (2002).
[5] L. Tuttle, Hidden Orders, Trading Costs and Information, Working paper (Fisher College of 5Business), (2002).
[6] Pardo, A. and Pascual, R., On the hidden side of liquidity, Working paper University of Valencia (2004).
[7] C. D’Hondt, R. De Winne and A. Francois-Heude., Hidden Orders on Euronext: Nothing is quite as it seems…., Working paper,(FUCaM and University of Perpignan) (2003).
[8] C. D’Hondt, Which execution improvement for orders on Euronext?
http://www.dauphine.fr/cereg/UserFiles/File/FMQ35.pdf
[9] Aitken, M.J., Brown, P. and Walter , T. Infrequent trading and firm size effects as explanations or intraday patterns in returns on SEATS, Working paper -SIRCA (1996).
[10] Aitken, M.J., Berkman, H. and Mak, D. The use of undisclosed limit orders on the Australian Stock Exchange, Journal of Banking 25 1589-1603 (2001).
[8] T.H.McInish and R.A.Wood, An Analysis of intra-day patterns in bid/ask spreads for NYSE stock, J. Fin., 47 (2) 753- 764 (1992)
Appendix A: Detailed Results: Percentage of Trading Day when Crossing Market Exists
average stdev asx100 AMC 81.567 11.408 Y
TSO 98.699 1.665 N PPX 81.65 11.872 Y MAP 97.128 2.086 Y CML 79.868 10.329 Y LHG 96.578 1.931 Y CCL 80.511 11.066 Y DRT 96.712 2.196 Y CGF 82.259 13.247 Y BPC 96.893 4.327 N AXA 79.46 10.563 Y QAN 95.395 2.961 Y TEL 79.34 11.43 Y MYP 93.762 2.843 Y GTP 81.558 13.968 N MOF 94.804 4.034 Y IIF 88.127 22.08 Y PBG 94.591 4.414 Y CPU 76.404 11.339 Y CPA 94.709 4.848 Y IOF 84.293 19.5 Y MXG 93.131 3.557 Y ROC 80.509 15.804 N FGL 93.539 4.664 Y HDR 83.338 19.469 N IAG 92.428 3.665 Y ORG 73.858 10.49 Y CSR 93.344 5.312 Y MCW 79.929 16.766 Y AMP 91.741 4.114 Y TAP 80.102 17.336 N OSH 92.224 5.221 Y CEY 73.69 12.892 N TEN 92.932 6.211 Y API 76.394 15.948 N OST 91.501 6.198 Y WBC 69.172 8.741 Y OXR 93.292 8.462 Y ALZ 79.771 19.356 N MPR 93.027 8.862 N WOW 69.958 9.663 Y GNS 89.735 6.169 N PDN 79.691 19.925 N PMN 90.361 7.198 Y HDF 72.943 14.263 N DJS 90.937 7.981 N CNP 74.113 15.737 Y DVC 89.844 7.013 Y ABC 74.803 17.181 N CEU 89.752 7.749 N ENV 79.751 22.13 N MIG 91.82 10.994 Y GWT 70.692 13.188 N TLS 94.632 14.454 Y KIM 73.985 16.488 N MGR 88.223 8.477 Y CDO 74.148 17.647 N FCL 88.287 9.005 Y MGW 73.355 16.987 N DUE 88.416 9.358 N EXL 69.515 13.355 N JST 89.338 10.846 N ABS 69.335 13.66 N SSX 88.812 10.54 N ANZ 65.455 9.893 Y SDL 88.664 11.003 N ARQ 70.757 15.375 N SGP 85.992 8.701 Y VPG 74.584 19.303 N MTS 88.475 11.272 Y WDC 67.872 13.265 Y BBI 86.863 9.84 N AWB 66.516 12.575 Y BIL 83.753 7.15 Y SIP 75.048 21.19 Y AWC 84.167 7.582 Y QBE 63.033 9.471 Y ZFX 85.535 8.988 Y WYL 72.249 18.945 N GPT 87.209 11.266 Y AUW 76.402 23.289 N AIX 86.818 11.966 N SGN 71.959 19.236 N AWE 88.047 13.465 N HSP 72.372 20.057 N BSL 84.512 10.39 Y TAH 64.732 12.587 Y TCL 82.17 8.316 Y BLD 65.189 13.337 Y PRK 83.922 11.072 Y RIN 63.817 11.971 Y MGQ 83.529 10.881 Y MCG 67.295 15.629 Y GAN 86.437 14.423 Y PTD 65.267 14.221 N HVN 85.024 13.045 Y APN 69.193 19.153 Y BHP 78.874 6.972 Y COA 67.365 17.468 N CSM 82.142 10.426 N BTA 66.038 16.67 N MAY 78.771 7.431 N PMP 68.038 19.122 N SYB 78.508 7.751 Y NAB 58.793 9.905 Y FXJ 84.063 13.57 Y ENE 62.511 14.288 N HGI 84.654 14.45 N MRE 68.597 20.589 N
TWR 69.735 22.875 N SGB 39.556 12.463 Y JBH 63.468 16.921 N ALS 45.059 17.99 N SEK 66.354 20.338 N BNB 40.621 14.183 Y RMD 63.63 18.514 Y SEV 45.252 18.858 N RIC 68.887 24.023 N FMG 42.291 16.259 N DOW 58.663 14.294 Y RHC 42.23 16.543 N RCL 65.494 21.205 N NCM 38.082 13.502 Y GDR 61.449 17.177 N UGL 40.272 15.747 N AGL 57.025 12.888 Y IRE 45.898 21.438 N TIM 68.678 24.637 N ADZ 49.579 25.558 N BJT 64.519 20.688 N BOQ 41.368 17.465 N OMP 70.595 26.847 N SFE 41.344 17.714 N NWS 55.583 12.04 N LEI 38.088 15.108 Y VCR 64.704 21.485 N WPL 33.627 10.928 Y MCC 59.286 16.269 N APA 45.924 23.552 N ALN 57.828 14.88 Y UTB 40.659 18.636 Y ILU 56.704 15.513 Y TSE 37.162 15.234 N PBL 56.205 15.106 Y CTX 36.763 14.948 Y ALL 54.375 13.464 Y ANN 38.875 17.253 Y IPG 69.996 29.177 Y BEN 34.623 14.859 N GRD 64.769 24.222 N CSL 29.914 11.126 Y GAS 61.974 22.094 N ASX 30.482 12.077 Y LLC 54.478 14.729 Y WOR 35.418 17.161 N TOL 55.426 15.726 Y RIO 28.604 11.299 Y LNN 61.427 21.969 Y SPT 37.023 19.724 N CBA 49.19 10.766 Y SDG 38.849 21.982 N BCA 61.192 23.24 N SGM 29.651 13.045 Y SUN 52.771 14.826 Y SMS 36.455 19.934 N CIY 58.004 20.123 N LSG 47.684 32.062 N STO 52.909 15.142 Y CRG 29.499 16.372 N WAN 53.817 16.644 Y NUF 31.404 18.336 N JHX 50.587 13.791 Y MBL 22.534 9.696 Y CER 64.678 28.137 N IFL 35.102 23.302 N BWP 60.882 24.831 N AEO 33.346 22.303 N RCD 53.117 17.068 N NRT 30.023 19.014 N JBM 51.502 15.529 N SBC 28.138 17.303 N FWD 52.305 16.616 N CXP 29.205 18.405 N GUD 52.97 17.444 N FLT 27.992 18.268 N CDR 60.202 25.104 N PBB 44.194 35.16 N TPI 55.227 21.333 N COH 20.374 12.03 Y KCN 53.245 19.535 N AQP 22.721 15.207 N ADB 49.322 15.655 N FOA 22.969 16.04 N HIL 51.132 18.17 N PPT 13.166 9.266 Y THG 62.082 29.14 N IVC 52.641 21.517 N SHL 45.292 14.429 Y BBG 47.561 17.754 Y SIG 52.304 22.541 N FKP 49.89 20.606 N VSL 51.435 22.263 N BKN 47.014 18.016 N WES 40.184 12.654 Y MYO 50.281 22.86 N NWSLV 39.19 11.878 N ORI 42.275 15.017 Y
Appendix B: Average waiting time (in seconds) for a limit order submitted into best bid price step
average CXP 420.79 TEL 249.62 ORIR 150.30 SSI 4421.75 JST 415.92 MTS 244.95 DOW 149.76 HDF 1244.44 ARQ 414.44 UTB 243.55 JBM 148.99 NHC 1102.86 API 411.64 TSE 240.10 BNB 142.28 APA 906.96 KCN 410.33 QAN 238.44 CCL 141.27 CIY 870.43 TEN 402.11 CSR 236.75 BTA 140.35 LSG 832.95 TIM 396.31 ALS 236.70 AMC 137.05 BWP 754.02 BBI 393.43 MAP 235.59 TOL 136.70 SGN 753.20 SSX 392.74 ADB 234.00 CML 136.65 DRT 706.06 IIF 389.68 PMN 226.82 JHX 132.71 CER 699.86 GAN 388.58 OXR 225.57 COH 131.28 VCR 698.45 GTP 387.16 HSP 223.62 BIL 131.28 AIX 683.90 MOF 387.10 NUF 222.89 AMP 126.93 MPR 678.44 AEO 382.88 PRK 221.42 NWS 125.46 SDG 669.95 AQP 379.99 CRG 220.41 LLC 121.20 GRD 661.04 DJS 369.75 SGP 219.88 LEI 117.46 FKP 654.61 FMG 366.96 SEV 218.82 WOR 117.44 BJT 644.60 FOA 363.69 AXA 215.80 ANN 114.96 MCW 643.42 BCA 362.53 ENE 210.64 ALL 114.02 MGX 636.60 LHG 361.24 AWB 210.31 BSL 107.41 JBH 626.31 IRE 360.58 FLT 209.90 SHL 103.76 MDT 625.78 GWT 358.17 SIG 209.06 PBL 103.45 FWD 621.37 WYL 356.48 DVC 208.35 SUN 101.43 AUW 615.40 PMP 355.43 UGL 206.82 STO 96.80 SEK 614.40 MGQ 348.95 PPX 206.25 CTX 96.61 RCL 590.18 GUD 348.90 RHC 204.87 ASX 95.77 CEU 586.70 BPC 346.09 OST 204.61 AGL 95.31 IOF 586.04 ALZ 337.61 WAN 196.89 TLS 94.45 GSA 579.33 SBC 337.26 MCC 196.54 ORI 88.45 GAS 555.68 CDO 333.59 FXJ 195.95 TAH 85.51 PTD 553.12 GPT 333.56 CEY 195.69 WDC 84.95 CPA 527.25 ROC 327.10 RCD 187.56 WOW 83.25 OMP 523.16 HVN 322.45 BOQ 182.87 SGB 82.46 UCL 504.69 PBG 321.83 AWC 179.36 QBE 79.72 IFL 504.28 MGW 316.95 ZFX 178.08 RIN 77.78 MYO 499.22 SPT 314.99 MCG 177.17 WES 66.83 CEUCA 493.71 CNP 309.33 EXL 174.89 NCM 64.88 VSL 493.24 MXG 307.09 CPU 172.27 CSL 60.94 ENV 492.10 PDN 299.61 SGM 172.27 WBC 60.73 THG 489.97 PBB 296.01 MAY 166.33 WPL 52.22 ABC 487.10 COA 287.98 MIG 165.84 ANZ 52.13 MRE 485.12 TPI 286.72 BBG 165.49 RIO 47.96 HIL 478.34 GNS 284.35 ABS 165.32 NAB 47.32 VPG 477.67 BEN 282.10 OSH 165.18 CBA 46.62 HGI 473.10 APN 280.57 ILU 159.91 MBL 45.54 IVC 469.02 CGF 278.40 IAG 159.61 BHP 37.96 DUE 464.16 KIM 277.38 PPT 158.84
NRT 457.98 FCL 275.45 LNN 157.47 CDR 449.26 BKN 271.18 BLD 156.75 RIC 445.92 MGR 267.16 SFE 155.99 TSO 443.81 IPG 266.27 SYB 155.90 TWR 442.57 RMD 263.91 ORG 155.75 TAP 442.39 HDR 260.61 FGL 155.63 AWE 428.00 CSM 255.58 ALN 150.63 ADZ 424.19 MYP 253.30 TCL 150.51
Appendix C: Average waiting time (in seconds) for a limit order submitted into best ask price step
average VCR 455.56 SEV 257.92 LNN 164.07 SLV 3680.83 BCA 449.57 CSR 256.86 DOW 163.70 SSI 2100.33 ALZ 438.33 AWB 254.37 BIL 162.83 HDF 1628.02 OXR 437.53 MYO 252.92 ALN 162.27 CIY 1289.31 CNP 436.91 MCG 252.40 CPU 159.64 AZR 1243.33 AEO 436.33 MCC 250.20 PPT 158.03 AUW 1175.20 TWR 427.15 BEN 247.90 TOL 151.98 APA 1124.71 DUE 422.19 AXA 246.72 AWC 151.52 PBB 962.83 PDN 419.83 FOA 243.62 SYB 146.87 BJT 944.63 RMD 419.51 UCL 243.33 SFE 145.44 FKP 927.10 TIM 413.46 QAN 242.27 BLD 140.64 TFS 918.67 IRE 411.69 BOQ 241.95 JHX 140.03 CER 900.68 ALS 406.21 FLT 241.40 CML 137.17 MDT 891.74 BKN 402.98 PMN 238.78 SHL 130.86 SEK 879.60 FMG 401.73 IPG 238.44 ALL 128.26 FWD 842.42 DRT 398.88 RCD 235.90 BNB 126.31 VSL 823.27 ROC 397.10 MGR 235.64 QBE 125.83 CDR 795.61 WYL 392.81 SSX 235.33 SUN 125.70 CPA 787.45 ABC 388.12 HSP 234.92 TLS 123.54 OMP 756.04 AWE 378.49 FXJ 233.20 BSL 121.13 RIC 729.18 NRT 373.53 MAP 231.97 AMP 119.91 MPR 718.28 MGQ 370.28 PRK 231.01 NWS 119.33 ENV 702.49 SPT 362.78 NUF 230.93 AGL 119.01 TSO 695.23 BPC 360.94 ZFX 223.64 ASX 117.52 IOF 691.74 CDO 356.47 WOR 222.86 LLC 115.23 GRD 686.81 KCN 356.27 CGF 218.07 PBL 114.75 CEU 663.09 KIM 351.73 SGP 217.77 TAH 113.10 AIX 657.73 MXG 344.20 WAN 213.13 COH 109.77 GSA 651.98 FCL 344.09 PBG 211.15 SGB 105.26 ADZ 649.80 JST 339.95 LHG 209.96 ORI 104.50 HIL 628.82 DVC 335.65 CRG 206.63 LEI 102.51 GAS 627.15 TPI 333.42 MIG 203.18 CTX 99.53 TEN 622.04 MOF 326.38 EXL 199.88 STO 96.41 THG 609.39 GAN 313.24 UGL 199.19 RIN 85.80 BWP 605.65 TAP 310.59 CEY 194.20 CSL 84.85 API 592.03 SBC 302.07 OST 191.54 WOW 83.26 RCL 590.31 TEL 301.78 MAY 190.65 WDC 81.89 AQP 585.02 PPX 301.49 FGL 189.88 BTA 78.42 JBH 583.72 GNS 298.41 BBG 189.40 WES 68.17 GTP 576.09 GPT 298.26 SIG 187.29 NCM 63.13 MCW 574.59 CSM 296.08 ADB 186.53 WBC 61.34 IVC 562.92 MTS 294.76 UTB 183.80 CBA 54.03 MGW 557.56 HGI 294.74 ILU 181.97 WPL 53.79 ARQ 557.34 GWT 283.59 AMC 181.36 ANZ 51.50 LSG 555.46 RHC 280.73 ABS 180.91 RIO 51.09 IFL 542.24 GUD 279.04 SGM 178.89 NAB 46.61 VPG 527.73 HVN 277.90 TCL 178.43 MBL 44.42 CEUCA 486.79 IIF 277.15 JBM 178.39 BHP 41.31 PTD 481.51 DJS 271.00 CCL 176.46
SGN 474.34 MRE 270.73 OSH 175.32 MGX 470.20 COA 265.03 ANN 174.16 BBI 465.31 MYP 264.72 IAG 173.79 CXP 458.68 APN 261.78 ORG 173.51 ORIR 457.33 SDG 258.63 HDR 172.84 PMP 456.76 ENE 258.63 TSE 169.35
Appendix D: Average number of market orders and the time-average size of the depth at best bid/ ask divided on the average size of market
MARKEdepth IVC 104 4.2 BHP 2011 2.8 LNN 211 2.0 TLS 1570 30.3 AXA 211 4.2 PDN 241 2.8 TOL 293 1.9 THG 57 16.2 GWT 103 4.1 ZFX 310 2.8 ILU 232 1.9 BPC 173 14.1 CIY 49 4.1 CDR 84 2.8 FMG 102 1.9 CPA 157 12.5 PMP 158 4.0 WYL 112 2.7 BBG 220 1.8 MOF 134 12.3 DVC 219 4.0 MRE 122 2.7 STO 467 1.8 ENV 65 11.7 PBG 200 4.0 FLT 179 2.7 QBE 522 1.8 DUE 132 11.4 MXG 263 3.9 BKN 97 2.7 NUF 126 1.8 IPG 182 10.6 OST 259 3.9 VSL 82 2.7 BNB 335 1.8 CEUCA 101 10.3 GPT 229 3.9 AMC 361 2.6 NWSLV 312 1.8 GSA 81 9.6 FCL 177 3.9 ARQ 161 2.6 SGB 544 1.7 CEU 104 9.5 CSR 270 3.9 TEL 166 2.6 WDC 661 1.7 MPR 92 9.1 MGW 124 3.9 MTS 196 2.6 UGL 178 1.7 MAP 415 9.0 PPX 274 3.8 PRK 330 2.5 BTA 766 1.7 OXR 425 8.8 GNS 222 3.8 CPU 253 2.5 ALL 335 1.7 HDF 71 8.7 TIM 125 3.8 CCL 361 2.5 WOR 159 1.7 HGI 137 8.3 TEN 162 3.8 MAY 264 2.5 JHX 262 1.7 QAN 357 8.0 TCL 393 3.7 HWI 83 2.5 SPT 112 1.7 DRT 178 7.6 RCL 97 3.6 BIL 523 2.5 TSE 126 1.7 IIF 119 7.4 PTD 94 3.6 EXL 272 2.4 SHL 289 1.7 FKP 102 7.2 WAN 166 3.6 NRT 101 2.4 NAB 1138 1.6 TSO 87 6.9 BBI 168 3.6 NWS 633 2.4 LLC 303 1.6 BJT 88 6.9 AWE 187 3.6 WOW 634 2.4 LEI 278 1.6 IOF 96 6.9 ROC 145 3.5 BOQ 182 2.4 SGM 195 1.6 GAS 91 6.6 ANN 210 3.5 COA 158 2.4 CBA 1295 1.6 LHG 392 6.5 ADZ 95 3.4 PBB 129 2.4 UTB 223 1.6 MDT 103 6.5 CML 542 3.4 MCW 125 2.3 RIN 604 1.6 HVN 163 6.4 HIL 86 3.4 FWD 102 2.3 CRG 153 1.6 BCA 98 6.3 SGP 254 3.4 ADB 201 2.3 TPI 132 1.6 VPG 69 6.2 PMN 262 3.4 CXP 85 2.3 PPT 174 1.6 OMP 79 6.1 CSM 285 3.4 HSP 185 2.3 WES 706 1.6 DJS 183 5.8 JBH 104 3.3 ALN 264 2.3 SYB 273 1.6 RIC 76 5.7 API 119 3.3 MCC 224 2.3 SFE 248 1.6 MIG 429 5.6 BSL 953 3.3 DOW 216 2.3 ASX 289 1.5 SDG 64 5.6 GRD 96 3.2 GUD 134 2.3 NCM 622 1.5 SGN 92 5.5 KCN 129 3.2 MGX 68 2.3 COH 271 1.5 APA 80 5.4 TWR 137 3.2 SIG 193 2.2 PBL 380 1.5 BWP 78 5.4 IFL 62 3.1 IRE 80 2.2 MYP 221 1.5 GAN 141 5.3 CEY 286 3.1 JBM 290 2.2 ORI 328 1.5 AIX 124 5.3 FXJ 264 3.1 BEN 143 2.2 SMS 288 1.4 AEO 76 5.2 SEV 113 3.1 CNP 169 2.2 CTX 360 1.3 MYO 79 5.2 CGF 182 3.1 TAH 581 2.1 WPL 822 1.3 IAG 495 5.0 AWB 190 3.1 ENE 155 2.1 MBL 813 1.3 HDR 344 4.9 ORG 349 3.0 AGL 419 2.1 CSL 447 1.3 SSX 158 4.9 MGQ 179 3.0 APN 145 2.1 RIO 957 1.2 AQP 73 4.9 JST 129 3.0 ALS 150 2.1 FOA 125 1.2 AUW 81 4.9 TAP 144 3.0 ABS 255 2.1 IOH 70 0.8 CER 66 4.8 KIM 119 3.0 RMD 162 2.1 LSG 78 4.8 CDO 151 3.0 RHC 157 2.1 FGL 418 4.7 VCR 133 3.0 RCD 202 2.0 AMP 655 4.7 ABC 106 3.0 MCG 200 2.0 MGR 242 4.7 GTP 180 3.0 ANZ 1184 2.0 ALZ 138 4.7 SGT 371 2.9 SUN 392 2.0 OSH 360 4.6 AWC 401 2.9 SBC 112 2.0 SEK 81 4.6 WBC 1210 2.9 BLD 318 2.0
Appendix D: Time-weighted average number of minimal price steps between 2 best ask prices
ASK_12 AVERAGE BKN 1.92 AWB 1.41 AMC 1.15
SLF 61.53 NRT 1.90 ABC 1.39 SGP 1.15
PPR 14.33 ADZ 1.89 STO 1.38 HGI 1.14
PPT 9.58 LLC 1.88 SYB 1.38 PMN 1.13
SLV 4.74 LSG 1.86 ORG 1.37 GSA 1.13
SSI 4.73 FKP 1.85 KIM 1.37 PBG 1.12
AQP 4.64 RCL 1.84 JBM 1.35 CML 1.10
CRG 4.57 ALN 1.83 CEU 1.34 MAY 1.10
COH 4.10 DOW 1.83 BWP 1.34 CSM 1.10
SBC 3.60 WPL 1.82 BCA 1.33 ZFX 1.10
FOA 3.10 MCG 1.81 ALZ 1.33 UCL 1.10
MBL 3.07 BJT 1.75 RMD 1.32 AUW 1.10
CSL 3.04 NHC 1.75 COA 1.32 BTA 1.10
ASX 2.87 RCD 1.73 API 1.32 AWC 1.09
UGL 2.74 PBL 1.73 CDO 1.31 PPX 1.08
SGM 2.71 FWD 1.71 BBI 1.31 HVN 1.08
CXP 2.66 HIL 1.70 NAB 1.30 MXG 1.08
TPI 2.62 ORIR 1.70 MCW 1.30 JST 1.08
IFL 2.54 KCN 1.68 WOW 1.29 CEY 1.07
TFS 2.52 HSP 1.68 BIL 1.29 NWS 1.07
SPT 2.51 AGL 1.67 IPG 1.29 FGL 1.07
FLT 2.51 BOQ 1.67 CER 1.29 MGR 1.07
ANN 2.47 QBE 1.67 MRE 1.28 BHP 1.07
TSE 2.46 VPG 1.66 DVC 1.27 IOF 1.06
NUF 2.40 VSL 1.66 WBC 1.27 OST 1.06
SDG 2.38 CNP 1.65 CCL 1.26 FXJ 1.06
BBG 2.37 SGB 1.65 WDC 1.26 TEN 1.06
WOR 2.36 TOL 1.64 CPU 1.26 CSR 1.05
CTX 2.36 NCM 1.64 AWE 1.26 DJS 1.05 SIG 2.34 ALL 1.63 PRK 1.25 GPT 1.05 UTB 2.33 BLD 1.63 JBH 1.25 ENV 1.05 RHC 2.32 SUN 1.62 SSX 1.25 DRT 1.05 AEO 2.31 SGN 1.61 MTS 1.25 BSL 1.05 BNB 2.30 TSO 1.61 TCL 1.25 MDT 1.04
WES 2.26 ENE 1.60 TEL 1.25 GNS 1.04
FMG 2.23 GAS 1.55 ANZ 1.24 TLS 1.03
JHX 2.20 MCC 1.55 AXA 1.24 GTP 1.03
BEN 2.18 TAH 1.54 ROC 1.24 OSH 1.03
RIO 2.17 CBA 1.53 CGF 1.23 AIX 1.02
SHL 2.16 MYO 1.53 FCL 1.23 MPR 1.02
ALS 2.16 ARQ 1.52 PTD 1.22 IAG 1.02
LNN 2.15 APA 1.52 IIF 1.22 OXR 1.02
IRE 2.15 MYP 1.51 MGQ 1.22 MAP 1.01
LEI 2.12 GRD 1.48 SEK 1.22 BPC 1.01
GUD 2.06 PMP 1.47 TWR 1.21 AMP 1.01
SEV 2.05 MGW 1.46 VCR 1.21 MOF 1.01
ADB 2.04 GWT 1.46 TAP 1.20 MIG 1.01
ILU 2.01 WYL 1.45 CIY 1.20 CPA 1.00
BMN 2.00 APN 1.45 HDF 1.20 QAN 1.00
PBB 2.00 ABS 1.45 PDN 1.20 AZR 1.00
WAN 1.97 RIN 1.45 LHG 1.20 CEUCA 1.00
ORI 1.96 RIC 1.44 THG 1.19 PRR 1.00
CDR 1.95 EXL 1.44 HDR 1.17 MGX 1.00
SFE 1.95 GAN 1.42 OMP 1.16 EPT 1.00
Appendix E: Time-weighted average number of minimal price steps between 2 best bid prices
average DOW 1.83 APN 1.34 VCR 1.13
SLF 12.66 SHL 1.83 WOW 1.34 CML 1.11
PPT 8.01 FWD 1.82 FCL 1.34 SEK 1.11
TFS 7.57 WPL 1.80 APA 1.34 CER 1.11
CRG 5.94 BKN 1.79 AXA 1.33 DRT 1.11
FOA 5.79 TPI 1.77 ORIR 1.32 BBI 1.10
BMN 4.98 RCD 1.74 MCW 1.31 DJS 1.10
SSI 4.72 NCM 1.72 GWT 1.31 PMN 1.09
SBC 3.55 CBA 1.72 PMP 1.31 TCL 1.09
RIO 3.40 TOL 1.72 WDC 1.31 GTP 1.09
COH 3.25 FLT 1.71 EXL 1.30 ENV 1.09
AEO 3.25 WBC 1.71 TIM 1.30 IOF 1.09
AQP 3.09 ALL 1.71 MGQ 1.29 MXG 1.08
IFL 3.05 FKP 1.70 TEL 1.29 CEY 1.08
FMG 2.98 ALN 1.68 TAH 1.29 IPG 1.08
JHX 2.88 GUD 1.67 ARQ 1.28 FXJ 1.07
CXP 2.82 AUW 1.67 JBM 1.28 DVC 1.07
PBB 2.80 SDG 1.67 BWP 1.27 TLS 1.06
MBL 2.79 SLV 1.66 OMP 1.27 JST 1.06
ASX 2.75 PBL 1.65 NAB 1.26 UCL 1.06
SEV 2.73 CDR 1.65 PBG 1.25 HVN 1.06
ANN 2.69 QBE 1.64 ROC 1.25 DUE 1.06
RIC 2.55 BLD 1.63 CGF 1.25 LHG 1.05
IRE 2.53 IVC 1.61 ORG 1.25 AWE 1.05
CTX 2.47 AGL 1.60 IIF 1.24 MGR 1.05
NRT 2.47 WYL 1.60 AMC 1.24 TSO 1.04
CSL 2.43 GRD 1.60 TAP 1.24 BHP 1.04
SGM 2.41 ENE 1.59 PRK 1.23 HDR 1.04
LEI 2.39 SUN 1.57 MAY 1.23 CSR 1.03
SPT 2.36 VSL 1.57 SSX 1.22 IAG 1.03
BEN 2.33 HIL 1.56 ALZ 1.22 FGL 1.03
BJT 2.32 WES 1.56 API 1.22 BTA 1.03
NUF 2.30 LSG 1.55 GPT 1.22 QAN 1.02
RHC 2.27 MRE 1.51 MTS 1.21 OSH 1.02
MYO 2.21 JBH 1.50 MGW 1.21 GSA 1.02
TSE 2.19 RMD 1.50 ANZ 1.20 TEN 1.02
BCA 2.18 AWB 1.50 TWR 1.20 AIX 1.02
WOR 2.18 LNN 1.49 AWC 1.18 GNS 1.02
ALS 2.13 SGB 1.49 BIL 1.18 CSM 1.02
BOQ 2.11 THG 1.46 GAN 1.18 OXR 1.01
UGL 2.10 KIM 1.45 PDN 1.17 AMP 1.01
ORI 2.09 MCC 1.43 CCL 1.16 BPC 1.01
SIG 2.07 HSP 1.43 OST 1.16 BSL 1.01
BBG 2.05 ABS 1.43 HGI 1.16 MPR 1.01
ADZ 2.03 VPG 1.43 PPR 1.16 MIG 1.01
CNP 2.02 SYB 1.42 PTD 1.16 CPA 1.00
BNB 2.01 CDO 1.42 MYP 1.16 AZR 1.00
SFE 1.99 COA 1.40 SGN 1.16 MAP 1.00
LLC 1.97 ABC 1.40 CEU 1.15 MOF 1.00
NHC 1.95 CPU 1.37 SGP 1.15 CEUCA 1.00
UTB 1.94 MCG 1.37 RCL 1.15 MDT 1.00
KCN 1.89 STO 1.37 HDF 1.15 MGX 1.00
WAN 1.87 RIN 1.36 ZFX 1.14 EPT 1.00
ILU 1.86 CIY 1.35 PPX 1.13