Table of Contents
2
Management’s Discussion and Analysis
36
Interim Consolidated Financial Statements
mitted to acquiring and building high-quality businesses. Onex has completed more than 280
acqui-sitions with a total value of approximately $43 billion. Employing a value-oriented and active
ownership investment approach in acquiring and building industry-leading businesses in
partner-ship with talented management teams, Onex has generated 3.4 times the capital it has invested and
managed, earning a 29 percent compound IRR on realized and publicly traded investments.
As an investor first and foremost, Onex
invests its $4.1 billion of proprietary capital
largely through Onex Partners, its flagship
private equity platform. Onex also invests
through ONCAP, its mid-market private
equity platform, Onex Real Estate Partners
and Onex Credit Partners. Onex is in
excel-lent financial condition, with ample cash on
hand and no debt at the parent company.
Onex is entrusted with third-party capital
from institutional investors from around
the world. The Company currently has
approximately US$7.9 billion of invested
and committed capital that it manages on
behalf of these limited partners. In return,
Onex receives a stable and growing stream
of annual management fees that offsets
the ongoing operating expenses. In
addi-tion, Onex is entitled to a share of the
profits on the capital it manages for these
investors. This is commonly referred to as
carried interest. Carried interest, if
real-ized, could significantly enhance Onex’
investment returns.
Onex is a public company whose shares
trade on the Toronto Stock Exchange under
the symbol OCX.
Throughout this report, all amounts are in Canadian dollars unless otherwise indicated.
Investments are valued at fair value as at June 30, 2010 with the exception of a limited number of Onex direct investments held at cost.
Onex Credit Partners 3% Mid-cap Private Equity 4% Onex Real Estate 2%
Cash and Near-cash Items 24%
Large-cap Private Equity 67%
Public 16% Private 51%
How Onex’ $4.1 billion of Capital is Deployed at June 30, 2010
Onex Credit Partners 8%
ONCAP 4%
Onex Partners II 28% Onex Partners I 17%
Onex Partners III 43%
The Components of Onex’ US$7.9 billion of Third-Party Assets under Management at June 30, 2010
The interim MD&A is presented in the following sections:
3
Industry Segments
6
Financial Review
6
Consolidated Operating Results
25
Consolidated Financial Position
30
Liquidity and Capital Resources
33
Transition to International Financial Reporting Standards
34
Disclosure Controls and Procedures and Internal Controls over Financial Reporting
35
Outlook
Onex Corporation’s interim financial filings, including Quarterly 2010 MD&A and Financial Statements, and
Annual Reports, Annual Information Form and Management Information Circular, are available on Onex’
website,
www.onex.com
, or on the Canadian System for Electronic Document Analysis and Retrieval (“SEDAR”)
at www.sedar.com.
Forward-Looking/Safe Harbour Statements
This interim MD&A may contain, without limitation, statements concerning possible or assumed future operations, performance or results preceded by, followed by or that include words such as “believes”, “expects”, “potential”, “anticipates”, “estimates”, “intends”, “plans” and words of similar connotation, which would constitute forward-looking statements. Forward-looking statements are not guarantees. The reader should not place undue reliance on forward-looking statements and information because they involve risks and uncertainties that may cause actual operations, performance or results to be materially different from those indicated in these forward-looking statements. Onex is under no obligation to update any forward-looking statements contained herein should material facts change due to new information, future events or other factors. These cautionary statements expressly qualify all forward-looking statements in this interim MD&A.
Cautionary Statement Regarding Use of Non-GAAP Accounting Measures
This interim MD&A makes reference to operating earnings. Onex uses operating earnings as a measure to evaluate each operating company’s performance because it eliminates interest charges, which are a function of the operating company’s particular financing structure, as well as certain non-cash charges including stock-based compensation, amortization of intangible assets and any unusual or non-recurring charges. Onex’ method of determining operating earnings may differ from other companies’ methods and, accordingly, operating earnings may not be comparable to measures used by other companies. Operating earnings is not a performance measure under Canadian GAAP and should not be considered either in isolation of, or as a substitute for, net earnings prepared in accordance with Canadian GAAP.
earnings, the unaudited interim consolidated balance sheet and the unaudited interim consolidated
statements of cash flows of Onex Corporation (“Onex”). As such, this interim MD&A should be read in
conjunction with the unaudited interim consolidated financial statements and notes thereto of this
report. The interim MD&A and the Onex unaudited interim consolidated financial statements have
been prepared to provide information on Onex on a consolidated basis and should not be considered
as providing sufficient information to make an investment decision in regard to any particular Onex
operating company.
The following interim MD&A is the responsibility of management and is as of August 11, 2010.
The Board of Directors carries out its responsibility for the review of this disclosure through its Audit
and Corporate Governance Committee, comprised exclusively of independent directors. The Audit
and Corporate Governance Committee has reviewed and approved the disclosure.
At June 30, 2010, Onex had seven reportable industry segments. A description of our operating
companies by industry segment, and the managed, economic and voting ownership of Onex in
those businesses, is presented below.
Industry Segments Companies Onex Manages(a) Onex’ Economic/ Voting Ownership Electronics Manufacturing Services
Celestica Inc. (TSX/NYSE: CLS), a global provider of electronics manufacturing services (website: www.celestica.com).
Onex shares held: 17.8 million
– 8%(b)/69%
Aerostructures Spirit AeroSystems, Inc. (NYSE: SPR), the world’s largest independent designer and manufacturer of aerostructures (website: www.spiritaero.com).
Onex shares held: 8.6 million
Onex Partners I shares subject to a carried interest: 17.2 million
23% 6%(b)
/76%
Healthcare Emergency Medical Services Corporation (NYSE:EMS), the leading provider of emergency medical services in the United States (website: www.emsc.net).
Onex shares held: 4.8 million
Onex Partners I shares subject to a carried interest: 7.0 million
Center for Diagnostic Imaging, Inc.,a U.S. provider of diagnostic and therapeutic radiology services (website: www.cdiradiology.com).
Total Onex, Onex Partners I and Onex management investment at cost: $88 million (US$73 million)
Onex portion: $21 million (US$17 million)
Onex Partners I portion subject to a carried interest: $64 million (US$53 million) Skilled Healthcare Group, Inc. (NYSE: SKH), an organization of skilled nursing and assisted living facilities operators in the United States (website:
www.skilledhealth caregroup.com).
Onex shares held: 3.5 million
Onex Partners I shares subject to a carried interest: 10.7 million
Carestream Health, Inc.,a global provider of medical and dental imaging and health-care information technology solutions (website: www.health-carestreamhealth.com).
Total Onex, Onex Partners II and Onex management investment at cost: $521 million (US$471 million)
Onex portion: $206 million (US$186 million)
Onex Partners II portion subject to a carried interest: $292 million (US$266 million) Res-Care, Inc.(c)(NASDAQ: RSCR), the largest U.S. provider of residential, training,
educational and support services for people with disabilities and special needs (website: www.rescare.com).
Onex shares held: 2.0 million
Onex Partners I shares subject to a carried interest: 6.2 million
31% 81% 40% 97% 25% 11%(b)/82% 19%/100% 9%/89% 38%/100% 6%/–(d)
(a) “Onex manages” represents the economic ownership collectively held by Onex and the third-party limited partners of the Onex Partners Funds. (b) Onex’ economic ownership percentage excludes shares held in connection with the Management Investment Plan.
(c) This investment is accounted for on an equity basis in Onex’ unaudited interim consolidated financial statements.
(d) Onex has certain contractual rights and protections, including the right to appoint members to the Board of Directors, in respect of this entity, which is an equity-accounted investment.
Segments Companies Manages(a)
Ownership Financial
Services
The Warranty Group, Inc.,the world’s largest provider of extended warranty contracts (web site: www.thewarrantygroup.com).
Total Onex, Onex Partners I, Onex Partners II and Onex management investment at cost: $556 million (US$488 million)
Onex portion: $175 million (US$154 million)
Onex Partners I portion subject to a carried interest: $204 million (US$178 million) Onex Partners II portion subject to a carried interest: $155 million (US$137 million)
93% 29%/100%
Customer Support Services
Sitel Worldwide Corporation,a global provider of outsourced customer care services (website: www.sitel.com).
Onex investment at cost: $340 million (US$251 million)
– 66%/88%
Metal Services
TMS International Corp.,a leading provider of outsourced industrial services to steel mills globally (website: www.tubecityims.com).
Total Onex, Onex Partners II and Onex management investment at cost: $277 million (US$235 million)
Onex portion: $109 million (US$93 million)
Onex Partners II portion subject to a carried interest: $156 million (US$133 million)
91% 36%/100% Other Businesses • Aircraft & Aftermarket • Commercial Vehicles • Injection Molding • Gaming
Hawker Beechcraft Corporation (b),the largest privately owned designer and
manufac-turer of business jet, turboprop and piston aircraft (website: www.hawkerbeechcraft.com).
Total Onex, Onex Partners II and Onex management investment at cost: $620 million (US$537 million)
Onex portion: $244 million (US$212 million)
Onex Partners II portion subject to a carried interest: $350 million (US$303 million) Allison Transmission, Inc. (b),the world leader in the design and manufacture of
automatic transmissions for on-highway trucks and buses, off-highway equipment and military vehicles (website: www.allisontransmission.com).
Total Onex, Onex Partners II, certain limited partners and Onex management investment at cost: $805 million (US$763 million)
Onex portion: $250 million (US$237 million)
Onex Partners II portion subject to a carried interest: $357 million (US$339 million) Husky International Ltd., the leading global supplier of injection molding equipment and services to the PET plastics industry (website: www.husky.ca).
Total Onex, Onex Partners I, Onex Partners II and Onex management investment at cost: $626 million (US$622 million)
Onex portion: $226 million (US$225 million)
Onex Partners I portion subject to a carried interest: $97 million (US$96 million) Onex Partners II portion subject to a carried interest: $278 million (US$276 million) Tropicana Las Vegas, Inc., located directly on the Las Vegas Strip, is one of the best-known casinos in Las Vegas (www.troplv.com).
Total Onex, Onex Partners III and Onex management investment at cost: $270 million (US$250 million)
Onex portion: $59 million (US$54 million)
Onex Partners III portion subject to a carried interest: $190 million (US$176 million)
49% 49% 98% 74% 19%/–(c) 15%/–(c) 36%/100% 16%/74%
(a) “Onex manages” represents the economic ownership collectively held by Onex and the third-party limited partners of the Onex Partners Funds. (b) These investments are accounted for on an equity basis in Onex’ unaudited interim consolidated financial statements.
(c) Onex has certain contractual rights and protections, including the right to appoint members to the Board of Directors, in respect of these entities, which are equity-accounted investments.
Segments Companies Manages(a) Ownership Other Businesses (cont’d) • Building Products • Mid-cap Opportunities • Real Estate • Credit Securities
RSI Home Products, Inc.(b), a leading manufacturer of kitchen, bathroom and home
organization cabinetry sold through home centre retailers, independent kitchen and bath dealers and other distributors (www.rsiholdingcorp.com).
Total Onex, Onex Partners II and Onex management investment at cost: $338 million (US$318 million)
Onex portion: $133 million (US$126 million)
Onex Partners II portion subject to a carried interest: $190 million (US$179 million) ONCAP, a private equity fund focused on acquiring and building the value of mid-capital-ization companies based in North America (website: www.oncap.com). ONCAP II actively manages investments in CSI Global Education Inc., EnGlobe Corp. (TSX: EG), Mister Car Wash, CiCi’s Pizza and Caliber Collision Centers.
Total Onex, ONCAP II and Onex management investment at cost: $265 million Onex portion: $117 million
ONCAP II portion: $132 million
Onex Real Estate Partners, a platform dedicated to acquiring and improving real estate assets in North America.
Onex investment in Onex Real Estate transactions at cost: $235 million (US$220 million) (d)
Onex Credit Partnersspecializes in managing credit-related investments, including event-driven, long/short and market dislocation strategies.
Onex investment in Onex Credit Partners’ funds at market: $256 million (US$241 million), of which $159 million (US$149 million) is in an Onex Credit Partners’ unleveraged senior secured loan portfolio that purchases assets with greater liquidity
50% – – – 20%/50%(c) 44%/100% 86%/100% 50%(e)/50%(e)
(a) “Onex manages” represents the economic ownership collectively held by Onex and the third-party limited partners of the Onex Partners Funds. (b) This investment is accounted for on an equity basis in Onex’ unaudited interim consolidated financial statements.
(c) Onex has certain contractual rights and protections, including the right to appoint members to the Board of Directors, in respect of this entity, which is an equity-accounted investment.
(d) Investment at cost in Onex Real Estate excludes Onex’ investment in Town and Country properties as Town and Country has been substantially realized and has returned all of Onex’ invested capital.
C O N S O L I D A T E D O P E R A T I N G R E S U L T S This section should be read in conjunction with the unau-dited interim consolidated statements of earnings for the three and six months ended June 30, 2010 and 2009, the corresponding notes thereto and the December 31, 2009 audited annual consolidated financial statements.
Critical accounting policies and estimates
Onex prepares its financial statements in accordance with Canadian generally accepted accounting principles (“GAAP”). The preparation of these financial statements in confor mity with Canadian GAAP requires management of Onex and management of the operating companies to make estimates and assumptions that affect the reported amounts of assets and liabilities, disclosures of contingent assets and liabilities, and the reported amounts of revenues and expenses for the period of the unaudited interim consoli-dated financial statements. Significant accounting policies and methods used in the preparation of the unaudited interim consolidated financial statements are described in note 1 to the December 31, 2009 audited annual con -solidated financial statements. There were no significant changes in accounting policies in the six months ended June 30, 2010. Onex and its operating companies evaluate their estimates and assumptions on a regular basis based on historical experience and other relevant factors. In cluded in Onex’ unaudited interim consolidated financial state-ments are estimates used in determining the allowance for doubtful accounts, inventory valuation, the valuation of deferred taxes, intangible assets and goodwill, the useful lives of property, plant and equipment and intangible assets, revenue recognition under contract accounting, pension and post-employment benefits, losses and loss adjustment expenses reserves, restructuring costs, litigation liability reserves and other matters. Actual results could differ materially from those estimates and assumptions.Variability of results
Onex’ unaudited interim consolidated operating results may vary substantially from year to year for a number of reasons, including some of the following: the current economic envi-ronment; acquisitions or dispositions of businesses by Onex, the parent company; the volatility of the exchange rate between the Canadian dollar and certain foreign currencies, primarily the U.S. dollar; the change in market value of stock-based compensation for both the parent company and its operating companies; changes in the market value of Onex’ publicly traded operating companies; changes in tax legislation or in the application of tax legislation and activi-ties at Onex’ operating companies. These activiactivi-ties may include the purchase or sale of businesses; fluctuations in customer demand, materials and employee-related costs; changes in the mix of products and services produced or delivered; changes in the financing of the business, impair-ments of goodwill, intangible assets or long-lived assets; litigation; and charges to restructure operations.
U.S. dollar to Canadian dollar exchange rate movement
Since most of Onex’ operating companies report in U.S. dollars, the upward or downward movement of the U.S. dollar to Canadian dollar exchange rate for the three and six months ended June 30, 2010 compared to the same pe riods last year will affect Onex’ reported consolidated results of operations. During the second quarter of 2010, the average U.S. dollar to Canadian dollar exchange rate was 1.0276 Canadian dollars, approximately 12 percent lower compared to 1.1672 Canadian dollars for the second quarter of 2009. For the six months ended June 30, 2010, the average U.S. dollar to Canadian dollar exchange rate was 1.0343 Canadian dollars, 14 percent lower compared to 1.2062 Canadian dollars for the first half of 2009.
This section discusses the significant changes in Onex’ unaudited interim consolidated
state-ments of earnings and unaudited interim consolidated statestate-ments of cash flows for the three and
six months ended June 30, 2010 compared to those for the same periods ended June 30, 2009
and compares Onex’ financial condition at June 30, 2010 to that at December 31, 2009.
2010 market environment
During the first six months of 2010, we began to see a reasonable recovery in the economy. A number of our oper-ating companies have reported improved operoper-ating results from higher revenues in the first half of this year compared to the same period last year. In particular, TMS Inter -national, which serves the steel manufacturing industry, recorded meaningful increases in revenues across all its service lines. A number of our businesses were active in refi-nancing debt and retiring debt. Celestica repurchased the remaining notes it had outstanding, is now debt-free and holds substantial cash resources. Our businesses continued to grow, with EMSC, Skilled Healthcare Group and Care -stream Health each completing add-on acquisitions.
Tropicana Las Vegas second rights offering
In April 2010, Tropicana Las Vegas completed a second rights offering of US$50 million. Onex, Onex Partners III and Onex management invested an additional US$45 mil-lion in Tropicana Las Vegas, of which Onex’ share was US$10 million. This was completed through an issue of pre-ferred shares that have similar terms to the 2009 rights offering, that accrue dividends at a rate of 12.5 percent and that are convertible into common shares of Tropicana Las Vegas at a fixed ratio including accrued and unpaid dividends. After giving effect to the offering, Onex, Onex Part -ners III and Onex management own, on an as-converted basis at June 30, 2010, approximately 74 percent of Tropi -cana Las Vegas, of which Onex’ share was 16 percent.
Consolidation of Flushing Town Center
In the first quarter of 2010, a subsidiary of Onex became the managing partner of the Flushing Town Center joint venture, at which point Onex began consolidating its interest. Previously, Onex accounted for its interest in Flushing Town Center using the equity method. Flushing Town Center is a mixed-use development located just outside Manhattan in New York City. The development is being constructed in two phases and will consist of approxi-mately 800,000 square feet of retail space, a 2,500-space parking structure and approximately 1,100 condominium units. At June 30, 2010, Onex had a carrying value of $25 mil-lion in Flushing Town Center.
Acquisitions and dispositions
Skilled Healthcare Group acquisition
On May 1, 2010, Skilled Healthcare Group, Inc. (“Skilled Healthcare Group”) acquired five Medicare-certified hos-pice companies and four Medicare-certified home health com panies that are located in Arizona, Idaho, Montana and Nevada. The total purchase price for these companies was US$63 million. Skilled Healthcare Group funded approxi-mately US$43 million in cash, of which US$30 million was drawn from the company’s term loan and the remainder of the cash purchase price was funded from its revolving credit facility. The remainder of the total purchase price was in the form of certain deferred and/or contingent payments payable over a three- to five-year period.
There were no dispositions completed in the first six months of 2010.
R E V I E W O F J U N E 3 0 , 2 0 1 0
U N A U D I T E D I N T E R I M C O N S O L I D A T E D F I N A N C I A L S T A T E M E N T S
The discussions that follow review factors that affected Onex’ operating segments and Onex’ unaudited interim consolidated results for the three and six months ended June 30, 2010.
Consolidated revenues and cost of sales
Consolidated revenues were $6.0 billion for the second quarter of 2010, down $90 million, or 1 percent, from the same quarter of 2009. Consolidated cost of sales was $4.8 bil-lion for the three months ended June 30, 2010, a decrease of $80 million, or 2 percent, from the same period of 2009.
For the six months ended June 30, 2010, revenues were $11.8 billion, down $759 million, or 6 percent, from the first half of 2009. Consolidated cost of sales was $9.4 bil-lion for the first six months of 2010, down 5 percent from $9.9 billion for the same period of 2009.
the companies for the three and six months ended June 30, 2010 and 2009. The percentage change in revenues and cost of sales in Canadian dollars and in the functional cur-rency of the companies for those periods is also shown. The discussions of revenues and cost of sales by industry segment that follow are in the companies’ functional cur -rency in order to eliminate the impact of foreign cur-rency translation on those revenues and cost of sales.
The reported revenues and cost of sales of Onex’ U.S.-based operating companies in Canadian dollars may not reflect the true nature of the operating results of those companies due to the translation of those amounts and the associated fluctuation of the U.S. dollar to the Canadian dollar exchange rate. In table 1 below, revenues and cost of sales by industry segment are presented in Canadian dollars as well as in the functional currency of
Revenues by Industry Segment for the Three-Month Period Ended June 30
Revenues
TABLE 1 (Unaudited) ($ millions) Canadian Dollars Functional Currency
Three months ended June 30 2010 2009 Change (%) 2010 2009 Change (%)
Electronics Manufacturing Services $ 1,636 $ 1,621 1 % US$ 1,586 US$ 1,403 13 %
Aerostructures 1,073 1,240 (13)% US$ 1,046 US$ 1,060 (1)%
Healthcare 1,570 1,694 (7)% US$ 1,527 US$ 1,454 5 %
Financial Services 295 342 (14)% US$ 287 US$ 292 (2)%
Customer Support Services 326 453 (28)% US$ 318 US$ 388 (18)%
Metal Services 645 276 134 % US$ 628 US$ 237 165 %
Other(a) 496 505 (2)% C$ 496 C$ 505 (2)%
Total $ 6,041 $ 6,131 (1)%
Results are reported in accordance with Canadian generally accepted accounting principles. These results may differ from those reported by the individual operating companies. (a) 2010 other includes Husky, Tropicana Las Vegas, ONCAP II, Flushing Town Center and the parent company. 2009 other includes Husky, ONCAP II and the parent company. Cost of Sales by Industry Segment for the Three-Month Period Ended June 30
Cost of Sales
(Unaudited) ($ millions) Canadian Dollars Functional Currency
Three months ended June 30 2010 2009 Change (%) 2010 2009 Change (%)
Electronics Manufacturing Services $ 1,501 $ 1,480 1 % US$ 1,455 US$ 1,279 14 %
Aerostructures 892 1,156 (23)% US$ 870 US$ 994 (12)%
Healthcare 1,152 1,229 (6)% US$ 1,121 US$ 1,053 6 %
Financial Services 147 170 (14)% US$ 143 US$ 145 (1)%
Customer Support Services 214 292 (27)% US$ 208 US$ 250 (17)%
Metal Services 594 244 143 % US$ 578 US$ 210 175 %
Other(a) 306 315 (3)% C$ 306 C$ 315 (3)%
Total $ 4,806 $ 4,886 (2)%
Results are reported in accordance with Canadian generally accepted accounting principles. These results may differ from those reported by the individual operating companies. (a) 2010 other includes Husky, Tropicana Las Vegas, ONCAP II, Flushing Town Center and the parent company. 2009 other includes Husky, ONCAP II and the parent company.
Revenues by Industry Segment for the Six-Month Period Ended June 30
Revenues
TABLE 1 (Unaudited) ($ millions) Canadian Dollars Functional Currency
Six months ended June 30 2010 2009 Change (%) 2010 2009 Change (%)
Electronics Manufacturing Services $ 3,216 $ 3,451 (7)% US$ 3,104 US$ 2,872 8 %
Aerostructures 2,159 2,345 (8)% US$ 2,089 US$ 1,947 7 %
Healthcare 3,060 3,361 (9)% US$ 2,958 US$ 2,793 6 %
Financial Services 619 707 (12)% US$ 598 US$ 586 2 %
Customer Support Services 699 948 (26)% US$ 676 US$ 785 (14)%
Metal Services 1,135 659 72% US$ 1,099 US$ 545 102 %
Other(a) 953 1,129 (16)% C$ 953 C$ 1,129 (16)%
Total $ 11,841 $ 12,600 (6)%
Results are reported in accordance with Canadian generally accepted accounting principles. These results may differ from those reported by the individual operating companies. (a) 2010 other includes Husky, Tropicana Las Vegas, ONCAP II, Flushing Town Center and the parent company. 2009 other includes CEI, Husky, ONCAP II and the parent company. Cost of Sales by Industry Segment for the Six-Month Period Ended June 30
Cost of Sales
(Unaudited) ($ millions) Canadian Dollars Functional Currency
Six months ended June 30 2010 2009 Change (%) 2010 2009 Change (%)
Electronics Manufacturing Services $ 2,949 $ 3,145 (6)% US$ 2,846 US$ 2,616 9 %
Aerostructures 1,801 2,042 (12)% US$ 1,743 US$ 1,705 2 %
Healthcare 2,256 2,450 (8)% US$ 2,181 US$ 2,036 7 %
Financial Services 295 349 (15)% US$ 285 US$ 289 (1)%
Customer Support Services 453 607 (25)% US$ 438 US$ 503 (13)%
Metal Services 1,045 590 77% US$ 1,011 US$ 488 107 %
Other(a) 576 724 (20)% C$ 576 C$ 724 (20)%
Total $ 9,375 $ 9,907 (5)%
Results are reported in accordance with Canadian generally accepted accounting principles. These results may differ from those reported by the individual operating companies. (a) 2010 other includes Husky, Tropicana Las Vegas, ONCAP II, Flushing Town Center and the parent company. 2009 other includes CEI, Husky, ONCAP II and the parent company.
Aerostructures
Spirit AeroSystems, Inc. (“Spirit AeroSystems”) reported rev-enues of US$1.0 billion for the second quarter of 2010, essen-tially the same as the quarter last year. Cost of sales was down 12 percent to US$870 million (2009 – $994 million) for the second quarter of 2010. The decrease in cost of sales in the quarter compared to the same quarter last year was substantially due to US$137 million of unusual charges incurred in the second quarter of 2009 primarily related to a forward loss charge on the company’s Gulf stream G-250 contract, as well as an unfavour able cumulative catch-up adjustment on program costs of US$33 million.
During the first six months of 2010, revenues at Spirit AeroSystems were up 7 percent to US$2.1 billion (2009 – US$1.9 billion). Much of the increase in revenues for the first six months of 2010 was due to higher ship set deliveries to Boeing in the first six months of 2010 com-pared to the same period in 2009. Partially offsetting the revenue increase was US$21 million of favourable volume-based pricing adjustments in the second quarter of 2009 compared to the same period in 2010. Cost of sales was up 2 percent to US$1.7 billion for the six months ended June 30, 2010 from the same period in 2009. Cost of sales as a per-centage of revenues was 83 percent for the first six months of 2010 compared to 88 percent for the same period last year. The decrease was due primarily to the unusual charges of US$137 million recorded in the second quarter of 2009.
Healthcare
The healthcare segment revenues and cost of sales consist of the operations of Emergency Medical Services Cor -poration (“EMSC”), Center for Diagnostic Imaging, Inc. (“CDI”), Skilled Healthcare Group, Inc. (“Skilled Health -care Group”) and Carestream Health, Inc. (“Carestream Health”). Res-Care, Inc. (“ResCare”) is accounted for on an equity basis and, accordingly, that company’s revenues and cost of sales are not consolidated. The healthcare seg-ment reported a 5 percent increase in consolidated rev-enues to US$1.5 billion for the three months ended June 30, 2010 over the same period last year. Cost of sales increased 6 percent to US$1.1 billion in the second quarter of 2010. For the first six months of 2010, consolidated revenues and cost of sales in the healthcare segment were up 6 percent to US$3.0 billion (2009 – US$2.8 billion) and up 7 percent to US$2.2 billion (2009 – US$2.0 billion), respectively.
Electronics Manufacturing Services
Celestica Inc. (“Celestica”) reported a 13 percent increase in revenues in the second quarter of 2010 to US$1.6 billion (2009 – US$1.4 billion). Celestica’s revenue growth was in the following end markets: storage (13 percent); consumer (41 percent); servers (26 percent); industrial, aerospace and defense, and healthcare (23 percent); and enterprise communications (10 percent). These increases were pri mar ily from program wins from new and existing customers and generally increased volumes reflecting an improved eco-nomic environment. Partially offsetting these increases was a 28 percent decline in revenues in Celestica’s telecommuni-cations end market, driven pri mar ily by de clines in demand and customer insourcing.
Cost of sales was US$1.5 billion (2009 – US$1.3 bil-lion) for the three months ended June 30, 2010. Gross profit for the second quarter of 2010 increased 6 percent from the same quarter of 2009 primarily due to increased volumes and benefits from cost reductions, partially offset by changes in product mix. Gross margin as a percentage of revenues decreased in the second quarter of 2010 com-pared to the same quarter of 2009 due primarily to the changes in product mix and pricing.
For the six months ended June 30, 2010, revenues increased 8 percent to US$3.1 billion (2009 – US$2.9 bil-lion) and cost of sales increased 9 percent to US$2.8 billion (2009 – US$2.6 billion). The same factors that contributed to the increases in revenues and cost of sales for the second quarter of 2010 drove the increases in revenues and cost of sales for the first six months of 2010.
Table 2 provides revenues and cost of sales by operating company in the healthcare segment for the three and six months ended June 30, 2010 and 2009 in both Canadian dollars and the companies’ functional currency.
Healthcare Revenues and Cost of Sales for the Three-Month Period Ended June 30
Revenues
TABLE 2 (Unaudited) ($ millions) Canadian Dollars Functional Currency
Three months ended June 30 2010 2009 Change (%) 2010 2009 Change (%)
Emergency Medical Services $ 729 $ 744 (2)% US$ 709 US$ 637 11 %
Center for Diagnostic Imaging 36 42 (14)% US$ 35 US$ 35 –
Skilled Healthcare Group 206 226 (9)% US$ 201 US$ 194 4 %
Carestream Health 599 682 (12)% US$ 582 US$ 588 (1)%
Total $ 1,570 $ 1,694 (7)% US$ 1,527 US$ 1,454 5 %
Cost of Sales
(Unaudited) ($ millions) Canadian Dollars Functional Currency
Three months ended June 30 2010 2009 Change (%) 2010 2009 Change (%)
Emergency Medical Services $ 628 $ 638 (2)% US$ 611 US$ 547 12 % Center for Diagnostic Imaging 11 13 (15)% US$ 11 US$ 11 –
Skilled Healthcare Group 171 202 (15)% US$ 167 US$ 171 (2)%
Carestream Health 342 376 (9)% US$ 332 US$ 324 2 %
Total $ 1,152 $ 1,229 (6)% US$ 1,121 US$ 1,053 6 %
Results are reported in accordance with Canadian generally accepted accounting principles. These results may differ from those reported by the individual operating companies.
Healthcare Revenues and Cost of Sales for the Six-Month Period Ended June 30
Revenues
TABLE 2 (Unaudited) ($ millions) Canadian Dollars Functional Currency
Six months ended June 30 2010 2009 Change (%) 2010 2009 Change (%)
Emergency Medical Services $ 1,436 $ 1,507 (5)% US$ 1,388 US$ 1,250 11 % Center for Diagnostic Imaging 71 84 (15)% US$ 69 US$ 69 –
Skilled Healthcare Group 403 462 (13)% US$ 390 US$ 383 2 %
Carestream Health 1,150 1,308 (12)% US$ 1,111 US$ 1,091 2 %
Total $ 3,060 $ 3,361 (9)% US$ 2,958 US$ 2,793 6 %
Cost of Sales
(Unaudited) ($ millions) Canadian Dollars Functional Currency
Six months ended June 30 2010 2009 Change (%) 2010 2009 Change (%)
Emergency Medical Services $ 1,239 $ 1,300 (5)% US$ 1,198 US$ 1,079 11 % Center for Diagnostic Imaging 23 27 (15)% US$ 22 US$ 22 –
Skilled Healthcare Group 334 392 (15)% US$ 323 US$ 326 (1)%
Carestream Health 660 731 (10)% US$ 638 US$ 609 5 %
Total $ 2,256 $ 2,450 (8)% US$ 2,181 US$ 2,036 7 %
Emergency Medical Services
EMSC’s second-quarter revenues increased US$72 million, or 11 percent, to US$709 million from US$637 million in the same quarter of 2009. The revenue growth was due primarily to increases in rates and volumes on existing contracts com-bined with volume from net new contracts and acquisitions. Cost of sales grew 12 percent to US$611 million (2009 – US$547 million) for the three months ended June 30, 2010, consistent with the revenue growth in the quarter.
For the six months ended June 30, 2010, rev-enues at EMSC were up 11 percent to US$1.4 billion (2009 – US$1.3 billion). Cost of sales was up 11 percent to US$1.2 bil lion (2009 – US$1.1 billion). The same factors that contributed to the second-quarter revenue and cost of sales growth were the drivers in the first six months of 2010. Cost of sales as a percentage of revenues remained unchanged at 86 percent for the six months ended June 30, 2010 compared to the same period last year.
Carestream Health
Carestream Health reported a 1 percent decrease in rev-enues to US$582 million for the three months ended June 30, 2010 (2009 – US$588 million). The decline in rev-enues in the quarter was due to the anticipated reduction in Carestream Health’s traditional film business. This was partially offset by higher revenues from its digital dental and medical businesses. Cost of sales was US$332 million for the three months ended June 30, 2010, up 2 percent from US$324 million for the second quarter of 2009. Cost of sales increased as a result of higher commodities’ costs for polyester and silver used in the production of film.
For the six months ended June 30, 2010, revenues at Carestream Health increased 2 percent to US$1.1 billion while cost of sales was up 5 percent to US$638 million (2009 – US$609 million). Since Carestream Health has oper ations worldwide, approximately US$22 million of the revenue increase was due to favourable foreign exchange rates on its non-U.S. revenues. Excluding the impact of foreign exchange, the company reported an increase in revenues of US$36 million from its growing digital medical and dental businesses. Partially offsetting this increase was a US$35 million decline in revenues from the anticipated reduction in its traditional film business. Gross profit for the first six months of 2010 was US$473 million compared to US$482 million in the same period last year. Gross profit
decreased compared to last year due to higher commodi-ties costs of US$45 million for polyester and silver used in the production of film. These increased costs were partially offset by the favourable impact of foreign exchange of US$18 million and higher produc tivity across the businesses.
Financial Services
The Warranty Group, Inc. (“The Warranty Group”) reported revenues of US$287 million for the second quarter of 2010, down 2 percent, or US$5 million, from US$292 million for the three months ended June 30, 2009. Revenues decreased in the second quarter due to anticipated lower earned premiums stemming from the lower level of U.S. auto sales in prior periods, which more than offset higher earned pre-miums from International Opera tions. In addition, currency translation of European revenues reduced revenues by approximately US$2 million in the second quarter of 2010 as a result of the weakening in the value of the euro relative to the U.S. dollar. Cost of sales was US$143 million for the sec-ond quarter of 2010, down 1 percent, or US$2 million, from US$145 million for the three months ended June 30, 2009 due primarily to the decrease in earned revenues.
For the first half of 2010, revenues at The Warranty Group increased 2 percent to US$598 million (2009 – US$586 million) while cost of sales was down 1 percent to US$285 million (2009 – US$289 million). Revenues for the first half of 2010 increased primarily from resumed global economic growth and new client wins. The decline in cost of sales for the six months ended June 30, 2010 was driven by the same factors that contributed to the change in the second quarter.
Customer Support Services
Sitel Worldwide Corporation (“Sitel Worldwide”) reported revenues of US$318 million for the three months ended June 30, 2010, down 18 percent, or US$70 million, from US$388 million for the same period of 2009. The decline was due primarily to lower call volumes with existing customers associated with lower consumer spending and the disen-gagement of certain customers by Sitel World wide. Cost of sales was US$208 million for the second quarter of 2010, down 17 percent, or US$42 million, from US$250 million for the same period of 2009. This decline resulted from the company adjusting its cost structure to correspond with decreased activity.
Other Businesses Revenues and Cost of Sales for the Three-Month Period Ended June 30
Revenues
TABLE 3 (Unaudited) ($ millions) Canadian Dollars Functional Currency
Three months ended June 30 2010 2009 Change (%) 2010 2009 Change (%)
Husky $ 277 $ 277 – US$ 269 US$ 237 14 %
ONCAP II companies 202 220 (8)% US$ 197 US$ 188 5 %
Other(a) 17 8 113 % C$ 17 C$ 8 113 %
Total $ 496 $ 505 (2)%
Cost of Sales
(Unaudited) ($ millions) Canadian Dollars Functional Currency
Three months ended June 30 2010 2009 Change (%) 2010 2009 Change (%)
Husky $ 194 $ 188 3 % US$ 188 US$ 162 16 %
ONCAP II companies 111 126 (12)% US$ 108 US$ 108 –
Other(a) 1 1 – C$ 1 C$ 1 –
Total $ 306 $ 315 (3)%
(a) 2010 other includes Flushing Town Center, Tropicana Las Vegas and the parent company. 2009 other includes the parent company.
For the six months ended June 30, 2010, rev-enues decreased 14 percent to US$676 million (2009 – US$785 million) due primarily to the same factors that contributed to the 2010 second-quarter revenue decline. Partially offsetting the decline in revenues for the first six months of 2010 was a US$17 million increase in revenues from favourable foreign exchange rates on Sitel World wide’s nonU.S. revenues. Lower revenues drove a cor -responding decrease in cost of sales of 13 percent to US$438 million (2009 – US$503 million).
Metal Services
Revenues at TMS International Corp. (“TMS International”), formerly Tube City IMS Corporation, were US$628 mil-lion for the second quarter of 2010, up 165 percent, or US$391 million, from US$237 million for the second quarter of 2009. The vast majority of the increase was attributable to higher levels of steel pro duction, which drove increased demand for raw materials and resulted in significantly higher sales volume in the outsourced purchasing business. The higher levels of steel production also directly affected TMS International’s service revenues, which are typically charged to customers based on tons of raw steel produced. The increase in steel production activity resulted in a 51 percent increase in TMS International’s ser vice revenues.
Cost of sales was US$578 million for the three months ended June 30, 2010, up 175 percent from US$210 mil-lion in the second quarter of 2009. Although raw materials procurement activities increased by approximately 107 per-cent, as demand increased, the margins derived from cer-tain activities declined as some of the increase in volume was in lower average margin materials.
For the six months ended June 30, 2010, revenues were up 102 percent to US$1.1 billion (2009 – US$545 mil-lion), while cost of sales increased 107 percent to US$1.0 bil-lion (2009 – US$488 milbil-lion). The increases in both revenues and cost of sales were driven by the same factors that affected the second quarter of 2010.
Other Businesses
The other businesses segment primarily includes the rev-enues of Husky International Ltd. (“Husky”), Tropicana Las Vegas and the ONCAP II companies – CSI Global Education Inc. (“CSI”), EnGlobe Corp. (“EnGlobe”), Mister Car Wash, CiCi’s Pizza and Caliber Collision Centers (“Caliber Colli -sion”). Table 3 provides revenues and cost of sales by oper-ating company in the other businesses segment for the three and six months ended June 30, 2010 and 2009 in both Canadian dollars and the companies’ functional currency.
Other Businesses Revenues and Cost of Sales for the Six-Month Period Ended June 30 (cont’d)
Revenues
TABLE 3 (Unaudited) ($ millions) Canadian Dollars Functional Currency
Six months ended June 30 2010 2009 Change (%) 2010 2009 Change (%)
Husky $ 527 $ 636 (17)% US$ 509 US$ 525 (3)%
ONCAP II companies 394 427 (8)% US$ 381 US$ 354 8 %
Other(a) 32 66 (52)% C$ 32 C$ 66 (52)%
Total $ 953 $ 1,129 (16)%
Cost of Sales
(Unaudited) ($ millions) Canadian Dollars Functional Currency
Six months ended June 30 2010 2009 Change (%) 2010 2009 Change (%)
Husky $ 359 $ 440 (18)% US$ 347 US$ 364 (5)%
ONCAP II companies 215 239 (10)% US$ 208 US$ 199 5 %
Other(a) 2 45 (96)% C$ 2 C$ 45 (96)%
Total $ 576 $ 724 (20)%
(a) 2010 other includes Flushing Town Center, Tropicana Las Vegas and the parent company. 2009 other includes CEI and the parent company.
Revenues in the other businesses segment were down 2 percent to $496 million (2009 – $505 million) for the second quarter of 2010. Cost of sales for the other busi-nesses segment was down 3 percent to $306 million (2009 – $315 million) for the three months ended June 30, 2010. Husky reported a 14 percent increase in revenues to US$269 million (2009 – US$237 million) in the second quarter due primarily to higher sales in Europe, Asia Pacific and Latin America, partially offset by lower sales in North America. Higher revenues at Husky resulted in a similar increase in cost of sales of 16 percent to US$188 million in the second quarter of 2010.
The ONCAP II companies reported a 5 percent increase in revenues for the second quarter of 2010, due pri -marily to higher sales revenues at CSI and Caliber Collision resulting from those businesses beginning to benefit from improved economic activity.
For the six months ended June 30, 2010, revenues were down 16 percent to $953 million (2009 – $1.1 billion). Cost of sales had a similar decline of 20 percent to $576 mil-lion (2009 – $724 milmil-lion). Husky’s revenues declined US$16 million for the six months ended June 30, 2010. Cost of sales at Husky declined 5 percent (US$17 million) to US$347 million (2009 – US$364 million) for the first six months of 2010. The declines in revenues and cost of sales at Husky were driven by lower sales in the first half of 2010 in North America and Europe, partially offset by higher sales in Asia Pacific and Latin America.
Tropicana Las Vegas, acquired in July 2009, con-tributed US$14 million and US$1 million in revenues and cost of sales, respectively, in the second quarter of 2010. For the six months ended June 30, 2010, Tropicana Las Vegas added revenues in the other segment of US$27 million and cost of sales of US$2 million.
Operating earnings
Management at Onex reviews the performance of individ-ual operating companies based on an operating earnings measure. Onex uses operating earnings as a measure to evaluate each operating company’s performance because it eliminates interest charges, which are a function of the operating company’s particular financing structure, as well as certain non-cash charges including stock-based compensation, amortization of intangible assets and any unusual or non-recurring charges. Operating earnings is not a defined measure under Canadian GAAP. The term operating earnings, as used here, is defined as earnings
before interest expense, amortization of intangible assets and deferred charges, and income taxes. Onex also excludes from operating earnings accounting measures that do not reflect the actual operating performance of the business, such as earnings (loss) from equity-accounted investments, foreign exchange gains (loss), stock-based compensation recovery (expense), non-recurring items such as gains on dispositions of operating investments, acquisition and restructuring charges, other income, writedown of good-will, intangible assets and long-lived assets, as well as non-controlling interests.
Table 4 provides a reconciliation of the unaudited interim consolidated statements of earnings to operating earnings for the three and six months ended June 30, 2010 and 2009.
Operating Earnings Reconciliation
Three months ended June 30 Six months ended June 30
TABLE 4 (Unaudited) ($ millions) 2010 2009 2010 2009
Earnings before the undernoted items $ 617 $ 552 $ 1,198 $ 1,230
Amortization of property, plant and equipment (129) (160) (260) (330)
Interest income 5 19 12 34
Operating earnings $ 493 $ 411 $ 950 $ 934 Amortization of intangible assets and deferred charges (82) (94) (166) (196)
Interest expense of operating companies (121) (131) (225) (284)
Loss from equity-accounted investments (21) (56) (44) (46)
Foreign exchange gains (loss) 30 (35) (9) (30)
Stock-based compensation recovery (expense) 10 (63) (72) (57)
Other income 22 85 24 68
Gains on dispositions of operating investments, net – 184 – 184
Acquisition, restructuring and other expenses (46) (52) (77) (96)
Writedown of goodwill, intangible assets and long-lived assets (2) (114) (2) (114) Earnings before income taxes and non-controlling interests $ 283 $ 135 $ 379 $ 363
Table 5 provides a breakdown of and the change in operating earnings (loss) by industry segment in Canadian dollars and the companies’ functional currency for the three and six months ended June 30, 2010 and 2009.
Operating Earnings (Loss) by Industry Segment for the Three-Month Period Ended June 30
TABLE 5 (Unaudited) ($ millions) Canadian Dollars Functional Currency
Three months ended June 30 2010 2009 Change ($) 2010 2009 Change ($)
Electronics Manufacturing Services $ 59 $ 54 $ 5 US$ 57 US$ 48 US$ 9
Aerostructures 109 2 107 US$ 106 US$ (4) US$ 110
Healthcare 213 224 (11) US$ 206 US$ 192 US$ 14
Financial Services 43 43 – US$ 41 US$ 37 US$ 4
Customer Support Services 11 25 (14) US$ 10 US$ 22 US$ (12)
Metal Services 23 5 18 US$ 22 US$ 4 US$ 18
Other(a) 35 58 (23) C$ 35 C$ 58 C$ (23)
Total $ 493 $ 411 $ 82
Results are reported in accordance with Canadian generally accepted accounting principles. These results may differ from those reported by the individual operating companies. (a) 2010 other includes Husky, Tropicana Las Vegas, ONCAP II, Flushing Town Center and the parent company. 2009 other includes Husky, ONCAP II and the parent company.
Operating Earnings (Loss) by Industry Segment for the Six-Month Period Ended June 30
(Unaudited) ($ millions) Canadian Dollars Functional Currency
Six months ended June 30 2010 2009 Change ($) 2010 2009 Change ($)
Electronics Manufacturing Services $ 119 $ 120 $ (1) US$ 115 US$ 101 US$ 14
Aerostructures 217 132 85 US$ 210 US$ 101 US$ 109
Healthcare 385 417 (32) US$ 371 US$ 347 US$ 24
Financial Services 89 85 4 US$ 86 US$ 71 US$ 15
Customer Support Services 33 56 (23) US$ 32 US$ 47 US$ (15)
Metal Services 36 9 27 US$ 35 US$ 7 US$ 28
Other(a)
71 115 (44) C$ 71 C$ 115 C$ (44)
Total $ 950 $ 934 $ 16
Results are reported in accordance with Canadian generally accepted accounting principles. These results may differ from those reported by the individual operating companies. (a) 2010 other includes Husky, Tropicana Las Vegas, ONCAP II, Flushing Town Center and the parent company. 2009 other includes CEI, Husky, ONCAP II and the parent company.
Consolidated operating earnings were $493 million in the second quarter of 2010, up 20 percent, or $82 million, from the second quarter of 2009. Excluding the impact of foreign currency, operating earnings were up due to the following factors:
• Celestica recorded a US$9 million increase in operating earnings in the quarter due primarily to higher rev-enues associated with program wins from new and existing customers as discussed under Revenues and Cost of Sales;
• Spirit AeroSystems reported a US$110 million increase in operating earnings as 2009 included several unusual charges in cost of sales recorded in the second quarter of that year as previously discussed under Revenues and Cost of Sales;
• Improved operating earnings of US$18 million at TMS International in the quarter resulting from the company reporting higher revenues as previously discussed under Revenues and Cost of Sales; and
• EMSC reported a US$6 million increase in oper-ating earnings in the quarter resulting primarily from higher revenues.
Partially offsetting the increases in operating earnings were: • a US$12 million decline in operating earnings at Sitel Worldwide, included in the customer support services segment, due to lower revenues; and
• Tropicana Las Vegas’ operating loss of US$9 million as the company continues to restructure and refurbish its property following Onex’ purchase of the business in July 2009.
For the six months ended June 30, 2010, operating earnings were up slightly to $950 million from $934 million for the first half of 2009. The same factors that contributed to the growth in operating earnings in the quarter contributed to the increase in operating earnings for the first half of 2010.
Interest expense of operating companies
New investments are structured with the acquired com-pany having sufficient equity to enable it to self-finance a significant portion of its acquisition cost with a prudent amount of debt. The level of debt is commensurate with the operating company’s available cash flow, including consideration of funds required to pursue growth oppor-tunities. It is the responsibility of the acquired operating company to service its own debt obligations.
Consolidated interest expense was down $10 mil-lion, or 8 percent, to $121 million in the second quarter of 2010 from $131 million in the same quarter of 2009. A signifi-cant portion of the decline was the effect of foreign currency translation on U.S.dollardenominated interest costs. Ex -cluding the impact of foreign exchange, Celestica recorded a US$10 million decline in interest expense primarily due to debt extinguished in 2009 and from the company’s repur-chase of its outstanding 2013 senior subordinated notes in the first quarter of 2010. Celestica is now debt-free. In addi-tion, Carestream Health recorded a US$17 million decline in interest expense during the three months ended June 30, 2010 due primarily to lower debt as well as lower interest rates in the period compared to the same period last year. Other companies benefitted from lower interest rates on the floating rate portion of their debt.
Partially offsetting these was a US$14 million in crease in interest expense at EMSC in the quarter com-pared to the second quarter last year. Included in EMSC’s second-quarter interest expense was a US$19 million write-off of deferred financing charges associated with its previous debt. The company entered into a new senior credit agreement in April 2010 with the proceeds of the new facilities being used to repay and terminate EMSC’s previous term loan and redeem its senior subordinated notes that had an outstanding balance of US$250 million in the second quarter of 2010.
In addition, interest expense at Skilled Healthcare Group increased by US$8 million in the second quarter of 2010 over the same quarter of 2009 due primarily to the US$7 million writedown of deferred financing charges re -corded in the quarter associated with the company entering into new credit facilities in April 2010. The proceeds were used to repay the prior loans and to fund acquisitions.
For the six months ended June 30, 2010, consoli-dated interest expense totalled $225 million, a decrease of $59 million from the same period last year. The effect of foreign currency translation on U.S.-dollar-denominated interest costs was a significant component of the decrease in the first half of 2010. The same factors that affected interest expense in the second quarter impacted interest expense in the first half of 2010.
Earnings (loss) from
equity-accounted investments
Earnings (loss) from equity-accounted investments for the three and six months ended June 30, 2010 represent Onex’ and Onex Partners’ portion of the earnings (loss) of Allison Transmission, Inc. (“Allison Transmission”); Hawker Beech craft Corporation (“Hawker Beechcraft”); ResCare; RSI Home Products, Inc. (“RSI”); Cypress Insur -ance Group (“Cypress”); Onex Real Estate’s investments in the Camden properties, Urban Housing Platform, Town and Country and NY Credit; and Onex Credit Partners. The first six months of 2009 also included Cineplex Galaxy Income Fund (“Cineplex Entertainment”) and Onex Real Estate’s investment in Flushing Town Center.
During the first three months of 2010, a subsidiary of Onex Real Estate became the managing partner of the Flushing Town Center joint venture. As a result, in the first quarter of 2010, Onex began consolidating its interest in Flushing Town Center. Up to December 31, 2009, Onex accounted for its interest in Flushing Town Center using the equity method.
Onex reported a loss from equity-accounted invest-ments of $21 million and $44 million, respectively, for the three and six months ended June 30, 2010 compared to a loss from equity-accounted investments of $56 million and $46 million, respectively, for the three and six months ended June 30, 2009.
Table 6 details the earnings (loss) from equity-accounted investments by company, as well as Onex’ share of these earnings (loss) for the three and six months ended June 30, 2010 and 2009.
Earnings (Loss) from Equity-accounted Investments
TABLE 6 (Unaudited) ($ millions) Three months ended June 30 2010 2009
Onex’ Share Onex’ Share
Net of Net Net of Net
Earnings Earnings Earnings Earnings (Loss)(a)
(Loss) (Loss)(a)
(Loss) Allison Transmission $ 1 $ 1 $ (138) $ (44) Hawker Beechcraft (28) (11) 79 35 Other(b) 6 4 3 (1) Total $ (21) $ (6) $ (56) $ (10)
(a) The net earnings (loss) represents Onex’ and Onex Partners’ share of the net earnings (loss) in those businesses.
(b) 2010 other includes Cypress, Onex Credit Partners, Onex Real Estate (Camden properties, Urban Housing Platform, Town and Country and NY Credit), ResCare and RSI. 2009 other includes Cypress, Onex Credit Partners, Onex Real Estate (Camden properties, Urban Housing Platform, Town and Country, Flushing Town Center and NY Credit), ResCare and RSI.
(Unaudited) ($ millions) Six months ended June 30 2010 2009
Onex’ Share Onex’ Share
Net of Net Net of Net
Earnings Earnings Earnings Earnings (Loss)(a)
(Loss) (Loss)(a)
(Loss)
Allison Transmission $ 8 $ 3 $ (178) $ (57)
Hawker Beechcraft (60) (24) 122 49
Other(b) 8 6 10 2
Total $ (44) $ (15) $ (46) $ (6)
(a) The net earnings (loss) represents Onex’ and Onex Partners’ share of the net earnings (loss) in those businesses.
(b) 2010 other includes Cypress, Onex Credit Partners, Onex Real Estate (Camden properties, Urban Housing Platform, Town and Country and NY Credit), ResCare and RSI. 2009 other includes Cineplex Entertainment (up to March 31, 2009), Cypress, Onex Credit Partners, Onex Real Estate (Camden properties, Urban Housing Platform, Town and Country, Flushing Town Center and NY Credit), ResCare and RSI.
Allison Transmission
The investment in Allison Transmission contributed $1 mil-lion and $8 milmil-lion, respectively, of earnings from equity-accounted investments for the second quarter and first six months of 2010. Onex’ share was $1 million and $3 mil-lion, respectively, in those periods. Allison Trans mission reported US$2 million and US$16 million, respectively, in net earnings in its functional currency for the three and six months ended June 30, 2010. The primary reason for the change was that the 2009 results included specific write -downs and one-time charges. As well, earnings improved with increased revenues and margins.
For the three and six months ended June 30, 2009, Onex’ and Onex Partners’ share of the Allison Transmission loss was $138 million and $178 million, respectively. Onex’ share was $44 million and $57 million, respectively, of the loss in those periods last year. In the company’s functional currency, Allison Transmission reported a net loss of US$227 million and US$308 million for the three and six months ended June 30, 2009. Included in the loss for those periods in 2009 was a US$190 million writedown of certain intangible assets that Allison Transmission determined to be impaired and a US$37 million writedown of certain long-term receivables and other matters that the company had with General Motors Corporation (“GM”) as a result of the GM bankruptcy.
Hawker Beechcraft
For the three months ended June 30, 2010, Onex’ and Onex Partners’ share of Hawker Beech craft’s loss was $28 million. Onex’ share of the loss was $11 million. This compares to earnings of $79 million for the second quarter of 2009, of which Onex’ share was $35 million. Excluding the impact of foreign exchange translation, Hawker Beechcraft re -ported a US$57 million loss in the second quarter of 2010, of which Onex’ and Onex Partners’ share was US$27 mil-lion. This compares to 2009 second-quarter earnings of US$158 million, of which Onex’ and Onex Partners’ share was US$77 million. The quarter-over-quarter decrease in earnings was due primarily to a US$175 million gain in the second quarter of 2009 on the purchase of US$274 million of the company’s debt securities at a significant discount.
For the six months ended June 30, 2010, Onex’ and Onex Partners’ share of Hawker Beechcraft’s loss was $60 million. Onex’ share of the loss was $24 million. This compares to earnings of $122 million for the six months ended June 30, 2009, of which Onex’ share was $49 mil-lion. The decrease in earnings during the first six months of 2010 was due primarily to a US$352 million gain that occurred during the first half of 2009 on the purchase of US$497 million of the company’s debt securities at a sig-nificant discount.
Foreign exchange gains (loss)
Foreign exchange gains (loss) reflect the impact of changes in foreign currency exchange rates primarily on U.S. cash amounts held. A net foreign exchange gain of $30 million was recorded for the quarter ended June 30, 2010 com-pared to a $35 million foreign exchange loss for the second quarter last year. The gain in the quarter was due primarily to the appreciation of the U.S. dollar relative to the Canadian dollar; the value was 1.0646 Canadian dollars at June 30, 2010, up from 1.0158 Canadian dollars at March 31, 2010. Onex, the parent company, holds a significant por-tion of its cash in U.S. dollars and reported a foreign exchange gain of approximately $38 million in the second quarter of 2010.
For the first six months of 2010, a consolidated foreign exchange loss of $9 million was recorded com-pared to a consolidated foreign exchange loss of $30 mil-lion for the six months ended June 30, 2009. The decline in the value of the euro relative to the U.S. dollar in the first half of 2010 resulted in a foreign exchange loss recorded at Carestream Health (US$8 million) and Sitel Worldwide (US$6 million). In addition, Spirit AeroSystems recorded a US$5 million foreign exchange loss due primarily to the decline in value of the British pound. These losses were partially offset by the foreign exchange gain of $9 million reported by Onex, the parent company, in the first half of 2010, which was mainly due to the appreciation of the U.S. dollar relative to the Canadian dollar to 1.0646 Canadian dollars at June 30, 2010 from 1.0510 Canadian dollars at December 31, 2009.
Stock-based compensation expense (recovery)
During the second quarter of 2010, Onex recorded a con-solidated stock-based compensation recovery of $10 mil-lion compared to a stock-based compensation expense of $63 million for the same quarter of 2009. Onex, the parent company, recorded a stock-based compensation recovery of $45 million in the three months ended June 30, 2010 due to the change in its stock-based compensation liability. Onex is required to revalue the liability for stock options and deferred share units based on changes in the market value of Onex shares. The decrease in Onex’ share price to $25.59 per share at June 30, 2010 from $28.89 per share at March 31, 2010 resulted in a $37 million downward revalu-ation of the liability for stock options and a corresponding recovery. The remaining amount relates to the revaluation of the potential liability under the Management Invest -ment Plan as described in note 24(g) to the December 31, 2009 audited annual consolidated financial statements. This compares to a $45 million stock-based compensation expense at Onex, the parent company, in the second quar-ter of 2009 due primarily to a 29 percent increase in Onex’ share price in that period.For the six months ended June 30, 2010, Onex recorded a consolidated stock-based compensation expense of $72 million compared to a stock-based compensation expense of $57 million for the same period in 2009. Onex, the parent company, accounted for $22 million of the expense in the first six months of 2010 compared to $25 mil-lion of the expense for the six months ended June 30, 2009. During the first six months of 2010, the market value of Onex shares increased 8 percent to $25.59 per share at June 30, 2010 from $23.60 per share at December 31, 2009. This com-pares to a 10 percent increase in the market value of Onex shares for the first six months of 2009 when the market value of Onex shares increased to $20.00 per share at June 30, 2009 from $18.19 per share at December 31, 2008.
Other income
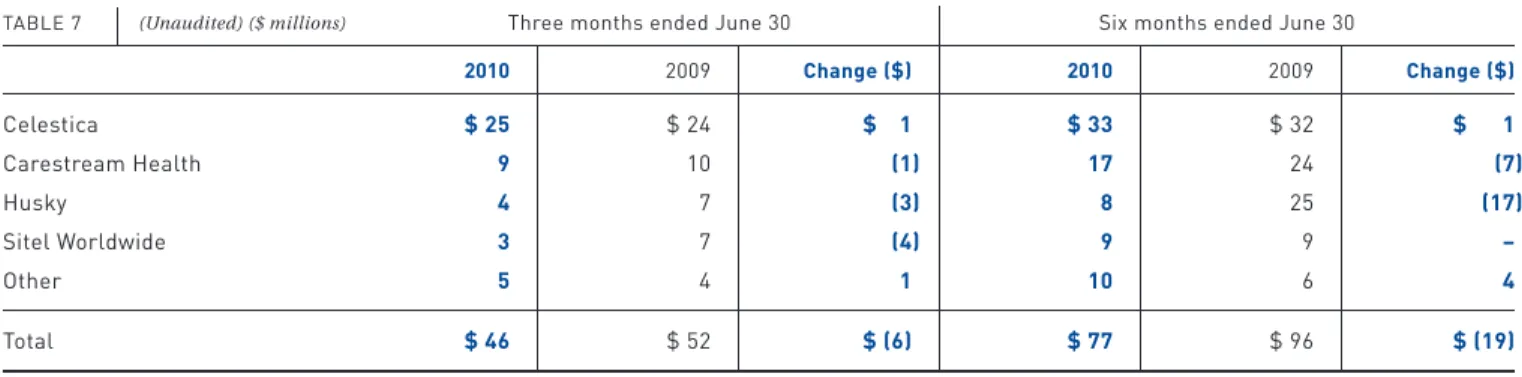
Onex reported consolidated other income of $22 million in the second quarter of 2010 compared to $85 million of income in the same quarter of 2009. The Warranty Group recorded US$13 million of other income in the second quar-ter of 2010 as a result of gains in its investment portfolio.
In April 2010, Onex sold an entity, the sole assets of which were certain tax losses, to a public company controlled by Mr. Gerald W. Schwartz, who is also Onex’ con -trolling shareholder. Onex received approximately $8 million in cash for tax losses of approximately $70 million. The entire $8 million was recorded as a gain in other income of Onex, the parent company, in 2010. Onex has significant Canadian non-capital and capital losses available and valua-tion allowances have been established against the benefit of all of these losses in the unaudited interim consolidated financial statements. As such, Onex does not expect to gen-erate sufficient taxable income to fully utilize these losses in the foreseeable future. In connection with this transaction, Onex obtained a tax ruling from Canada Revenue Agency, and Deloitte & Touche LLP, an indepen dent accounting firm retained by Onex’ Audit and Cor porate Governance Com -mit tee, provided an opinion that the value received by Onex for the tax losses was fair. The transaction was unanimously approved by Onex’ Audit and Corporate Governance Com -mittee, all the members of which are independent directors. Included in the second quarter of 2009 was $75 million of other income recorded by Onex, the parent company, due primarily to a $71 million favourable marktomarket and foreign exchange adjustment on the Tropi -cana Las Vegas debt held by Onex and Onex Partners III.
For the six months ended June 30, 2010, consoli-dated other income totalled $24 million due primarily to the other income from The Warranty Group and the sale of cer-tain tax losses as discussed in the second quarter. This com-pares to $68 million of other income for the first six months of last year, which included the mark-to-market adjustment on the Tropicana Las Vegas debt as previously discussed.