Title:
Supporting student experience management with
learning analytics in the UK higher education sector
Name: Claudette Adamma Kika
This is a digitised version of a dissertation submitted to the University of
Bedfordshire.
It is available to view only.
This item is subject to copyright.
SUPPORTING STUDENT EXPERIENCE MANAGEMENT
WITH LEARNING ANALYTICS IN THE UK HIGHER
EDUCATION SECTOR
CLAUDETTE ADAMMA KIKA
PhD
UNIVERSITY OF BEDFORDSHIRE
ii
SUPPORTING STUDENT EXPERIENCE MANAGEMENT WITH LEARNING ANALYTICS IN THE UK HIGHER EDUCATION SECTOR
by
CLAUDETTE ADAMMA KIKA
A thesis submitted to the University of Bedfordshire in partial fulfilment of the requirements for the degree of Doctor of Philosophy
iii
DECLARATION
I declare that this thesis is my own unaided work. It is being submitted for the degree of Doctor of Philosophy at the University of Bedfordshire.
It has not been submitted before for any degree or examination in any other University
Name of candidate: Claudette Adamma Kika Signature: Date: 08.08.18
iv
ABSTRACT
While some UK Higher Education Institutes (HEIs) are very successful at harnessing the benefits of Learning Analytics, many others are not actually engaged in making effective use of it. There is a knowledge gap concerning understanding how Learning Analytics is being used and what the impacts are in UK HEIs. This study addresses this gap. More specifically, this study attempts to understand the challenges in utilising data effectively for student experience management (SEM) in the era of Big Data and Learning Analytics; to examine how Learning Analytics is being used for SEM; to identify the key factors affecting the use and impact of Learning Analytics; and to provide a systematic overview on the use and impact of Learning Analytics on SEM in HEIs by developing a conceptual framework. To achieve the research objectives, a qualitative research method is used. The data collection process firstly involves an exploratory case study in a UK university to gain a preliminary insight into the current status on the use of Big Data and Learning Analytics and their impact, and to determine the main focuses for the main study. The research then undertakes an extensive main study involving 30 semi-structured interviews with participants in different UK universities to develop more in-depth knowledge and to present systematically the key findings using a theoretical framework underpinned by relevant theories.
Based on the evidence collected from the exploratory case study and interviews, the study identifies the key challenges in utilising data and Learning Analytics in the era of Big Data. These include issues related to data quality, data consistency, data reliability, data analysis, data integration, data and information overload, lack of data, information availability and problems with systems. A series of critical factors affecting the use of Learning Analytics is emerged and mapped out from a technology-organisation-environment-people (TOE+P) perspective. The technology-related factors include Usability, Affordability, Complexity and System integration. The organisation-related factors cover Resource, Data Driven Culture,
v
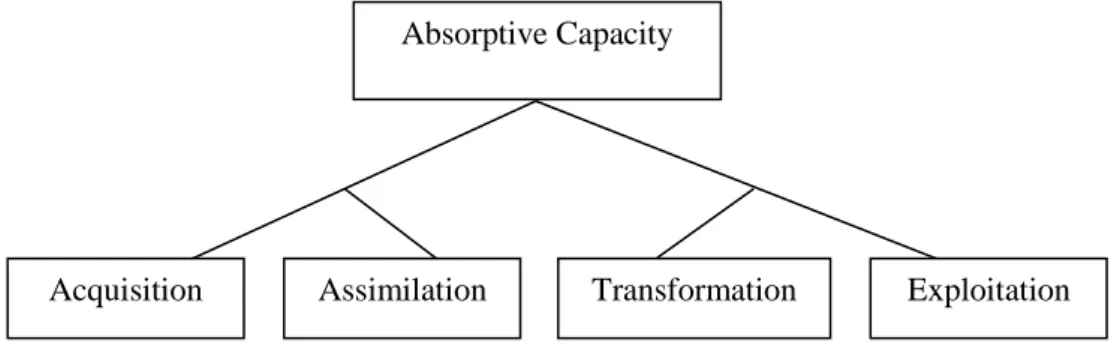
Senior management support and Strategic IT alignment. The environment-related factors include Competitive pressure, Regulatory environment and External support. Most importantly, the findings emphasise the importance of the people-related factor in addition to TOE factors. The people-related factors include People’s engagement with using data and Learning Analytics, People’s awareness of Data Protection and Privacy and Digital Literacy. The impacts of the Learning Analytics are also identified and analysed using organisational absorptive capacity theory. The findings are integrated in the final theoretical framework and demonstrate that the HEIs’ capabilities in terms of data acquisition, assimilation, transformation and exploitation supported by Learning Analytics enable them to improve student experience management. This study makes new contributions to research and theory by providing a theoretical framework on understanding the use and impact of Learning Analytics in UK HEIs. It also makes important practical contributions by offering valuable guidelines to HEI managers and policy makers on understanding the value of Learning Analytics and know how to maximise the impact of Big Data and Learning Analytics in their organisations.
vi
ACKNOWLEDGEMENTS
First and foremost I would like to thank the Lord God Almighty for seeing me through this PhD journey; without him completion wouldn’t have been possible. I would like to express my sincere gratitude to my Director of Studies, Professor Yanqing Duan and my supervisor Dr Guangming Cao for their ongoing support throughout my PhD study, for their patience, enthusiasm and wealth of knowledge. Their guidance and feedback aided me at all times in my research through the years as well as with writing up of this thesis. Thank you for pushing me as hard as you did, I could not have wished for better supervisors and mentors for my PhD study.
Next, I would like to thank my mother Ms Catherine Abu; I love you with all my heart! Thank you for being there spiritually, emotionally and physically. Words cannot express how much I am grateful for your support and advice and just being a true source of encouragement throughout my PhD process. My sincere thanks also go to my father Mr Pedro Kika, I love you Popsy! Thank you firstly for dropping me to the library every morning and making sure I woke up early when I’m going into university; your smiles, laughter, keeping me upbeat and providing support and encouragement in general. You are the best parents in the world and the epitome of hard work; when I lose strength I think of you both and keep going.
To my broski, Peter Kika, the love I have for you is too much, I am truly proud to have you as my brother; you have grown up to become such a kind, intelligent, caring and responsible man, thank you for being there for me throughout this journey. God will continue to bless you all my family! I would like to thank other family members, especially Dr Vincent Kika, who has been a true inspiration and support to me completing my PhD.
I am grateful to my best friend Chantal Anthony a.k.a. Channie, you have given me moral and emotional support through this process, you are truly one in a million and I thank you for
vii
your prayers also and making the spare time when I’m not studying enjoyable. I would also like to thank her mum Joan Anthony for taking the time out to pray with me when I see her and also offer caring advice. Special mention to my babes who have been rooting for me all the way, Tobi ‘Kadiatu’ Adekoya (my sister in grime), Nike Adewale (my spice), Ayo Togunloju (my theatre partner in crime) and to my fellow doctoral researcher and friend Dr Emmanuel Mogaji.
I am also grateful to the staff at Petts Wood Library, Orpington, for being so helpful whenever I go in and always making sure that the study space is comfortable. I would also like to thank Dr Peter Norrington for his excellence support with proofreading over three months.
viii
Table of Contents
List of Tables ...xiv
List of Figures ... xv
List of Abbreviations ...xvi
Research Publications to date ... xviii
Chapter 1: Introduction ... 1 1.0 Overview ... 1 1.1 Introduction ... 1 1.2 Research Background ... 1 1.3 Research Rationale ... 6 1.4 Research Questions ... 8
1.5 Research Aim and Objectives ... 8
1.6 Overview of Research Methodology and Process ... 8
1.7 Thesis Outline ... 11
1.8 Key Terms for the Study ... 13
1.8.1 Student Experience Management ... 13
1.8.2 Student Recruitment ... 14 1.8.3 Student Engagement ... 14 1.8.4 Student Retention ... 15 1.8.5 Student Success ... 15 1.8.6 Descriptive analytics ... 15 1.8.7 Predictive analytics ... 15 1.8.8 Prescriptive analytics ... 16 1.9 Summary ... 16
Chapter 2: Review on Learning Analytics and Their Use in UK HEIs ... 17
2.0 Overview ... 17
2.1 Introduction ... 17
2.2 Big Data ... 17
2.2.1 Introduction ... 17
2.2.2 Definition of Big Data... 18
2.2.3 Characteristics of Big Data ... 18
ix
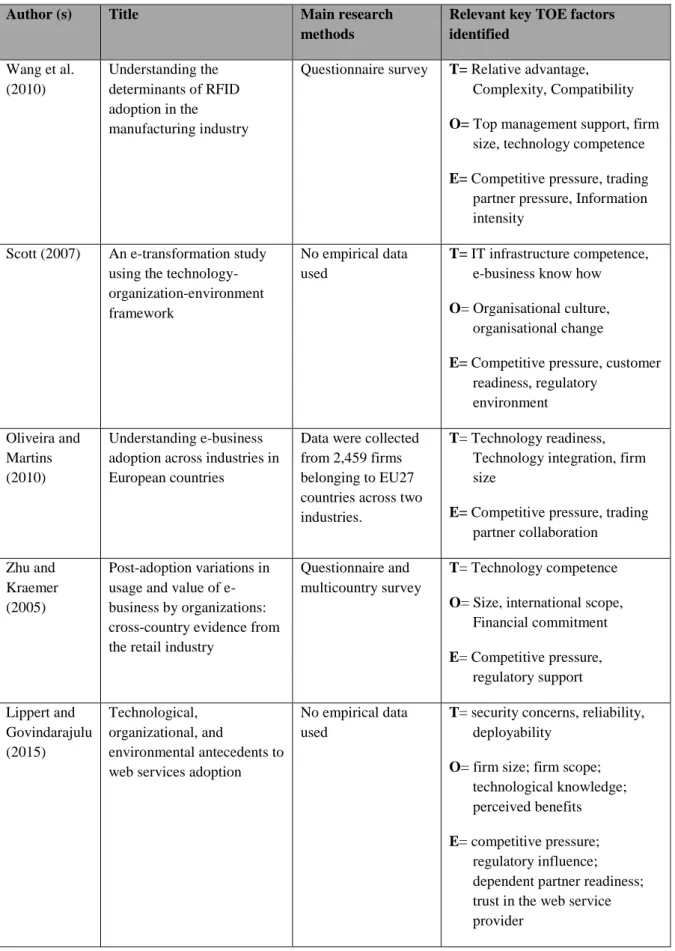
2.4 The Use of Analytics in HEIs ... 21
2.5 Introduction to Learning Analytics ... 23
2.6 Where Learning Analytics is Currently Used and How ... 28
2.7 Factors Driving the Growth of Learning Analytics ... 31
2.8 Big Data and Learning Analytics ... 32
2.9 Examples of Learning Analytics ... 35
2.10 Learning Analytics Techniques ... 40
2.11 Advantages and Disadvantages of Learning Analytics ... 43
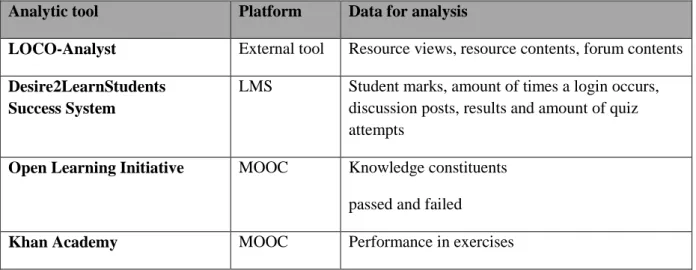
2.12 Type of Data Collected and Examined by Some Other Well-known Learning Analytics Tools ... 46
2.13 Conclusion ... 47
Chapter 3: Literature Review ... 48
3.1 Overview ... 48
3.2 Literature Review ... 48
3.3 Student Experience Management ... 49
3.3.1 Student Experience Management within HEI ... 49
3.3.2 Student Lifecycle Relationship Management (SLRM) ... 50
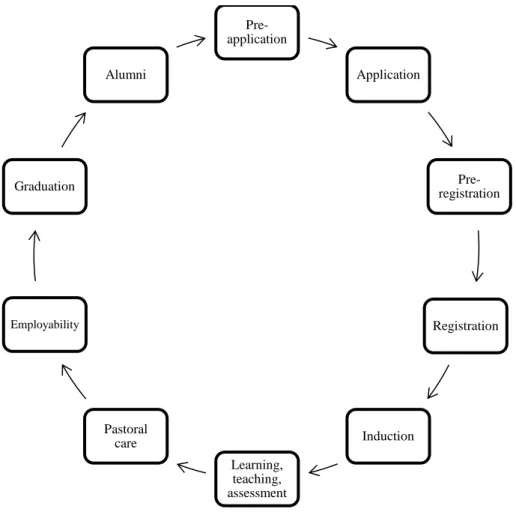
3.4.3 Student Lifecycle ... 51
3.3.4 Summary of SEM literature ... 53
3.4 Research Gaps ... 54
3.5 IS/IT Adoption and Implementation ... 55
3.5.1 Review of Important Theories Employed in Information Systems (IS) Research ... 55
3.5.1.1 Technology-Organisation-Environment (TOE) ... 56
3.5.1.2 Absorptive Capacity Theory (ACAP) ... 64
3.5.1.3 Information System Success (ISS) model ... 75
3.5.1.4 Diffusion of Innovation Theory (DOI) ... 78
3.5.2 Summary of the IS theories relevant to this study ... 83
3.6 Conclusion of Literature Review ... 85
Chapter 4: Methodology ... 86
4.0 Overview ... 86
4.1 Background ... 86
4.2 Philosophical Perspective for this Study – Interpretivism ... 87
4.2.1 Why Interpretivism? ... 90
x
4.4 Research Approach – Abductive... 91
4.5 Unit of Analysis ... 94
4.6 Sampling Strategy ... 95
4.6.1 Purposive sampling ... 95
4.6.2 Exploratory case study ... 95
4.6.3 Main study ... 96
4.6.4 Epistemological justification of sample ... 98
4.7 Research Method – Qualitative Interviewing ... 98
4.8 Data Collection Techniques ... 100
4.8.1 Structured interviews ... 101
4.8.2 Unstructured interviews ... 101
4.8.3 Semi-structured interviews ... 102
4.9 Interview Process ... 104
4.9.1 First stage: Thematising ... 104
4.9.2 Second stage: Designing ... 105
4.9.3 Third stage: interviewing ... 105
4.9.4 Fourth stage: Transcribing: ... 105
4.9.5 Fifth stage: Analysing ... 106
4.9.6 Sixth stage: Verifying ... 107
4.9.7 Seventh stage: Reporting ... 107
4.10 Interview Process for this Research ... 107
4.10.1 First stage: Thematising ... 107
4.10.2 Second stage: Designing ... 108
4.10.3 Third stage: Interviewing ... 109
4.10.4 Fourth stage: Transcribing ... 110
4.10.5 Fifth stage: Analysing ... 110
4.10.6 Sixth stage: Verifying ... 111
4.10.5 Seventh stage: Reporting ... 111
4.11 Data Analysis – Thematic Qualitative Analysis ... 111
4.11.1 The process and techniques of TQA ... 111
4.11.2 Key terms of TQA... 114
4.12 Time Horizons for this Study ... 115
4.13 Research Ethics ... 115
xi
4.13.2 Anonymity ... 117
4.13.3 Privacy and confidentiality ... 117
4.13.4 Deception ... 118
4.13.5 Ethical issues of the seven research stages ... 118
4.14 Risk Assessment ... 119
4.15 Summary of the Research Process ... 120
4.15.1 Research aim and objectives ... 122
4.15.2 Literature review ... 122
4.15.3 Exploratory case study ... 122
4.15.4 Research focus identified for the main study ... 122
4.15.5 Main study (inductive process) ... 122
4.15.6 Framework development (deductive process) ... 123
4.15.7 Writing up of the thesis ... 123
Chapter 5: Data Analysis ... 124
5.0 Overview ... 124
5.1 Data Analysis Process ... 124
5.1.1 Data collection ... 125
5.1.2 Data analysis preparation ... 126
5.1.3 Familiarisation with the data ... 126
5.1.4 Import into NVivo 11 ... 126
5.1.5 Creating initial codes ... 129
5.1.6 Searching for themes ... 130
5.1.7 Reviewing themes ... 131
5.1.8 Defining and naming themes ... 132
5.1.9 Producing a report ... 133
5.2 An Exploratory Case Study ... 133
5.2.1 The case study background ... 134
5.2.2 Why an exploratory case study? ... 135
5.2.3 Analysis of data from the exploratory case study ... 136
5.2.4 Conclusion of exploratory case study ... 146
5.3 The Main Study ... 147
5.3.1 Objectives of the main study ... 147
5.3.2 Sample for the main study ... 148
xii
5.3.4 Interview study participants ... 149
5.3.5 Analysis of data from main study ... 151
5.3.6 Main study themes ... 151
5.4 Data Analysis of the Main Study ... 153
5.4.1 Objective one: To understand the challenges in utilising data effectively for SEM in the era of Big Data and Learning Analytics ... 153
5.4.2 Objective two: To identify the key factors affecting the use and impact of Learning Analytics ... 165
5.4.3 Objective three: To understand how Learning Analytics is being used for SEM ... 177
5.4.4 Objective four: To develop a conceptual framework to provide a systematic overview on the use and impact of Learning Analytics on SEM in HEIs ... 192
5.5 Additional Data Analysis Based on Participants’ Profile ... 193
5.6 Chapter Summary ... 196
Chapter 6: Framework Development ... 197
6.1 Background ... 197
6.2 Theoretical Lens for this Study ... 198
6.2.1 Technology-Organisation-Environment (TOE) framework... 198
6.2.2 Absorptive Capacity Theory ... 200
6.3 Development of the Framework ... 202
6.3.1. Mapping the factors using TOE ... 202
6.3.2 Mapping the Use of LA using ACAP ... 220
6.4 Theoretical Framework ... 236
6.5 Conclusion of the Framework Development Chapter ... 237
Chapter 7: Conclusions ... 238
7.0 Overview ... 238
7.1 Summary of this Research and Key Findings ... 238
7.1.1 Summary of this research ... 238
7.1.2 Key findings ... 239
7.2 Contributions of this Study ... 241
7.2.1 Contributions to research ... 241
7.2.2 Contributions to practice ... 243
7.3 Limitations of this Research ... 244
7.4 Recommendations for Future Research ... Error! Bookmark not defined. References ... 246
xiii
Appendix 1: Conferences and seminar presentations ... 261
Appendix 2: Cover letter for Exploratory Case Study ... 262
Appendix 3: Interview Guide for Exploratory Case study ... 264
Appendix 4: Consent form for exploratory case study ... 265
Appendix 5: Cover letter for main study ... 266
Appendix 6: Definition sheet for main study ... 269
Appendix 7: Interview Guide for the main study... 271
Appendix 8: Inter-rater reliability test ... 273
Appendix 9: Consent form for main study ... 275
xiv
List of Tables
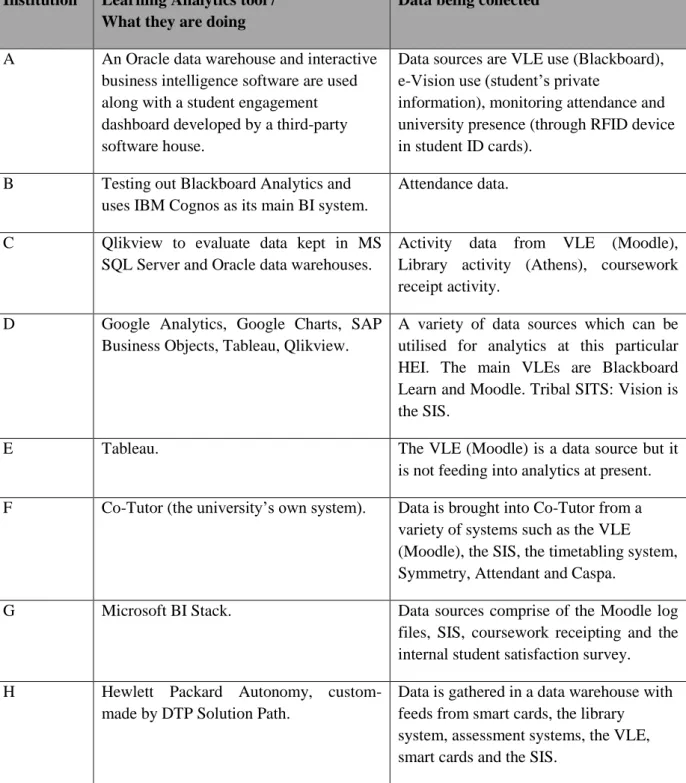
Table 2.1 Different Learning Analytics tools used in UK HEIs ... 30
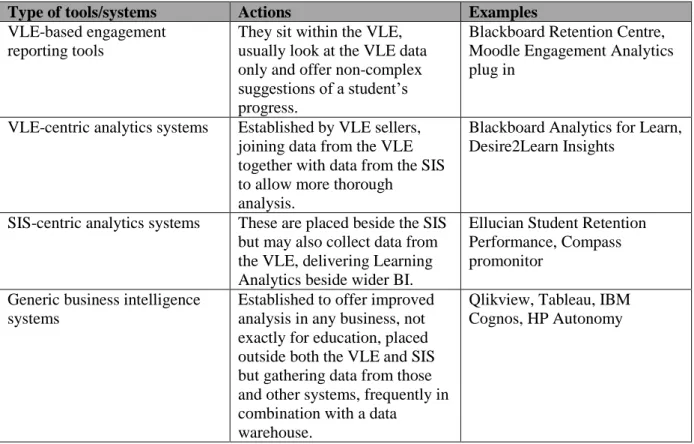
Table 2.2Types of Learning Analytics tools/systems ... 35
Table 2.3 Types of analytics and who benefits (adapted from (Siemens, 2011b) ... 36
Table 2.4 Learning Analytics techniques and applications (adapted from (Siemens, 2013) ... 41
Table 2.5Other analytics tools and their data for analysis (adapted from (Del Blanco et al., 2013) ... 47
Table 3.1 Literature review strategy summary ... 49
Table 3.2 Summary of studies using the TOE framework ... 61
Table 3.3 Summary of some studies using the ACAP theory ... 72
Table 4.1Attributes of the research perspectives of positivism and interpretivism (adapted from (Weber, 2004, Bryman, 2012, Easterby-Smith et al., 2012) ... 89
Table 4.2 The main differences between the deductive, inductive and abductive approaches ... 94
Table 4.3 Classification of participants for the exploratory case study ... 96
Table 4.4 Classification of participants for main study ... 97
Table 4.5Thematic research areas and Interview questions ... 108
Table 5.1Participant profile ... 136
Table 5.2 Classification of participants for main study ... 150
Table 5.3 Broad themes of study showing the number of sources and references ... 152
Table 5.4 Participants’ understanding of SEM with its subthemes and relevant data extracts ... 155
Table 5.5 Challenges of utilising data effectively with its subthemes and relevant data extracts ... 159
Table 5.6 Issues with data governance ... 164
Table 5.7 Factors that affect the use and impact of Learning Analytics and relevant data extracts ... 166
Table 5.8 People issues related to Learning Analytics with its subthemes and relevant data extracts 170 Table 5.9 Social media platforms used in the UK HEIs ... 171
Table 5.10 Themes related to data acquisition in HEIs ... 177
Table 5.11 Themes related to how HEIs make sense of data ... 179
Table 5.12 Assimilating data using Learning Analytics tools ... 180
Table 5.13 How does the use of Learning Analytics impact on SEM ... 182
Table 5.14 Summary table of classification of participants ... 194
Table 5.15Analysis of factors based on the male and female participants according to the TOE framework ... 194
Table 6.1Percentages of themes for the Technology context ... 206
Table 6.2 Percentages of themes for the Organisational context ... 212
Table 6.3 Percentages of themes for the Environmental context ... 216
Table 6.4 Percentages of themes for the People context ... 219
Table 6.5 Percentages of themes for Acquisition... 222
Table 6.6 Percentages of themes for Assimilation ... 225
Table 6.7 Percentages of themes for Assimilation using LA tools ... 228
xv
List of Figures
Figure 1.1 Research Process ... 10
Figure 1.2 Thesis outline ... 11
Figure 3.1 The main stages of the student life cycle (from the JISC report by Chambers and Paull (2008) ... 52
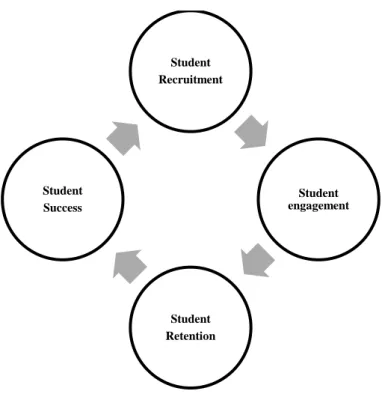
Figure 3.2 The SEM cycle ... 53
Figure 3.3 Model of Absorptive Capacity (adapted from (Zahra and George, 2002) ... 64
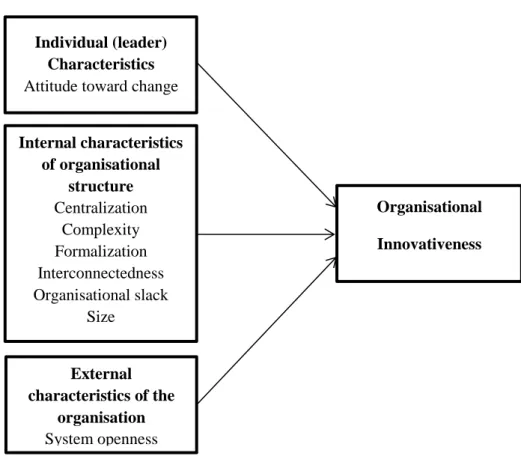
Figure 3.4 Diffusion of innovations (Rogers Everett, 1995) (Adapted from (Oliveira and Martins, 2011b) ... 79
Figure 4.1 Research methodology process ... 87
Figure 4.2 The 7-step interview process (adapted from Kvale (1996)... 104
Figure 4.3 Research Process ... 121
Figure 5.1 Eight-step process using the inductive data-driven approach (adapted from (Braun and Clarke, 2006)... 125
Figure 5.2Screenshot showing transcripts from exploratory case study imported into NVivo 10 ... 128
Figure 5.3 Screenshot showing transcripts from main study imported into NVivo 11 ... 128
Figure 5.4 Screenshot showing transcripts from main study imported into NVivo 11 (continued) ... 129
Figure 5.5 Data extracts from the main study coded for participants’ contributions to technological factors that affect the use and impact of Learning Analytics ... 130
Figure 5.6 NVivo screenshot of initial broad themes identified from the data ... 131
Figure 5.7 Main themes identified from the exploratory study ... 146
Figure 5.8 NVivo screenshot of broad themes ... 152
Figure 6.1 Understanding the use and impact of Learning Analytics on SEM from a TOE and ACAP perspective ... 198
Figure 6.2 The Technology context ... 203
Figure 6.3 The Organisational context ... 207
Figure 6.4 The Environmental context ... 213
Figure 6.5 The People context ... 217
Figure 6.6 Themes derived from the data for Acquisition ... 220
Figure 6.7 Themes derived from the data for Assimilation ... 223
Figure 6.8The themes and subthemes derived from the data for Transformation and Exploitation .. 229
xvi
List of Abbreviations
.rtf Rich Text Format
ACAP Absorptive Capacity
AI Artificial Intelligence
AIS Academic Information System
APTT Academic Progression & Tracking Tool
BA Business Analytics
BI & A Business Intelligence & Analytics
CAQDAS Computer Aided Qualitative Data Analysis Software
CMS Content Management System
CRM Customer Relationship Management
DA Discourse Analysis
DLHE Destination of Leavers from Higher Education
DOI Diffusion of Innovation
EDM Electronic Data Mining
ERP Enterprise Resource Planning
ESD Electronic Service Desk
FE Further Education
GPA Grade Point Average
HE Higher Education
HEDIIP Higher Education Data and Information Improvement Programme
HEA Higher Education Academy
HEAT Higher Education Access Tracker
HEI Higher Education Institution
HEIDI Higher Education Information Database for Institutions
HeLF Heads of E-Learning Forum
HESA Higher Education Statistics Agency
HOD Head of department
HR Human Resources
ICT Information and Communication Technologies
xvii
ISS Information Systems Success
JISC (formerly the Joint Information Systems Committee)
KPI Key Performance Indicator
KPP Key Performance Parameters
LA Learning Analytics
LACE Learning Analytics Community Exchange
LMS Learning Management System
MOOC Massively Open Online Course
NSS National Student Survey
PEOU Perceived ease of use
PU Perceived usefulness
RFID Radio Frequency Identification
SEM Student Experience Management
SES Student Engagement System
SID Student Information Desk
SIMS Student Information Management System
SIS Student Information System
SLA Social Learning Analytics
SLC Student Loans Company / Student Life Cycle
SLRM Student Lifecycle Relationship Management
SMS Student Management System
SNA Social Network Analysis
SNAPP Social Networks Adapting Pedagogical Practice
SRS Student Records System
STEMM Science, Technology, Engineering, Medicine and Mathematics
TAM Technology Acceptance Model
TOE Technology-Organisation-Environment Framework
TQA Thematic Qualitative Analysis
UA Unit of Analysis
UCAS Universities Colleges & Admissions Service
UKVI UK Visas & Immigration
xviii
Research Publications to date
Kika, C., Duan, Y., & Cao, G. (2015), ‘Supporting Student Management with Business Analytics in the UK Higher Education sector’ (Abstract and presentation): UK Academy for Information Systems (UKAIS) Consortium, 17 March 2015, University of Oxford, Oxford.
Kika, C., Duan, Y., & Cao, G. (2015), Supporting Student Management with Business Analytics in the UK Higher Education sector – an exploratory case study (Full paper and presentation): International Conference on Intellectual Capital, Knowledge Management and Organisational Learning (ICICKM) 5-6 November, 2015, University of Bangkok, Bangkok – Awarded joint 2nd prize for best PhD paper.
Kika, C., Duan, Y., Cao, G. (2016), ‘Understanding the use and impact of Learning Analytics on Student Experience Management’ (Poster) – Pacific Asia Conference on Information Systems (PACIS), 27- June 1 July, 2016, Taiwan.
Kika, C., Duan, Y., & Cao, G. (2017), ‘The Use and Critical Success Factors of Learning Analytics: An Organisational Absorptive Capacity Analysis’ – Americas Conference on Information Systems (AMCIS), 10-12 August, 2017, Boston, MA. Kika, C., Duan, Y., & Cao, G. (2017), ‘Understanding the factors affecting the use of
Learning Analytics in the UK Higher Education Sector’ – European Association for Research on Learning and Instruction (EARLI), 28 August - 2 September, 2017, Tampere, Finland.
1
Chapter 1: Introduction
1.0 Overview
This chapter gives an overall idea of the research. It covers the research background, the rationale behind the study, and the aim and objectives, the key terms for the study and the research process.
1.1 Introduction
This PhD research is founded on the examination of the use and impact of Learning Analytics for Higher Education Institution (HEI) organisations in the UK. The working definition used for this research is adopted from the 1st International Conference on Learning Analytics and Knowledge (Siemens and Long, 2011, p34), which defines Learning Analytics as ‘the measurement, collection, analysis and reporting of data about learners and their contexts, for the purposes of understanding and optimising learning and the environments in which it occurs.’ This research is conducted in the context of Big Data and Analytics in the area of SEM
1.2 Research Background
Driven by the need to improve success, retention, and learning experience, Learning Analytics is a rapidly growing area of interest in educational institutions worldwide (Sclater, 2014a). Over the years Learning Analytics has been defined in several ways: for example, Sclater (2014a, p4) define it as ‘a way of enhancing teaching and helping to build better relationships between students and staff’. Cooper (2012, p3), on the other hand, draws language from business intelligence and refers to Learning Analytics as ‘the process of developing actionable insights through problem definition and the application of statistical
2
models and analysis against existing and/or simulated future data’. In the same vein, Campbell and Oblinger (2007, p42) identify Learning Analytics as ‘marrying large data sets, statistical techniques, and predictive modelling. It could be thought of as the practice of mining institutional data to produce ‘actionable intelligence.’
Learning Analytics has been widely used in extant literature, for example, Shum and Ferguson (2012, p3) offer the concept of Social Learning Analytics (SLA); they propose that it is ‘a distinctive subset of Learning Analytics that draws on the substantial body of work demonstrating that new skills and ideas are not solely individual achievements, but are developed, carried forward, and passed on through interaction and collaboration’.
Campbell and Oblinger (2007, p8) exploit the Big Data aspect of analytics through the concept of academic analytics, which is referred to as ‘an engine to make decisions or guide actions. That engine consists of five steps: capture, report, predict, act, and refine.’
Haythornthwaite et al. (2013) argue that Learning Analytics is impelled by changes in social practices due to the increase in participatory culture which has led to several changes in how teaching and learning happen. Examples include transformative learning, e-learning, online courses and degree programmes to the developing trend of massively open online courses (MOOCs). According to Haythornthwaite et al. (2013), Learning Analytics supports the following: teachers wanting to comprehend the impact on interaction, student learning or other outcomes of their assignments and learners who wish to comprehend their learning experience against people who are current learners or even past learners, e.g. fellow learners in a MOOC. The use of Learning Analytics dashboards, according to Few (2006), give graphical depictions of the present state of a learner or a course to allow decision making which is flexible. For example, Verbert et al. (2013) examine the area of dashboard applications and argue that numerous dashboard applications have been made in order to support teaching and learning.
3
These dashboards are also used in modern online learning or face-to-face teaching; examples include the learning management system (LMS) Moodle and the Classroom view, which demonstrates what is happening in a classroom. Another example of Learning Analytics is predictive modelling (Clow, 2013). Predictive modelling involves developing a mathematical model which then creates estimates of likely outcomes; these are then used to report interventions intended to improve those outcomes. According to Clow (2013), the most effective application of predictive modelling to student completion in the Higher Education (HE) sector was the Course Signals project at Purdue University (Arnold, 2010).
This model involves a colour-coded system with green demonstrating a good chance of success, yellow demonstrating that there could be potential problems and red demonstrating a great chance of failure. Other historical contributions to Learning Analytics include social network analysis: this has been examined in Haythornthwaite (2002), where she investigated the impact of media type on the progression of social ties: user modelling which involves modelling users in their contact with computer systems. Fischer (2001, p70) argues that user modelling has become significant in research in human computer interactions as it aids researchers to develop better systems by recognising how users interact with the software.
In the HE sector there has been a growth of online learning (Haythornthwaite and Andrews, 2011). E-learning has helped the improvement of Learning Analytics as student data can be taken and made accessible for analysis (Siemens, 2013). However, according to Slade and Prinsloo (2013, p1511), there are ethical issues for Learning Analytics which fall into the following categories: ‘the location and interpretation of the data, informed consent, privacy and deidentification of data and the management, classification and storage of data’.
Currently, the HE sector is facing a number of challenges and increasing pressures in providing the best learning experience for students; this is due to various newer technologies
4
that have now become readily available that deal with large volumes and varieties of data. Sarker et al. (2010) state that there has been a growing interest in identifying those challenges and also discovering ways to address them. Nowadays, HEIs are collecting a great amount of data in various areas within SEM (Bichsel, 2012).
Learning Analytics has been a rapidly growing interest in HEIs worldwide, due to the increasing competition within the HE sector in this digital age and the need to provide good educational services. However, despite new technological approaches in the field of analytics becoming increasingly important in academic communities, HEIs are still not exploring and adopting these approaches despite their huge potential benefits. The Heads of E-learning Forum (HeLF) survey report in June 2015 (Newland et al., 2015) states that Learning Analytics has not been used by almost half of UK HEIs; only one university in the survey stated that Learning Analytics has been used to its full potential and supported within the university.
Dietz-Uhler and Hurn (2013) also define Learning Analytics as improving areas such student success and increasing student retention, which has been mentioned in literature as one of the main challenges the HE sector faces (Tiropanis et al., 2009). There is also increased focus on how Learning Analytics can increase the overall student experience in HEIs (Sclater, 2014a). For example, in order to improve student retention and the motivation of students through the use of analytics (Sclater, 2014a), JISC (formerly known as the Joint Information Systems Committee) are doing what they can as an organisation to help. There is a significant need for Learning Analytics in HEIs as they can be used to help students learn more effectively and improve student recruitment and faculty performance.
Learning Analytics is relevant and important at the moment because, according to Van Harmelen and Workman (2012), Learning Analytics is not being used to its full potential in
5
the UK HE sector. The argument that has come to the forefront is how can teachers be convinced that Learning Analytics would be very useful for their students? Van Harmelen and Workman (2012) also state that HEIs differ in analytics readiness and development and might to a larger or smaller extent be prepared for the introduction of analytics or the greater use of analytics. Zilvinskis et al. (2017) state that Learning Analytics combines a diverse range of new ways to think about approaching the learning environment. They also argue that applying Learning Analytics offers an opportunity to connect the knowledge of existing roles (Student Services and IT).
In terms of Student Experience, it is a Key Performance Indicator (KPI) in HEIs. Temple et al. (2014) refer to the student experience as the entirety of a student’s dealings with an institution. They also go on to state that student experience has many meanings and the list of what it may incorporate is practically endless. It is vital to recognise that each student’s set of experiences will be exclusive to that person; there also is a threat that mentioning ‘the student experience’ will propose a degree of consistency that cannot occur in practice (Temple et al., 2014). They also state that the management of the undergraduate student experience in the English HE sector is shifting due to a more competitive environment.
Morgan (2013) states that enhancing the student experience (from first contact with the student to when they become alumni) is vital to HE success for the student as well as the HEI. She also goes on to state that the challenges with student experience involve the increasing expenses of providing HE, the decrease in government funding and resource constraints.
6
1.3 Research Rationale
Providing students with the best learning experience and ensuring their academic success throughout their university lifecycle has been a serious challenge for HEIs. While advances in Information and Communication Technologies (ICT) have enabled HEIs to intelligently collect more data from both internal and external sources (Bichsel, 2012, Davenport, 2013), this has led to the explosion of data and unprecedented challenges in making effective use of this formidable amount of data for effective decision making and better SEM. While there is indication that large commercial companies that use Learning Analytics perform better than those that do not in making strategic decisions and creating competitive advantages (Kiron et al., 2012), managers in HEIs are still struggling in making sense of an ever-growing amount of data and information (Tulasi, 2013).
Although a range of UK universities are increasing their Big Data and Analytics investment and starting to see the impact of it, HEIs in general are still far behind the commercial sector. The majority of HEIs are still not actively exploring and adopting Learning Analytics despite the huge potential benefits. The HE sector is a data-rich sector and universities generate and use enormous volume of data each day (Shacklock, 2016b). HEIs are starting to become aware of the large amount of data and intelligence that are available in their own systems. This can then be utilised to understand the needs of the students and the market, and to make sure that the business advantages that arise from the successful management of direct relationships with students are secure. However, a unified approach among managers and students is required for the benefits to be realised through the use of Learning Analytics.
Learning Analytics is a fast-growing area of interest because it has the potential to be enormously powerful for utilising data and improving the student experience in universities. SEM can cover all aspects of student-facing management activities from marketing,
7
recruitment, engagement, retention, performance, to graduation and alumni relationship management. To improve student experience and ensure their success, SEM forms a critical part of HE management and is important because institutions strive to distinguish themselves from their competitors through better student services and effecting teaching and learning support. Although some HEIs are harnessing the benefit of Big Data and Analytics, the sector in general has not yet capitalised on the enormous opportunities and is lagging behind other sectors (Shacklock, 2016b). Therefore, it is important to develop appropriate knowledge and understanding on the current use of Learning Analytics and the critical factors affecting its success.
On reviewing the literature, there are a few studies that touch upon applying Learning Analytics in HEIs, but there has not been specific research on exploring the use and impact of Learning Analytics on SEM. A number of research gaps are identified below that are relevant to this study and are elaborated further in section 3.4 of Chapter 3:
1. HE is data intensive sector and various types and amounts of data are generated. However, there appears to be a lack of research on addressing the challenges in utilising data in SEM in the era of Big Data and Analytics.
2. Due to the growing importance of Learning Analytics, UK HEIs are very keen to use Learning Analytics, but there appears to be a serious lack of academic research that explores the applications and impact of Learning Analytics in HEIs, especially in the context of SEM.
8
1.4 Research Questions
The research questions for this study are:
How are the UK HEIs using Learning Analytics for improving SEM?
What are the influential factors affecting the use of Learning Analytics in the UK HEIs?
1.5 Research Aim and Objectives
The overall aim of this research is to explore the use and impact of Learning Analytics for SEM in UK HEIs. More specifically, this study attempts to achieve the following objectives:
1. To understand the challenges in utilising data effectively for SEM in the era of Big Data and Learning Analytics
2. To identify the key factors affecting the use and impact of Learning Analytics 3. To understand how Learning Analytics is being used for SEM
4. To develop a conceptual framework to provide a systematic overview on the use and impact of Learning Analytics on SEM in HEIs.
In summary, this research explores and applies the relevant theories to explain and understand the use and impact of Learning Analytics in the context of SEM
1.6 Overview of Research Methodology and Process
Since the aim of the study is to explore the use and impact of why and how the research participants are using the Learning Analytics tools for SEM in UK HEIs, a qualitative approach was adopted for this research. A qualitative approach was used as it explores the richness, depth and complexity of a phenomenon. Also, according to Bryman and Bell (2015), using a qualitative approach allows the researcher to examine the why and how of the
9
phenomena being studied from the views of research participants and it is useful for understanding their opinions as well as experiences in particular surroundings. Bearing in the mind the description of the qualitative approach given above, this approach is most appropriate to achieve the research aim and objectives of the study and to answer the research questions. For the research method, qualitative interviewing was used which involved semi-structured interviews that were adopted in collecting empirical evidence. The data analysis on the other hand was conducted through Thematic Qualitative Analysis (TQA). TQA is mainly described as a method for identifying, analysing and reporting patterns (themes) within the data (Braun and Clarke, 2006). In terms of the inductive, data-driven approach, Braun and Clarke (2006) state that the themes developed are not formulated by previous theoretical assumptions. The inductive data-driven approach used for the data analysis allows themes to develop straight from the data which results in a through explanation of the dataset.
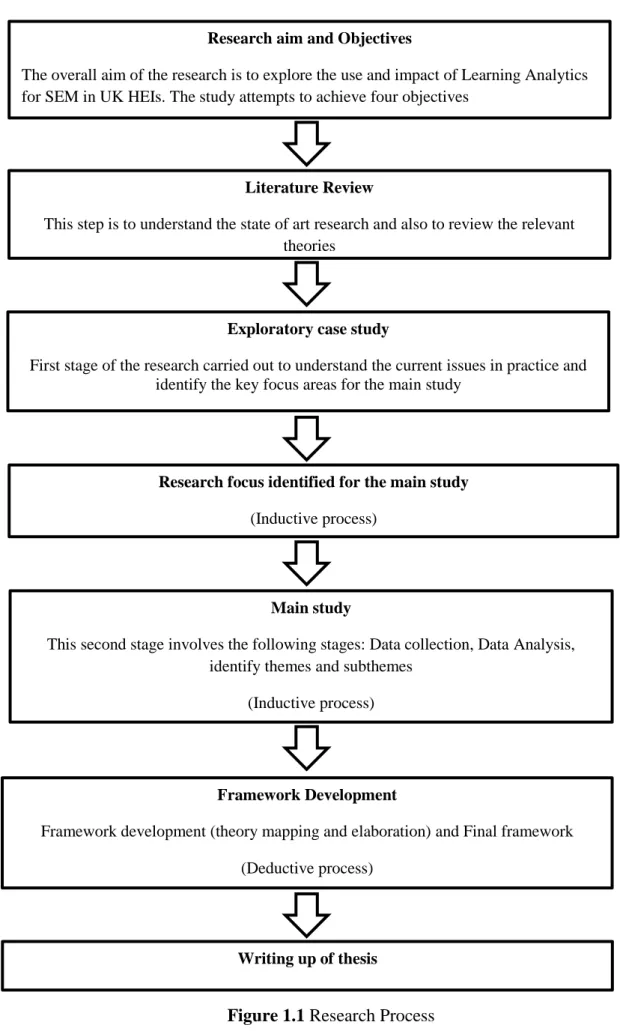
The steps for the research process are: research aim and objectives, literature review, exploratory case study, research focus identified for the main study, main study, framework development, and writing up thesis. This process is illustrated in Figure 1.1.
10
Figure 1.1 Research Process Research aim and Objectives
The overall aim of the research is to explore the use and impact of Learning Analytics for SEM in UK HEIs. The study attempts to achieve four objectives
Literature Review
This step is to understand the state of art research and also to review the relevant theories
Exploratory case study
First stage of the research carried out to understand the current issues in practice and identify the key focus areas for the main study
Research focus identified for the main study
(Inductive process)
Main study
This second stage involves the following stages: Data collection, Data Analysis, identify themes and subthemes
(Inductive process)
Framework Development
Framework development (theory mapping and elaboration) and Final framework (Deductive process)
11
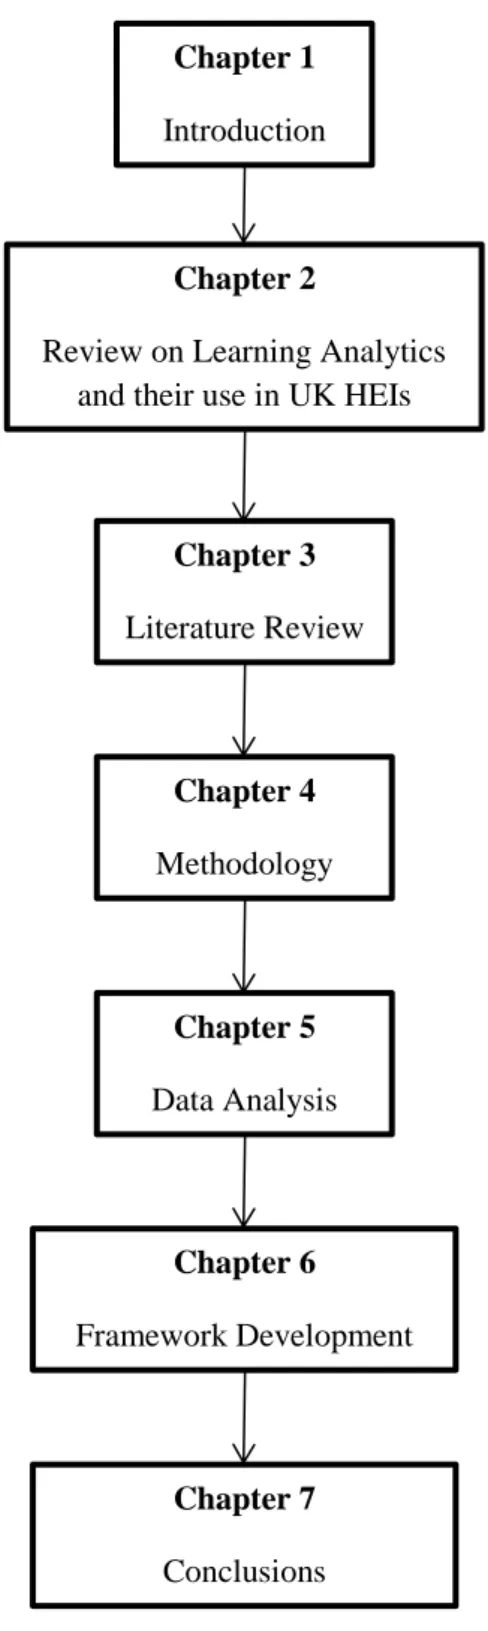
1.7 Thesis Outline
This thesis comprises of seven chapters, Figure 1.2 shows the outline of the thesis and is followed by the details of each chapter.
Figure 1.2 Thesis outline Chapter 2
Review on Learning Analytics and their use in UK HEIs
Chapter 1 Introduction Chapter 3 Literature Review Chapter 4 Methodology Chapter 5 Data Analysis Chapter 6 Framework Development Chapter 7 Conclusions
12
Chapter 1 gives an overall view of this research. Firstly it offers an insight into the research background, and then goes into the research rationale (importance of this research and research gaps), research questions, aim and objectives of the research, an outline of the research methodology used and the research process, the structure of the thesis and key definitions that form the basis of this research.
Chapter 2 is the review on Learning Analytics in UK HEIs. It gives an introduction to the chapter, how Learning Analytics is used in organisations, the techniques used in HEIs; then the impact of Learning Analytics in HEIs is reviewed and the key issues with Learning Analytics.
Chapter 3 is the literature review chapter. It reviews SEM within HEIs and the chapter is completed with a review of relevant information systems theories used.
Chapter 4 is the research methodology chapter and summarises the research methods for information systems. This section clearly states the difference between research methods and research methodology. A background into the philosophical stance of the study is given and what research philosophy this research has decided to adopt is addressed. The research approach, sampling strategy, sample, unit of analysis, what data analysis method is chosen, data collection methods and ethical issues to be considered for the study are also covered. The methodological setting of the study is also described and the justification of the research method used is stated.
Chapter 5 depicts the data analysis process. In this chapter a step–by-step process is given on how the analysis was carried out using Thematic Qualitative Analysis (TQA) in NVivo and then how the codes, subthemes, main themes and the research findings were developed. The subthemes and themes linked with the exploratory case study and main study are also examined and examples are given for both.
13
Chapter 6 is the framework development chapter. This chapter states the theoretical lens used for this study and how the theoretical framework was developed. The constructs of the theoretical framework and how they relate to this research are also expanded upon in the conclusion chapter which gives the interpretation of findings according to the theory and extant literature and also the real life situations of Learning Analytics in HEIs, followed by key recommendations.
Chapter 7 is the last chapter of the thesis and it provides a conclusion to the overall thesis. In this chapter the contribution to research and practice, limitations and any future research are summarised.
1.8 Key Terms for the Study
Since this research follows the literature review approach, the first step is to define the key terms based on the literature and then identify the key terms that lead to the relevant literature. The following key terms are defined below: SEM and the main areas covered by SEM – student recruitment, student engagement, student retention and student success.
1.8.1 Student Experience Management
According to Morgan (2018) the HE market has gradually become competitive and as well as that students have additionally become demanding and have had more enhanced learning about what services and support they are supposed to obtain whilst studying at university. They also state that because of this HEIs need to offer exceptional quality student experience in order to protect their ongoing organisational existence. In addition to this, argues that being dedicated to enhancing the student experience can cause a rise in the ‘retention’ of students by decreasing withdrawal rates and helping student progression; on top of that it is also essential to a HEI’s ability to draw in students. Morgan (2018) states that it is not
14
acceptable any more to treat students coming into this level of study as an identical group; also things such as the rising level of student diversity, the rising expenses of providing HE, the decrease in government/state funding and resource restraints mean providing an exceptional quality student experience has become an ever more growing challenge.
SEM can cover all aspects of student-facing management activities from marketing, recruitment, engagement, retention and performance, to graduation and alumni relationship management. To improve student experience and ensure student success, SEM forms a critical part of HE management. SEM is important in HEIs because institutions strive to distinguish themselves from their competitors through a number of processes, such as improving teaching and learning success and the quality of services given to their students, and managing the costs of their procedures by enhancing efficiency and effectiveness. This definition and the term SEM will be used throughout the thesis. For this research, the key areas of SEM are defined as student recruitment, student engagement, student retention and student success. These areas are described in the following sections and are shown in the SEM model in Figure 3.2 in section 3.3.3.
1.8.2 Student Recruitment
This involves finding potential students to enrol to a university; recruitment can take place through graduate fairs/exhibitions. Usually, institutions have a specific department for marketing, admissions, recruitment and enrolment.
1.8.3 Student Engagement
The working definition used for this research is adopted from the Student Engagement Literature review by (Trowler, 2010, p5), which defines student engagement as:
Student engagement is concerned with the interaction between the time, effort and other relevant resources invested by both students and their institutions intended to
15
optimise the student experience and enhance the learning outcomes and development of students and the performance, and reputation of the institution.
Student engagement is part of the SEM cycle.
The terms student success and student retention following are often used in partnership with one another, however student success is much broader and a preferred term in some HEIs.
1.8.4 Student Retention
Sarker et al. (2010) state that in order for HEIs to maintain their high standards and to gather support from the public, student retention has to be one of the main focuses. In the UK HE sector student retention refers to the how long learners stay in an institution and finish their course within a fixed period of time (Jones, 2008).
1.8.5 Student Success
According to Jones (2008), with student success it is not essential for a student to finish their HE programme in order to meet their targets within the institution; for example, a student might view success as finishing 120 credits of an Honours course and be satisfied with that. Student success does not just cover who stayed within their institution but specifies how the overall experience brought benefits.
1.8.6 Descriptive analytics
This uses data collection and data mining to provide an understanding of the past and answer: ‘What has happened?’ Descriptive analytics in HEIs can examine data in LMS by observing factors such as course completion.
1.8.7 Predictive analytics
This is ‘an area of statistical analysis that deals with extracting information using various technologies to uncover relationships and patterns within large volumes of data that can be
16
used to predict behaviour and events’(Eckerson, 2007, p5). It is used to answer the question ‘What could happen?’
1.8.8 Prescriptive analytics
Prescriptive analytics uses models to identify optimal behaviours and actions (Davenport, 2013) and is used to analyse the current problems faced by HEIs such as ‘student retention, enrolment management, prospect analysis, improving learning outcomes and curricular planning’(Schaffhauser, 2014, p1). It is used to answer the question ‘What should we do?’
1.9 Summary
Overall, this introduction chapter has shed light on the background and rationale of this research. It has also provided the gaps for this research in preparation for Chapter 3, the literature review.
17
Chapter 2: Review on Learning Analytics and Their Use in UK HEIs
2.0 Overview
Analytics has been defined in different ways and the most commonly used term is Business Analytics (BA). This section starts first and foremost by reviewing BA and then focuses on the application of analytics in education that is Learning Analytics.
2.1 Introduction
Big Data and technological approaches in the field of Business Intelligence and Analytics (BI & A) are increasingly important in both business and academic communities (Chen et al., 2012). BI & A are often stated as techniques and applications used for the analysis of business data to enhance business decisions (Chen et al., 2012, p1166, Davenport and Harris, 2007) whereas Big Data is an idea that has been developed to define the 3V’s – variety, velocity and volume of the data produced within information and communication technologies (ICTs) (Duan et al., 2013, p1). Big Data is a term invented to focus on the challenges that new data streams have brought to business firms and HEIs.
2.2 Big Data
2.2.1 Introduction
Currently, Big Data is making large headlines, particularly in the commercial sectors; however Big Data is not an occurrence affecting large commercial companies only (Duan et al., 2013). According to Duan et al. (2013), with the growing volume of data being gathered and shared from both internal and external sources, business firms of all varieties are now able to gain access to supposed Big Data. Big Data is a term invented to focus on the challenges that new data streams have brought to business firms and HEIs.
18
2.2.2 Definition of Big Data
Even though the term “Big Data” has become increasingly popular, its meaning is not always clear. There have been many who have offered their own definitions of Big Data; for example, Gartner IT Glossary (2018) defines Big Data as:
High volume, high velocity and high variety information assets that demand cost-effective, innovative forms of information processing for enhancing insight and decision making.
Also, Mills et al. (2012, p10) give:
Big Data is a term that describes large volumes of high velocity, complex and variable data that require advanced techniques and technologies to enable the capture, storage, distribution, management, and analysis of the information.
Zikopoulos and Eaton (2011, p3) define Big Data as:
Big Data applies to information that can’t be processed or analysed using traditional processes or tools. Increasingly, organisations today are facing more and more Big Data challenges. They have access to a wealth of information, but they don’t know how to get value out of it because it is sitting in its most raw form or in a semi structured or unstructured format; and as a result, they don’t even know whether it’s worth keeping.
And finally, Manyika et al. (2011, p1) refer to Big Data as “datasets whose size is beyond the ability of typical database software to capture, store, manage and analyse”.
2.2.3 Characteristics of Big Data
Big Data is often regarded by three factors: volume, velocity and variety. Many authors and researchers have given their definitions of each factor:
19
Volume
Data volume concerns the quantity of data obtainable to a firm, which does not essentially have to own all of it as long as it can access it (Kaisler et al., 2013).
Velocity
This relates to a growing rate at which data moves within a firm, or example firms allocated with financial information have the ability to cope with this (Daniel, 2015).
Variety
Data being created is not just of a single type as it not only involves traditional data but also semi-structured data from a variety of sources like web pages, web log files, social media sites, emails, documents, and sensor devices from both dynamic and inert devices (Katal et al., 2013).
There are also two significant additions to the above 3 V’s, which make 5 V’s in total:
Verification
This is in reference to security and data verification (Daniel, 2015, Duan et al., 2013).
Value
Oracle came up with the concept of Value as an important characteristic of Big Data. Based on Oracle’s explanation, Big Data is often regarded as of relatively “low value density” (Gandomi and Haider, 2015).
As a result of the current explosion of Big Data, ways to collect and store this data, software tools for data and data-driven insight are more available to business professionals than before. BI & A has now evolved to that of BA.
20
2.3 Business Analytics
Business analytics is quite a new term that is becoming popular in the business world like nothing before in recent history. Olson and Delen (2008) state that nowadays analytics can basically be described as finding out important patterns in data. They also state that in this time of abundant data, analytics is likely to be used on large amounts and varieties of data. The current use of analytics may require extensive computation because of Big Data, so the techniques and tools used for analytics projects influence the most up-to-date methods developed in a wide range of fields such as data science, computer science and management science. The term Business Analytics has been widely used in various contexts, but there is no commonly accepted definition of what BA is. This research follows the Davenport and Harris (2007, p7) definition, which defines BA as “the extensive use of data, statistical and
quantitative analysis, explanatory and predictive models, and fact-based management to drive decisions and actions”.
Companies have used analytics in a variety of ways, which include:
Improving their relationship with their customers (so incorporating all spheres of customer relationship management (CRM) as well as stakeholders),
Developing product and service characteristics and their pricing, which helps to improve customer satisfaction, and
Providing employees with insight as well as the information that they require to make quicker and better decisions,
Progressively, more companies are now preparing their employees with knowledge of BA to drive efficiency and effectiveness in their decision making activities from day to day.
21
2.4 The Use of Analytics in HEIs
Different ways to classify Business Analytics have been demonstrated in literature based on its evolution process, key functionality and application domain. Davenport (2013) stated that the development of analytics started from Analytics 1.0, which was the era of “business intelligence”:
Analytics 1.0 was a time of real progress in achieving an objective.
Deep understanding of providing managers fact-based knowledge to go beyond institutions when making decisions and essential business phenomena.
This was referred to as the era of the enterprise data warehouse used to capture information and of Business Intelligence software, used to question and report it. In wider terms, people did view analytics as a source of competitive advantage but no
one talked about it in today’s terms of “competing analytics”.
The advantage came in the former of greater operational efficiency, therefore making improved decisions or certain significant points to enhance performance.
Cooper (2012) in his discussion about the history of analytics pinpoints a variety of groups from which Learning Analytics draws practices, which includes BI. He stated that “Business Intelligence is essentially the same as “Analytics” but BI has its own character if we consider the typical applications and capabilities of the product category that is generally labelled Business Intelligence” (Cooper, 2012, p5).
Then came Analytics 2.0, which is the era of “Big Data”:
Even though the term “Big data” was not created immediately, the new reality it represented changed the role of data and analytics in those firms that used it very quickly.
22
The difference between big data and small data came about as the former was not generated solely by a firm’s internal transaction system.
Big data came from the internet, sensors of various types, public data initiatives such as the human genome project and captures of audio and video recording, which means it was externally sourced as well.
From a single server, Big Data could not fit as well as being analysed fast enough, so an open source software framework Hadoop was used for fast batch data processing across parallel servers.
No SQL, a new class of databases was used by companies to cope with relatively unstructured data.
During this period, other technologies brought forward include: “in-memory” and “in database” analytics for fast number crunching.
Finally came the arrival of Analytics 3.0, the era of data-enriched offerings: “As emphasis turns to build analytical power into customer products and services” (Davenport, 2013, p67): The innovative big data firms in Silicon Valley started investing in analytics to
provide customer-facing products, services and features.
These firms drew viewers into their websites through better search algorithms, recommendations from friends and colleagues, suggestions for products to purchase and highly targeted ads, all steered by analytics planted in large amounts of data. When other large organisations started to emulate these actions, the Analytics 3.0
point was marked.
Every device, shipment and consumer leaves a trail, giving the opportunity for the analytics and optimisation to be embedded into every decision made at the front lines of an operation.
23
Davenport (2013) also described ways in which Analytics 3.0 can be capitalised. For example:
a) Faster technologies and methods of analysis
With the 2.0 period, Big Data technologies are noticeably quicker than prior generations of technology for data management and analysis were. To accompany them, new “agile” analytical methods and machine learning technologies were introduced to give insights at a much faster rate. The difficulty in the 3.0 era however is to adapt operational product development and decision processes to take advantage of what the new technologies and methods bring forth.
b) Embedded analytics
These are constant with the greater speed of data processing and analysis, models in Analytics 3.0 are often embedded into operational and decision processes, intensely increasing their speed and impact.
This study focuses on the use and impact of Analytics 2.0 and 3.0 in HEIs, supposing Davenport’s perspective on the evolution of analytics is valid.
2.5 Introduction to Learning Analytics
Siemens and Long (2011, p1) state that “analytics is seen as one of the most dramatic factors
in shaping the future of higher education”. According to Van Barneveld et al. (2012), their review on analytics in HE argues that more than two-thirds believe that analytics is a major priority. The current use of analytics may require extensive computation because of Big Data so the techniques and tools used for analytics projects influence the most up-to-date methods developed in a wide range of fields such as data science, computer science and management science.
24
Campbell and Oblinger (2007) brought academic analytics to fruition as a powerful tool for the US HE sector; they state that academic analytics is described as the way to evaluate and analyse organisational data obtained from university systems for decision making and reporting purposes. According to Campbell and Oblinger (2007), academic analytics is used to assist HEIs in addressing things such as student success and accountability while achieving their academic missions. Learning Analytics was then brought forward around 2010 (Ferguson, 2012a), whereas academic analytics became associated more with the business. Goldstein and Katz (2005) state that academic analytics refers to all areas dealing with the business of an academic institution, from financing and budgeting, enrolment management to student progress.
Even though data capabilities have been emerging over the last 10 to 20 years, there has been a wide disengagement between BI and data use for supporting learning-based hypotheses (Freitas et al., 2015). For instance, even though data have been collected in educational databases, the competence and proficiency for using it to improve learning and the student experience has not really started and hardly ever been explored (Ferguson, 2012a, Ferguson, 2012b). Therefore Learning Analytics is becoming popular in HEIs like nothing before in recent history. Learning Analytics is the application of analytics in education. As a result of the current explosion of Big Data, which refers to the variety, velocity and volume of the data produced using ICTs, Learning Analytics is commonly used in the education sector to improve SEM. Van Harmelen and Workman (2012) state that Learning Analytics is the use of analytical techniques to investigate educational data which involves data about learner and teacher activities to find behavioural patterns and give actionable information to enhance learning. Bach (2010) also defined Learning Analytics as techniques used to aid target instructional, curricular and support resources to maintain the success of particular learning
25
goals. Learning Analytics is significantly important to HEIs as it serves as a way to guide operational and strategic activity through improving the student experience.
Learning Analytics has been defined in Chapter 1, but there is also another definition which is “the process of developing actionable insights through problem definition and the
application of statistical models and analysis against existing and/or simulated future data”(Cooper, 2012, p7). Learning Analytics has also been defined by Del Blanco et al. (2013, p1) as “a discipline that gathered and analysed educational data with different
purposes such as seeking a pattern in the learning process and trends or problems in student performance”,and by Greller and Drachsler (2012) as an academic area that concentrated on learners, their learning procedures and behaviours. SLA “focuses on how learners build
knowledge together in their cultural and social settings” (Ferguson and Shum, 2012, p2). Learning Analytics has arisen as a new idea to capture educational big data (Czerkawski, 2014). It is enabled by the development of increasingly refined analytics tools for instance visualisation software, better data formats and improvements in computing technology (HEA, 2017). According to HEA (2017), scientific practices such as Climate Sciences, Biology and Physics have been utilising analytics ever since the 1970s and learning is a late arrival to this particular area of investigation. According to Becker (2013, p63) “Learning analytics places
a greater emphasis on the qualitative data that originate from learning behaviour”.
Czerkawski (2014) states that in the past few years, the Horizon report incorporated Learning Analytics as one of the developing areas of research from 2011. Horizon (2014, p40) offered the following definition for Learning Analytics: “Learning analytics research uses data
analysis to inform decisions made on every tier of the education system, leveraging student data to deliver personalised learning, enable adaptive pedagogies and practices, and identify learning issues in time for them to be solved.”Learning Analytics utilises intellectual online data and has the potential to “to transform educational research into a data-driven science,
26
and educational institutions into organizations that make evidence-based decisions”
(Buckingham Shum, 2012, p12). According to Shacklock (2016a), Learning Analytics has the prospect to be hugely powerful for enhancing the student experience of the university. Shacklock (2016a) also states that to guarantee the students get the optimum benefit from analytics, HEIs should utilise analytics systems that are: planned in discussion with the students, sustained by an ethical framework or policy, driven by the enhancement of learning and teaching procedures and student engagement, tailored to the particular requirements of each HEI and integrated in an HEI’s strategic plan.
Siemens (2013) on the other hand argues that Learning Analytics is about sense making and understanding; He also states that establishments such as the Society for Learning Analytics Research (SOLAR) and the International Educational Data Mining Society are trying to create a research community for Learning Analytics. According to Clow (2013), there are a variety of methods that Learning Analytics utilises, for instance, Social Network Analysis (SNA), web analytics, natural language processing and predictive modelling. Siemens (2013) adds to this by mentioning techniques such as cognitive modelling, which has origins in artificial intelligence (AI), machine learning, BI and statistical analysis. Adejo and Connolly (2017) state that there are three main stakeholders that have great accountabilities in the improvement and utilisation of Learning Analytics technology:
1. The Administrators: Classify the technology, put forward its use, offer a supportive environment, put forward the implementation strategy and observe the utilisation of the tools. Other accountabilities rotate around administrative decision making.
2. The Teachers: select the acceptance, importance and personalisation of the tool to meet the awareness and preference of the learner. The teachers examine the appropriateness of the tools and offer feedback on how to enhance the functionality and performance.