LONG-TERM GAS
IMPORT CONTRACTS
IN EUROPE
THE EVOLUTION IN PRICING MECHANISMS
LUCA FRANZA
VISITING ADDRESS Clingendael 12 2597 VH The Hague POSTAL ADDRESS P.O. Box 93080 2509 AB The Hague TEL +31 (0)70 - 374 66 16 www.clingendaelenergy.comCIEP is affiliated to the Netherlands Institute of International Relations ‘Clingendael’. CIEP acts as an independent forum for governments, non-governmental organizations, the private sector, media, politicians and all others interested in changes and
developments in the energy sector.
CIEP organizes lectures, seminars, conferences and roundtable discussions. In addition, CIEP members of staff lecture in a variety of courses and training programmes. CIEP’s research, training and activities focus on two themes:
• European energy market developments and policy-making; • Geopolitics of energy policy-making and energy markets
CIEP is endorsed by the Dutch Ministry of Economic Affairs, the Dutch Ministry of Foreign Affairs, the Dutch Ministry of Infrastructure and the Environment, BP Europe SE- BP Nederland, Coöperatieve Centrale Raiffeisen-Boerenleenbank B.A. ('Rabobank'), Delta N.V., GDF SUEZ Energie Nederland N.V., GDF SUEZ E&P Nederland B.V., Eneco, EBN B.V., Essent N.V., Esso Nederland B.V., GasTerra B.V., N.V. Nederlandse Gasunie, Heerema Marine Contractors Nederland B.V., ING Commercial Banking, Nederlandse Aardolie Maatschappij B.V., N.V. NUON Energy, TenneT TSO B.V., Oranje-Nassau Energie B.V., Havenbedrijf Rotterdam N.V., Shell Nederland B.V., TAQA Energy B.V.,Total E&P Nederland B.V., Koninklijke Vopak N.V. and Wintershall Nederland B.V.
CIEP Energy Papers are published on the CIEP website: www.clingendaelenergy.com/ publications
TITLE
LONG-TERM GAS IMPORT CONTRACTS IN EUROPE
SUBTITLE
THE EVOLUTION IN PRICING MECHANISMS
AUTHOR
Luca Franza
ACKNOWLEDGMENTS
The author is very grateful to all contributors and reviewers. Valuable comments and feedback were received from colleagues at CIEP, experienced representatives of the gas industry and researchers of other institutes.
COPYRIGHT
© 2014 Clingendael International Energy Programme (CIEP)
NUMBER
2014 | 08
EDITOR
Deborah Sherwood
DESIGN
Studio Maartje de Sonnaville
PUBLISHED BY
Clingendael International Energy Programme (CIEP)
ADDRESS
Clingendael 7, 2597 VH The Hague, The Netherlands P.O. Box 93080, 2509 AB The Hague, The Netherlands
TELEPHONE +31 70 374 66 16 TELEFAX +31 70 374 66 88 EMAIL ciep@clingendaelenergy.com WEBSITE www.clingendaelenergy.com
LONG-TERM GAS IMPORT
CONTRACTS IN EUROPE
THE EVOLUTION IN PRICING
MECHANISMS
TABLE OF CONTENTS
1 INTRODUCTION 9
2 THE TRANSITION TOWARDS HUB PRICING IN
LONG-TERM IMPORT CONTRACTS IN EUROPE 11
2.1 2008-2014: Fast-forward to hub-linked pricing 11 2.2 Renegotiations of long-term import contracts: Implications and consequences
13
2.3 New long-term import contracts 18
2.4 Ongoing adjustments in the European gas market 20
3 HUB PRICES AND SUPPLIES IN EUROPE 21
3.1 Current positioning of the main suppliers to Europe 22 3.2 The influence of flexible supplies on prices 24
4 THE FUTURE OF GAS PRICES IN EUROPE 29
4.1 Expectations for gas demand in Europe 29 4.2 Expectations for global gas supplies with a focus on LNG 31
4.3 Scenario 1: Lower prices 33
4.4 Scenario 2: Higher prices 34
1 INTRODUCTION
The gas pricing scene has changed remarkably since the publication of CIEP’s report ‘Pricing Natural Gas: The Outlook for the European Market’ in 2008. Over the past six years, oil indexation has declined significantly in Europe1 and hub-linked pricing has
rapidly become the basis for an increasing number of transactions in the gas market. By now, hub prices have become the established benchmarks in Northwest Europe. In particular, the Dutch Title Transfer Facility (TTF) serves as benchmark for the rest of Europe, with markers as far south as Italy having largely converged towards it in recent years.
Long-term import contracts have adjusted at a slower pace. This situation has resulted in strong tensions between the sales and purchasing sides of the importers’ contractual structures. Today, after various rounds of renegotiations and arbitrations, these tensions have largely been resolved in Northwest Europe but persist in other parts of Europe.
Chapter 2 retraces the steps that led to the current situation in international long-term contracts, focussing on Northwest Europe. Although geographically limited, this region2 has traditionally led developments in European natural gas markets, as
it accounts for 58% of EU gas consumption and 82% of EU gas production.3 This
chapter further provides a description of how contractual terms have evolved over the past six years by means of inventorying the outcomes of contract renegotiations and newly signed contracts. Besides adding historical knowledge, this account provides useful insights on how the transition towards hub pricing may further unfold in other parts of Europe.
Chapter 3 analyses hub price-setting dynamics. Special attention is devoted to the role of flexible supplies and the positioning of the main suppliers at European hubs,
1 In this study, the term ‘Europe’ is used when describing situations that generically apply to the entire region. Russia is excluded. The term ‘European Union’ or its abbreviation ‘EU’ are used when specifically referring to the 28 Member States (notably, when quoting figures that apply only to those countries). When it is important to clarify whether certain countries (namely Norway and Turkey) are included in the definition of ‘Europe’, this will be explicitly mentioned. For the use of the term ‘Northwest Europe’, see footnote 2.
2 For the purpose of this study on gas pricing, Northwest Europe includes Belgium, France, Germany, the Netherlands and the United Kingdom. These are all relatively large, hub-oriented gas markets in which prices converge around the Dutch TTF.
which retain substantial leverage. The chapter concludes that hub price movements in Northwest Europe can be induced either by variations in aggregate price-taking volumes or by variations in volumes of Russian gas supplied under long-term contracts, depending on the demand environment.
Finally, Chapter 4 looks towards the future and provides a comparative overview of the general expectations about trends in European demand and supply, identifying gas demand in the power sector and LNG as the most important variables. The paper concludes by offering two qualitative, normative scenarios that shed some light on the factors that could lead to a lower or higher price environment in Europe.
2 THE TRANSITION
TOWARDS HUB PRICING
IN LONG-TERM IMPORT
CONTRACTS IN EUROPE
2.1 2008-2014: FAST-FORWARD TO HUB-LINKED PRICINGQuantifying the increase in the share of hub-linked supplies in European import contracts is difficult, as pricing terms are strictly confidential and most available estimates include European domestic supplies. Figures on the shares of hub and oil indexation in Europe vary due to the use of different methodologies: the share of hub indexation in Europe was said to be anywhere between 30% and 55% in 2013.4 Some estimates indicate that this may even have been close to 60% in 2014.5
Notwithstanding doubts about the actual scope of the transition, the fact that hub indexation has made and is still making major inroads into international gas supply contracts in Europe is today a universally accepted reality.
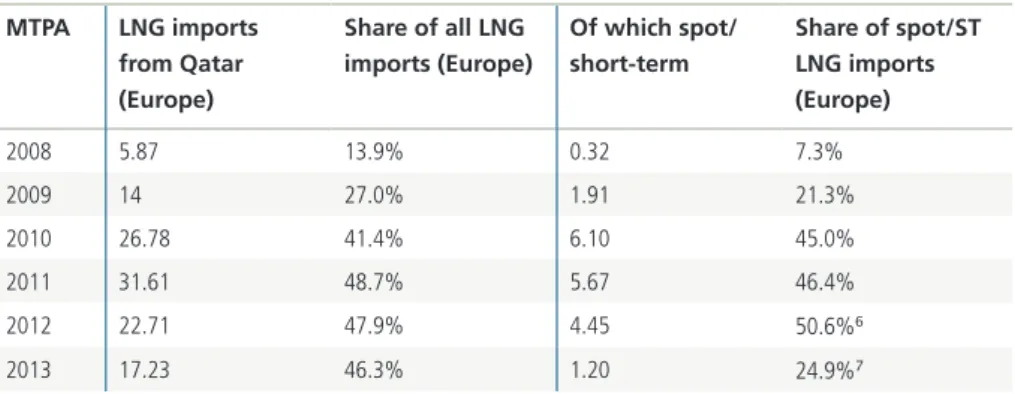
A combination of factors that unfolded at the end of the last decade is at the root of the fast-tracked transition towards hub-linked pricing in Europe. After the North American surge in shale gas production had freed up substantial volumes of gas, a new wave of uncommitted Qatari LNG became available at European hubs.
MTPA LNG imports from Qatar (Europe) Share of all LNG imports (Europe) Of which spot/ short-term Share of spot/ST LNG imports (Europe) 2008 5.87 13.9% 0.32 7.3% 2009 14 27.0% 1.91 21.3% 2010 26.78 41.4% 6.10 45.0% 2011 31.61 48.7% 5.67 46.4% 2012 22.71 47.9% 4.45 50.6%6 2013 17.23 46.3% 1.20 24.9%7
TABLE 1: GROWTH IN TOTAL AND SPOT/SHORT-TERM QATARI LNG IMPORTS TO EUROPE (2008-2013). SOURCE: AUTHOR. DATA: GIIGNL (EUROPE = EU28 + TURKEY). 67
4 The lower end of the range corresponds to the most conservative estimate available, provided by Gazprom in 2013 (30.5% of hub indexation on total consumption and 27.3% on imports only). Reports by PIRA Energy (2013) and Reuters (2013) were also quite cautious (33.3% and 34.8-37.7% of hub indexation). On the other hand, the IGU (2013) estimated that 45% of the gas consumed in Europe was already priced on the basis of gas-to-gas competition in 2012 (53% in 2013). The upper end of the range coincides with Société Générale’s estimate that the share of hub indexation in Europe could have reached 55% following RWE’s success in its arbitration case against Gazprom in 2013. 5 World Gas Intelligence (hereafter WGI), 25 June 2014.
6 Excludes re-exports received and re-exports reloaded. 7 Idem.
As shown by the table, Qatari LNG sales to Europe rose by 138% between 2008 and 2009. In the same period, there was a six-fold increase in spot and short-term (< 4 years) sales of Qatari LNG to Europe. Imports from Qatar grew until the trend slowed and eventually reversed in 2011 due to the Fukushima accident.
At the same time, Europe was hit by a severe economic crisis which had negative repercussions for gas demand, subsequently compounded by fierce competition from coal and renewables in power generation. As a result, EU gas demand fell in 2009 (-7%), 2011 (-11%) and 2012 (-2%)8, then held steady throughout 2013.9 At the
end of 2013, it totalled 63 Bcm less than pre-crisis levels.10 According to preliminary
estimates, gas demand across the EU has further dropped by 9% in 2014 compared with the previous year.11
This led to a protracted buyers’ market.12 While hub prices promptly responded to the
new supply/demand balance, oil-linked contract prices failed to adjust entirely (Graph 1). It was the first time that European hub and oil-linked gas prices had diverged for such a prolonged period of time. For five years, TTF spot prices have been trading at a discount of at least $1 and up to $5/MMBtu relative to oil-linked prices.13
This situation altered the pre-existing market balance. On the one hand, end users enjoyed access to cheaper hub supplies. In the Northwest European market, hub prices – and notably the National Balancing Point (NBP) for the United Kingdom and the TTF for Continental Europe – had already become the benchmarks for transactions between wholesalers and their buyers.
On the other hand, midstream companies were bound by long-term commitments to purchase expensive, oil-linked gas. European importers were thus trapped in a loss-making position, epitomised by E.On’s notorious €2,000,000 daily loss in gas merchant activities over 2011.14 Also due to bullish expectations for gas demand in
previous years, which had already resulted in over-contracting prior to the economic crisis, the 60-70 Bcm downward flexibility available in 2009 contracts was insufficient to absorb the subsequent fall in demand.15 European importers responded by
8 Data from BP Statistical Reviews (2010 onwards) and Eurogas Statistical Reviews. 9 WGI, 8 January 2014.
10 Eurostat data on the EU-28.
11 ‘Mild Weather Reduces Demand in 2014, but Gas Remains Strong in the Heating Market’, Eurogas Press Release, 1 October 2014.
12 Confirmed by Eurostat data.
13 CIEP calculation based on data from Platts.
14 ‘E.On Posts Gas-to-Oil Loss, Says Tackling Contracts’, Reuters, 14 March 2012.
minimising offtake from existing oil-linked long-term contracts in compliance with take-or-pay obligations, but also by seeking price renegotiations16 and new
hub-linked supplies.
GRAPH 1: EVOLUTIONS IN TTF (DUTCH HUB) AND BAFA (AVERAGE GERMAN IMPORT CONTRACT) PRICES. SOURCE: DEPA.
Especially since 2012, the price of Russian supplies under long-term contracts with Northwest Europe has gradually converged towards the TTF price (see Graph 1), largely as a result of contract renegotiations. This also explains why pressure from European importers to renegotiate long-term contracts has eased in recent years. Section 2.2 analyses in more detail the long process of renegotiations and arbitrations that have led to the present situation, while evolutions in pricing mechanisms in newly signed contracts are discussed in Section 2.3.
2.2 RENEGOTIATIONS OF LONG-TERM IMPORT CONTRACTS: IMPLICATIONS AND CONSEQUENCES
Price renegotiations in long-term contracts between buyers and suppliers are generally complex and drawn-out processes, for which solid analysis and interpretation of the business environment form important building blocks. In most cases, the parties eventually avoid arbitration and reach an agreement on new pricing terms, steered by contractual obligations to periodically review prices and by evolving market conditions. On some occasions there may be a shared interest between suppliers and buyers in redefining some of the non-price terms. An example was Algeria’s willingness to reduce its gas exports to Italy and Spain a few years ago, in response to shrinking demand in Southern Europe but also to its growing domestic demand and upstream constraints.17
16 In accordance with the terms set by the contracts.
Yet given the deep and rapid changes that took place in the market, it has proven difficult in recent years to reach negotiated agreements, and the number of arbitration cases has increased as a result.18 The introduction of hub indexation has been one
of the most debated questions. Arbitrators have often recognised the buyers’ claim for hub indexation, save for contracts targeted to markets that lack integrated hubs, as seems to have been the case in Sonatrach vs. Gas Natural (2010).19 It is, however,
important to distinguish full hub indexation from partial hub indexation, as well as from more creative forms of ‘indirect’ hub indexation.20 The next subsection sheds
some light on how hub indexation has made inroads into long-term contracts in Europe.
The introduction of hub indexation
Some suppliers have been willing to disclose their position on pricing. Statoil, for example, appears to have accepted the introduction of direct hub indexation in its contracts with large European importers such as Gasterra, E.On, RWE and GdF. In November 2013, Statoil declared that almost half of its supplies to Europe were priced on the basis of gas-to-gas competition, and that all of its contracts with Germany and almost all of its contracts with Belgium, the Netherlands and the United Kingdom contained at least partial hub indexation.21Statoil also has fully hub-linked
contracts,22 such as the contract it signed with Wintershall in 2012. It is important to
point out that as a consequence of re-pricing, the Norwegians regained control of flexibility and started to “sell it as a separate product, or use it as a trading tool”.23
Gasterra has also publicly declared its support for the TTF virtual trading hub as a basis for gas trade.24 In its 2011 Annual Report, Gasterra stated that it “views the TTF
as being an efficient way to trade gas and a good opportunity to stimulate supply and demand”.25 In 2013, the consultancy DNV Kema indicated that almost all the
gas marketed by Gasterra in the Netherlands was offered at hub-linked prices, and that the Dutch company has gradually been introducing more hub indexation in its export contracts.26
18 Sarzana S., ‘The Rise of Price Revision Arbitrations’, Commercial Dispute Resolution, 31 October 2012. 19 ‘Sonatrach Wins the Right to Increase Prices to Spain’, ICIS Heren, 17 August 2010.
20 Idem.
21 Makan, A., ‘Statoil Breaks Oil-Linked Gas Pricing’, Financial Times, 19 November 2013.
22 Bloomberg, 18 February 2014, see: http://www.businessweek.com/news/2014-02-18/statoil-merges-gas-trading-with-oil-to-suit-freer-eu-market quoting declarations by Eldar Saetre (Statoil) given on 12 February 2014.
23 WGI, 13 February 2013.
24 GasTerra intervention at the European gas hub market conference, Frankfurt (5 December 2011), quoted in Heather, P., Continental European Hubs: Are they fit for purposes, Oxford Institute for Energy Studies, 2012.
25 Gasterra Annual Report 2011.
Gazprom introduced hub indexation for the first time in 2010, when a 15% spot component became part of the formula applied to its contract with E.On.27 Gazprom
was then forced by arbitration panels to extend partial hub indexation to other contracts, including its supply contract with RWE, but never to introduce full hub indexation. It has been suggested that Gazprom might reconsider its willingness to enter into long-term contracts if these were to become fully hub-linked. An interesting compromise reached by Gazprom with Eni and PGNIG is the introduction of what Gazprom defines as “indirect spot pricing”,28 consisting of the application of
a ‘price corridor’, the functioning of which is explained in the graph below:29
GRAPH 2: FUNCTIONING OF ‘PRICE CORRIDORS’. THE SOLID LINE SHOWS THE APPLIED PRICE. WHEN THE PRICE OF OIL-LINKED GAS IS HIGHER THAN THE PRICE OF GAS AT THE HUB (MONTH-AHEAD), THE MAXIMUM PRICE THAT THE BUYER WILL PAY IS A MONTH-AHEAD PRICE WITH A PREMIUM (MONTH-AHEAD + X). WHEN THE PRICE OF OIL-LINKED GAS IS LOWER THAN THE PRICE OF GAS AT THE HUB, THE MINIMUM PRICE THAT THE BUYER WILL PAY IS A DISCOUNTED MONTH-AHEAD PRICE (MONTH-MONTH-AHEAD – X). IF THE PRICE OF OIL-LINKED GAS IS WITHIN THE BAND OF MONTH-AHEAD ± X, THE OIL-LINKED PRICE WILL BE APPLIED.
In the course of 2013, pressures for the renegotiation of Russian contracts appeared to ease in Northwest Europe. As a matter of fact, price levels in Russian contracts have largely aligned with TTF hub prices, although the majority of these contracts still formally do not include full hub indexation.
27 Belton, C., Crooks, E., ‘Gazprom in Contract Shake Up’, 25 February 2010.
28 RIA Novosti, 6 November 2012, see: http://en.ria.ru/business/20121106/177225068.html.
29 “Sources familiar with Gazprom say it is possible to set ‘corridors’ or fixed points for formula-based price dynamics where the corridor limits are linked to spot prices, but the formula itself does not incorporate a direct link”, WGI, 7 November 2012.
In 2014, pressures eased in other countries as well, notably in May when Eni obtained a “landmark deal with Russia's Gazprom that [abandoned] a 50-year old system of indexing gas supplies to oil prices”.30
Apart from introducing hub indexation, renegotiations have introduced other novel elements, bringing additional complexity and diversity to the scene of international long-term gas contracts in Europe. These changes are described in the next sections.
Alternative, non-structural changes to the pricing formulae
A closer look at renegotiation cases confirms the idea that non-European suppliers have been striving to resist structural changes in price formation mechanisms. Notably Russia, Qatar and Algeria have traditionally been keen to preserve the basic concept of oil-indexation in long-term supply contracts. Gazprom in particular has consistently attempted to make price reductions originating from non-structural changes more attractive than those offered with the introduction of partial spot indexation.31
On some occasions, as in the 2012 Gazprom-E.On deal, suppliers have agreed to one-off price reductions.32,33,34 In other cases they have granted long-lasting discounts by
adjusting the components of traditional netback formulae, which nonetheless have formally retained their essential characteristics, including oil indexation:
Pn = P0 + [x % * COEFF * (LFOn – LFO0)] + [y% * COEFF * (HFOn – HFO0)]35
Examples of the latter kind include lowering the base price for gas (P0), modifying the relative influence of different oil products on price formation (x% and y%) and lowering the coefficients (COEFF) that set the pass-through rate to these products.36
30 Vukmanovic, O., Jukes, S., ‘Italy's Eni Wins First non Oil-Indexed Gas Feal from Russia’, Reuters, 23 May 2014. 31 As concluded by analysts of Energy Intelligence after a comparison between the prices paid by different utilities after their
renegotiations with Gazprom, see WGI, 18 April 2012. 32 WGI, 4 July 2012.
33 E.On Website, see: http://www.eon.com/en/media/news/press-releases/2012/7/3/eon-reaches-settlement-and-raises-group-outlook-for-2010.html.
34 ICIS Heren, see: http://www.icis.com/resources/news/2012/07/03/9575002/e-on-and-gazprom-settle-natural-gas-long-term-contract-price-dispute/.
35 Traditional netback ‘Groningen’ formula, adaptation from Energy Charter, Chapter 4 (Pricing) available at: http://www. encharter.org/fileadmin/user_upload/document/Pricing_-_chapter_4.pdf. Pn is the final price of gas, P0 is the initial price of gas, what follows in brackets is the price change of competing fuels in the given n period, x and y % are the relative weights attributed to heavy fuel oil (HFO) and low fuel oil (LFO), and COEFF is the discount rate applied to the oil product (often 80 or 90%).
36 “A source at Gazprom Export, Gazprom's exporting arm said that the coefficient used to calculate the price of Russian gas exports against the price of a basket of oil products had been changed, allowing for more flexibility in the final bill”, quoted in Soldatkin, V., ‘Gazprom Adjusts Gas Prices for European Companies’, Reuters, 17 January 2012.
There are indications that the earlier price cuts in the Gazprom-Eni and Sonatrach-Edison contracts originated mainly from changes to the P0, which also applied to Gazprom’s German contracts.37,38,39
Due to confidentiality, it is not always possible to establish the extent to which price reductions have resulted from one-off discounts or to which they have become permanently embedded in the formulae. As previously mentioned, Gazprom has widely resorted to both mechanisms since 2011-2012, offering discounts on oil-linked sales to a number of Western European importers.40 Discounts have typically
been between 7 and 10%. In many cases they were made retroactive, returning hundreds of millions of euros to the buyers. Central-Eastern European resellers such as Poland’s PGNIG and Bulgargaz, which have traditionally paid higher prices than their Western European counterparts, obtained larger discounts of up to 15-20%.41
Negotiated augmentation of flexibility and reduction of the offtake
Another outcome of the recent round of renegotiations has been the diminution in volumes traded under long-term, oil-linked contracts. Responding to the resellers’ difficulty in marketing gas volumes linked to oil prices, some exporters have in fact allowed a reduction of the required minimum offtake. This has been achieved both through one-off derogations to the take-or-pay principle and formal abatements of the Minimum Contracted Quantity (MCQ). In 2012 for instance, the take-or-pay threshold has been lowered from 85 to 75% in the Eni-Gazprom contract42 and
from 90% to 80% in the Bulgargaz-Gazprom contract.43 In July 2014, Eni publicly
reiterated that it had “reached a significant reduction in the minimum offtake requirements” in its contracts.44 However, Russia has often demanded that these
schemes be only temporary, so that the buyer is required to make up for its lower offtake by purchasing more gas in the following years.
Less frequently, deals have involved cuts in annual contracted quantities (ACQs), as in the Sonatrach-Eni deal of March 2013.45 An important implication of these
measures is the increased flexibility provided by some long-term pipeline contracts.
37 For Gazprom-Eni: WGI, 21 March 2012. 38 For Sonatrach-Edison: WGI, 8 May 2013. 39 For Gazprom’s German contracts: WGI, 3 July 2013.
40 Eni, Gdf, E.On, Wingas, OMV, Sinergie Italiane, Edison, see ‘E.On, RWE and PGNiG Last to Complete Gazprom Negotiations’, Natural Gas Europe, 20 June 2012.
41 WGI, 21 November 2012. 42 WGI, 7 March 2012. 43 WGI, 21 November 2012.
44 ‘2014 2Q Results and Strategy Update’, Speech by CEO Claudio Descalzi, London, 31 July 2014. 45 ‘Eni, Sonatrach Reach Deals on Gas Supply Contracts’, Argus Media, 28 May 2013.
This contrasts with the lower flexibility of LNG supplies – where take-or-pay usually amounts to 95 or 100% – and the lower flexibility offered by new hub-linked contracts, such as those with Statoil.
Other changes introduced by renegotiations
Finally, a number of tailored provisions favourable to buyers have been introduced in long-term contracts. For instance, Eni and Gazprom now have the right to reopen pricing talks at any time instead of every three years.46 In today’s highly volatile
environment, it is indeed important for European buyers to constantly keep supply prices in line with market trends. GdF, for example, has catered to this need by adopting a ‘dynamic approach to pricing’, which basically implies renegotiating contracts every one or two years.47 The modification of backward oil indexation periods from the
original ‘12.0.6’ structure to ‘6.0.3’or ‘3.0.3’ structures48 – another outcome of
one of Eni’s renegotiations with Gazprom – is a confirmation of the acceleration in the responsiveness of contracts to changes in pricing.49 The introduction of coal
indexation has also been part of the discussion, but there are no confirmed reports that this has materialised in any of the supply contracts under renegotiation.50 2.3 NEW LONG-TERM IMPORT CONTRACTS
As mentioned, the transition towards hub-linked pricing has not only been driven by renegotiations but also by the signing of new contracts.
With regard to newly signed contracts for pipeline sales to Europe, there is a clear trend towards shorter commitments and a transition to full hub indexation. New long-term contracts are still being signed, although their duration (typically around 10-15 years) is lower than the average duration of legacy contracts (20-25 years).51 Nevertheless, the signing of 25-year contracts between European buyers
and Azerbaijan in 2013 shows that when guarantees are needed to finance large infrastructural projects, the duration of new contracts can still be very long. The trend towards shorter contracts is due almost exclusively to the new contracts being signed. As a matter of fact, there are no signs of downward modifications to contract duration in renegotiations. Besides, only isolated and not particularly illustrative
46 ‘Eni Gets Joker from Gazprom’, Energy Intelligence, 21 March 2012.
47 ‘GDF Suez to Renegotiate 80% of European Long-term Gas Supply Contracts by 2013’, Platts, 9 February 2012. 48 ‘12.0.6’ indicates that the price of gas is indexed to the average price of an assortment of oil products over the previous
12 months, that there is an interval of 0 months between the end of the twelve-month period and the introduction of its average price into the formula, and that the price obtained through this formula will be applied to the gas contract for the next 6 months.
49 Interview conducted by the author. 50 WGI, 4 July 2012.
cases of expired long-term contracts have not been renewed.52 Concerning pricing
mechanisms, it is worth highlighting that all the newly signed deals appear to contain hub indexation. Azerbaijan confirmed that part of its output from Shah Deniz-2 will be priced on the basis of gas-to-gas competition,53 and Statoil signed new hub-linked
supply contracts with European buyers, including with Wintershall in 2012.54
As far as LNG is concerned, the majority of Europe’s supply contracts are still long-term and linked to oil, with the additional constraint that they have much lower flexibility than pipeline contracts.55 The main LNG supplier of European hubs, Qatar,
staunchly defends oil indexation for long-term contracts, although it sells LNG priced on an NBP basis in the United Kingdom. In fact, long-term contracts still cover 80% of Qatar’s LNG supply.56 For the future, the International Energy Agency (IEA) estimates
that 80% of the supply from LNG projects under construction worldwide has already been contracted on a long-term basis.57 What is more, renegotiations of LNG supply
contracts are less common than in pipeline gas, even if Edison’s arbitration success against Rasgas in 2012 has encouraged other European LNG buyers to ask for pricing revisions.58
Similar to pipeline contracts, the average duration of new long-term LNG contracts is decreasing, and 10-15 year commitments are becoming very common.59 However,
the share of LNG sold to Europe on the spot market or under short-term contracts60
has collapsed in recent years due to high demand in Asia. In 2010, 18.7 Bcm of LNG (21% of Europe’s LNG net imports) were bought on the spot market or under short-term contracts. In 2012, this figure shrank to less than 10 Bcm (or 15% of Europe’s LNG net imports), and plummeted to 2 Bcm in 2013.61
52 One example is Gazprom’s long-term supply contract to Turkey through Ukraine, Romania and Bulgaria that expired in 2011 and was not renewed. The main reason why the contract was not renewed is because Russia is now exporting to Turkey through an alternative route.
53 Declaration by Elshad Nasirov (SOCAR), cfr. “Soon Shah-Deniz consortium will sign first contracts to sell gas to European consumers”, Caspian Oil and Gas, 28 August 2013.
54 ‘Norway's Statoil Signs Spot-indexed Natural Gas Deal with Wintershall’, ICIS, 20 November 2012. 55 The take-or-pay level in LNG contracts is typically 95 to 100%.
56 Based on GIIGNL data.
57 World Energy Outlook 2013, International Energy Agency (IEA).
58 Vukmanovic, O., Jewkes, S., ‘Edison's 450 Mln Euro Discount on Qatari LNG Holds Hope for Europe’, Reuters, 11 September 2012.
59 The Iberdrola-Dong contract signed in 2010, the Iberdrola-BP contract signed in 2011, the Rasgas-EDF Trading contract signed in 2012, and the Statoil-Wintershall contract signed in 2013 all have a duration of 10-15 years.
60 Four years or less. 61 Based on GIIGNL data.
Today, a distinctive feature of LNG trade is destination flexibility. While most LNG contracts are still formally point-to-point, long-term and oil-linked, the emergence of self-contracting and aggregators has introduced new business models in which LNG trade is effectively subject to short-term dynamics. Similarly, in its new contracts with E.On, Centrica and other British importers, Qatar successfully introduced ‘put-options’ clauses. These allow Qatar to sell gas to Europe when demand and/or prices in Asia are not sufficiently high, essentially making of Europe a fall-back destination.62
2.4 Ongoing adjustments in the European gas market
As a consequence of the readjustments described above, the gap between contract prices and hub prices is narrowing significantly in Europe, as hub indexation elbows in to long-term contracts. Despite the narrowing gap between contract and hub prices, however, the European gas market still has to fully adjust.
First, a number of import contracts outside Northwest Europe have been insufficiently remedied by the recent changes in pricing and are still predominantly linked to oil. Buyers in Southern Europe have until recently referred their suppliers to arbitration on the premise that their contractual terms did not reflect the existing market conditions.63 While some of them have made significant progress in renegotiating
terms in 201464, they still have to reach the target of achieving a fully competitive
portfolio.
Second, some of the changes introduced in renegotiated contracts throughout Europe are meant to be temporary. Gazprom has notably secured clauses stating that the renegotiated terms only apply to the ‘price review period’ (typically three years), entailing that when this period is over, the previous conditions will be reinstated.65
In the last months, Gazprom has insisted on defending oil indexation and in August 2014 E.On was still lamenting the lack of progress in its negotiations with the Russian company66.
However, it remains to be seen whether Gazprom is genuinely committed to imposing the old terms – and if so, whether it will be able to succeed in this endeavour – or whether it is simply temporising while having already (reluctantly) accepted the new reality.
62 Tuttle, R., Shiryaevskaya, ‘Qatar to Boost Europe LNG Sales as Gas Trades at 7-Year High’, Bloomberg, 23 December 2013. 63 For instance, Eni referred Statoil to arbitration in August 2013, saying that the gas it was buying from Norway was
the most expensive it had ever bought. See ‘Eni May Seek up to $10 Billion from Statoil in Gas Dispute’, Reuters, 28 November 2013.
64 Notably Eni with Statoil and Gazprom. 65 Interviews conducted by the author. 66 WGI, 20 August 2014.
3 HUB PRICES AND
SUPPLIES IN EUROPE
Even if it is important to maintain the analytical distinction between price formation and price levels, the two themes are clearly interrelated. Because of their effect on price levels, decisions on price formation mechanisms can also have some bearing on the competitiveness of gas in the energy mix.
One line of argument followed by policy-makers in promoting gas-to-gas competition as a basis for pricing was that this would make gas more affordable. By now, Northwest European market players, too, have largely indicated that they seek hub indexation as a basis for pricing. A consensus thus seems to have been reached in this region and, as described in the previous chapter, gas prices have indeed diminished. Yet gas prices at TTF – the marker for Northwest Europe – have been in the range of
€24-€27/MWh since 2012. At this level, gas is still too expensive to compete with coal in power generation. Gas-intensive industries are also losing competitiveness in relation to North American competitors because of their higher gas bills.67 Energy cost
is certainly still a matter of concern for policy-makers in Brussels. Some among them denounce gas prices as being ‘excessively’ high and suggest that the gas industry is not doing enough to keep them at reasonable levels, although it is unclear whether they are referring to contract prices or hub prices.68
While it is difficult to ascertain whether or not gas prices are ‘too high’, as the answer would depend on which perspective is adopted as well as on the basis for comparison,69 we can qualitatively discuss some of the factors that influence gas
price formation in Europe.
Naturally, supply and demand lie at its root. On the demand side, a factor that certainly played a role has been the scale of the demand destruction experienced by Europe since 2009. On the supply side, important variables have been the fast decline
67 The price of gas paid by European industrial users is lower, however, than the price paid by their Northeast Asian competitors.
68 ‘Gas Week 2013: A Call for Reflection’, Gas Naturally, 23-25 April 2013, declarations available at: http://www. naturalgaseurope.com/gasnaturally-gas-week-2013-brendan-devlin.
69 The answer would also depend on what segment of the value chain is considered, but this report looks exclusively at wholesale prices.
in European domestic production, outages in upstream and import infrastructure70
and strong demand in Asia.71
Other elements affecting hub prices are the structure of the market – including aspects such as the number of supply sources and the prevailing contractual arrangements – and the volume of business at hubs, which is a related issue. In addition, a variety of short-term factors can influence hub prices, including storage levels.72
The following sections focus on the supply environment which, as we will discuss in §3.2, is a particularly important factor in hub price formation.
3.1 CURRENT POSITIONING OF THE MAIN SUPPLIERS TO EUROPE
In well-functioning hub-based markets like the United States, a large number of players participate in both gas supply and trading. At Northwest European hubs, liquidity and traded volumes have increased considerably in the past few years. Apart from the lower costs of gas production in the US, the main difference between the US and Europe is that while a myriad of small and medium-sized domestic producers contribute to hub trade in North America, the primary supply to Europe is still highly concentrated. It is therefore all the more relevant to understand how suppliers participate in hub trade in Europe and how this relates to their long-term views and strategies.
Dutch and Norwegian producers have largely introduced hub indexation in their contracts, fulfilling the preference expressed by the buyers.73 This certainly helped
them maintain their production levels and sales in a time of declining demand. The active participation in gas trading by Norwegian producers and by Gasterra at TTF gave substantial impetus to the emergence of robust hub-based price benchmarks in Northwest Europe.
In spite of its rejection of full hub indexation in long-term contracts, Gazprom is also an active player at European hubs, notably in the UK.74 Some of Gazprom´s hub
activities may be dictated by long-term objectives. Gazprom´s efforts to integrate down the value chain, which include the establishment of trading divisions in Western
70 Especially frequent outages in the Langeled pipeline, which resulted in NBP price spikes. 71 Resulting in there being less supply available for Europe.
72 For the role of storage, cfr. Medium-Term Gas Market Report 2014, IEA. Storage mainly plays a role in price changes within the year. When it has an impact on year-on-year price evolutions, its finite nature entails that this impact will not be a long-term one.
73 Brown, M., ‘UK’s Record Norway Gas Need Spells Price Jumps: Energy Markets’, Bloomberg, 8 March 2013. 74 Powell, W., ‘Statoil Ditches the Theory, Beating Gazprom in Practice’, 18 February 2013.
Europe, possibly underscore the company´s aim to develop the expertise that would allow it to sell gas directly in the market.75 Short-term gas sales over hubs are not
yet a core business for Gazprom, which still widely supplies its gas under long-term contracts to European wholesalers that, in turn, market it downstream. However, it can be argued that if Gazprom gains further direct access to the market, its need for long-term contracts and wholesale buyers will be reduced. Given the volumes it supplies to Europe, Gazprom would likely be the most influential hub player if long-term contracts were long-terminated and 100% of its gas were traded on hubs.
Qatar holds the position that prices in its firm, long-term LNG supply contracts should be based on oil indexation. However, it appears to accept hub-linked prices for short-term supplies and ‘flexible’ long-short-term contracts (see also §3.2). The country stands out as the largest provider of spot and short-term LNG volumes to Europe76. Given
the weakness of Europe’s netbacks relative to those of Asia, the fact that Qatar continues to supply European spot market seems counterintuitive. However, we have to take into account the fact that Asia is far from being a fully traded market. Hence, Qatar sends its ‘surplus‘ LNG to Europe once Asian demand is satisfied, as Europe is the best fall-back destination. Considerations such as sunk costs from acquired regasification capacity in Europe, notably in the UK, also play a role in Qatar’s choice of markets – together with other secondary factors. Finally, ‘put-option’ clauses exist in contracts with Europe and North America, which allow Qatar to direct supplies at its own discretion. In any case, Qatar’s main focus is on the Asian market and its spot and short-term supplies to Europe constitute only a small part of its LNG production.
Algeria is not a major hub player, and its downstream presence in Europe is scarce. Sonatrach is a hard-liner in defending oil indexation and proposed coordinated action to its partners in the Gas Exporting Countries Forum (GECF), though with no results.77
Since Southern European hubs are less developed than hubs in Northwest Europe, Sonatrach has so far been able to resist the introduction of hub indexation. Unable to export significant incremental volumes and aware that it will lose market share in future, Algeria is likely to hold on to its position of defending oil indexation in long-term contracts.
75 Gazprom Export website, see: http://www.gazpromexport.ru/en/strategy/consumers/. 76 Based on GIIGNL data.
3.2 THE INFLUENCE OF FLEXIBLE SUPPLIES ON PRICES
As a general rule, supply and demand are the basic drivers of hub price setting, but in order to understand hub price formation in Northwest Europe it is necessary to look specifically at flexible supply. In fact, inflexible supply is by definition insensitive to price, and gas demand is inelastic in the short term. On the other hand, flexible supplies adjust to price movements and, in doing so, influence price levels. First of all, it is possible to distinguish two broad categories of flexible supply: ‘divertible’ supplies – notably LNG – which will be taken to a market of choice on a global basis, and supplies with ‘volume flexibility’ – notably pipeline gas – which may or may not be produced.
More specifically, Europe relies on four types of flexible supplies:78
• Uncontracted pipeline supply. Norway and the Netherlands are already important suppliers of uncontracted pipeline gas, offering part of their production as spot sales. Within the limits of its production capacity, Russia may also be in a position to export more gas than the gas it supplies under its long-term contracts, in view of its spare transportation capacity.
• Uncontracted LNG. Spot cargoes that can be freely traded worldwide will be sold to Europe if European hub price levels generate a more rewarding netback than alternative options (or in the absence of alternatives), although strategic considerations and portfolio dynamics may also influence the decisions.79
• Divertible LNG. Some contracts allow sellers80 to divert LNG contracted to Europe,
often under long-term arrangements, to more rewarding destinations, making it essentially subject to the same dynamics as uncontracted LNG. Provisions of this nature have become more common in recently signed contracts, and the 14-MTPA Qatar LNG supply line to the UK can also be considered to fall in this category. The main difference between divertible and uncontracted volumes is that the former have contractual access to LNG terminals.
These first three types of supply are flexible at the sellers’ discretion. If sellers, on their own accord, bring uncontracted pipeline gas and LNG to the European market, they must accept the prevailing hub price, which makes them ‘price-takers’. Nevertheless, on the whole, they will influence hub price levels in the process. It is important to observe that the availability of these volumes for European buyers is not guaranteed. If buyers need additional gas from these sources on a flexible (short-term) basis, they must agree to a price that is sufficiently attractive to the sellers.
78 ‘A Framework for understanding Hub Pricing’, Timera Energy, 2013. 79 Ibid.
The last category of flexible supplies, which differs considerably from the first three, comprises:
• Flexible volumes in long-term pipeline contracts (e.g. any volumes above the minimum take-or-pay threshold). While flexibility was primarily designed to provide buyers with seasonal flexibility, it also lends itself to discretionary uses. Notably, the buyer will seek to minimise offtake if hub prices are lower than contract prices and maximise offtake if hub prices are higher than contract prices. Flexible volumes in long-term pipeline contracts are flexible at the buyers’ discretion, meaning that a buyer has the right to call on these supplies if required for its portfolio optimisation and management. Considering the entirety of market players, this flexibility offers the opportunity to attune supply and demand.
Hub price-setting dynamics in Northwest Europe
With this framework in mind, it is possible to make some observations about recent hub price-setting dynamics in Northwest Europe.
As we have seen in Chapter 2, hub prices have become the benchmark for the Northwest European gas market over the past few years. We assume that during this period – after some initial reluctance on the part of the suppliers – almost all European production was eventually sold on a hub-price basis in Northwest Europe. The same holds true for uncontracted and divertible LNG volumes, which can thus be regarded as price-takers.81 In the same period, volumes supplied under oil-linked
long-term contracts – predominantly with Russia – were considerably more expensive. In this price environment, buyers would have been purchasing Russian gas above minimum offtake obligations only to cover demand they were unable to meet with volumes available at hub-linked prices (‘residual demand’).
In a market in which almost all supplies except for Russian gas are priced on a hub basis, as is the case in Northwest Europe, the following two supply situations can arise:
1. If residual demand is lower than the volume of Russian gas that the buyers are contractually obliged to purchase, Russian gas has no influence over hub prices. The gap between contract prices and hub-linked prices remains, and buyers of Russian gas merely fulfil their minimum contractual obligations (though at a
81 For the purpose of our analysis, a price-taker is a supplier that sells gas to the market, accepting the price determined by the hub trade. This does not mean that price-taking volumes do not influence hub prices: for instance, a situation of oversupply from price-taking volumes may very well result in lower hub prices.
higher cost). This situation is clearly unsustainable in the longer term, and there will be strong pressures to renegotiate contracts. Under these circumstances, the only supplies that are left to influence hub prices are ‘price-taking’ volumes, and notably LNG. In 2009, for instance, large volumes of LNG became available in Northwest Europe (§2): while individual cargoes were ‘price-takers’, their aggregate volume exerted a downward pressure on hub prices, thus having a ‘price-setting’ impact.82
2. When residual demand exceeds the volume of Russian gas that the buyers are contractually obliged to purchase, Russian gas sold under long-term contracts is the marginal supply in Northwest Europe. Because hub prices tend towards the marginal price, Russian volumes have a price-setting role under these circumstances.
It appears that the first situation has prevailed in recent years. In fact, the existence of a consistent gap between the price of Russian gas and hub prices has been the rule rather than the exception since 2009.
It is not entirely clear whether the second situation arose more recently, when Russian prices and hub-linked prices converged as a result of renegotiations and arbitrations. In combination with this convergence, Gazprom realised record sales in Northwest Europe in 2013. This suggests that residual demand then exceeded the MCQs in Russian contracts – or that make-up rights on earlier offtake deficits were expiring.83
It is also not unthinkable that uncontracted Russian gas was placed in the Northwest European spot market in this period.
It seems safe to assume that the new price of Russian gas determined by the last round of renegotiations has not been set to remain at a lower level than hub-linked prices on an annual basis. Therefore, looking forward, it is likely that hub price setting will be subject to the same dynamics as in the two situations described above. In the event of the first situation, a price gap would remain and buyers of Russian gas would continue to suffer financially. If the second situation were to arise, Russian contract prices would strongly influence hub prices, as economic theory suggests that market prices will gravitate towards the marginal cost of supply. In the course of a year, hub prices might occasionally move above Russian contract prices, giving buyers the opportunity to offtake the volumes they need, but on an annual basis Russian gas would be the marginal supply.
82 This analysis is also confirmed in the Medium Term Gas Market Report 2014, IEA.
As mentioned above, it is quite possible that larger volumes of Russian gas besides those supplied under long-term contracts will find their way into Northwest Europe. By doing so, Gazprom risks undermining the pricing structure it seeks to uphold under its long-term contracts. However, the additional cash flow deriving from the monetisation of its considerable spare production capacity84 may be a sufficiently
attractive prize to follow this course of action.
Only when Russian volumes are fully indexed to hub prices will the price-setting nature of Russian contracts disappear and will the decision of whether to purchase Russian gas be based purely on portfolio considerations.
84 In 2013, Alexei Miller said that Gazprom has a production capacity of 617 billion cubic metres per year but produces less because demand is lower. See: http://en.ria.ru/business/20140113/186486506/Gazprom-Says-Europe-Gas-Exports-Up-16-in-2013.html.
4 THE FUTURE OF GAS
PRICES IN EUROPE
In the previous chapters we described how evolutions in supply and demand have transformed the European market environment since 2008-2009, leading to an increase in gas volumes traded at hubs and a high share of hub indexation in international long-term contracts. In this final chapter, we delineate two normative scenarios up to 2025, with the aim of indicating under what circumstances European hub prices might rise or decline.
Future developments in European gas demand, and especially demand for non-domestic gas, play a key role in both scenarios. On the supply side, LNG is the only import source that can provide Europe with large additional volumes besides Russian gas, while also suiting Europe’s diversification efforts. Prospects for future global LNG supply are thus another important variable to take into account. The following sections address these two elements in more detail, describing the general expectations and the range of uncertainties in their outlook.
4.1 EXPECTATIONS FOR GAS DEMAND IN EUROPE
For demand, we have compared twelve scenarios by four leading institutions:
GRAPH 3: COMPARISON OF TWELVE SCENARIOS FOR EUROPEAN GAS DEMAND UP TO 2030.85 THE DOTTED LINES REPRESENT ‘REFERENCE CASES’ (OR ‘CENTRAL SCENARIOS’), WHICH NEED TO BE DISTINGUISHED FROM OTHER SCENARIOS, GIVEN THE HIGHER DEGREE OF PROBABILITY ATTACHED TO THEM BY THE VARIOUS INSTITUTES.
85 Since the scenarios adopted different country samples and contained diverging data on 2010 demand levels, we harmonised them to the average 2010 demand (546 Bcm), deriving the curves through the CAGRs (Compound Annual Growth Rates). Since the scenarios did not present full data on all years, we derived missing data by assuming constant CAGRs over periods up to the first year with available data. For these reasons, the curves do not faithfully represent the
According to most of the scenarios analysed, European gas demand in 2015 will still not have reached 2010 levels. Given the lack of a recovery as of December 2014, this is now a certainty. Some of the older scenarios in the sample have already been contradicted by facts86, and appear to greatly overestimate demand in 2015. The
most recent scenarios, which are those provided by the World Energy Outlook 2014, capture more accurately the collapse in gas demand between 2010 and 2015. Since demand in 2010 was as high as in 2005, the last ten years can be regarded as a “lost decade” for gas in Europe.87
In ten of the twelve scenarios included in our sample, gas demand will grow after 2015, although there is no consensus as to whether demand will have fully recovered by the end of the decade. If we consider only the central scenarios, the Eurogas’
Base Case points out that demand will return to 2010 levels around 2020, while EIA’s
Reference Case is even more optimistic, projecting parity in 2016-2017. Yet CERA’s
Reference Case and IEA’s New Policies88 present a much bleaker picture, with full
recovery expected only after 2025 and 2030 respectively. Our comparison shows a clear upward trend between 2020 and 2030, with generally higher annual growth rates towards the end of the period.
With regard to use by sector, as noted by the IEA, power generation “holds the key for gas demand in Europe”.89 Variance among scenarios is mostly explained by
different assumptions concerning the use of gas in electricity production. As a matter of fact, the projected gas demand in the power sector (Graph 4) largely mirrors the projections for total gas demand portrayed in the previous graph.
GRAPH 4: COMPARISON OF SEVEN SCENARIOS FOR EUROPEAN GAS DEMAND FOR POWER GENERATION UP TO 2030.90
86 Gas demand in the EU-28 has been flat in 2013 and, according to preliminary estimates by Eurogas, it will drop by 9% in 2014 compared with 2013.
87 In the words of the IEA: http://www.iea.org/newsroomandevents/news/2013/may/name,37375,en.html. 88 WEO, 2014.
89 WEO, 2013.
90 Obtained with the same methodology as used in Graph 3 (above).
It is widely expected that demand for gas in power generation will be limited through 2020 by sluggish electricity demand, low coal prices and low CO2 prices, compounded by the persistence of policies in favour of renewables. The graph suggests that according to the three Eurogas scenarios a recovery could take place as early as 2015. However, since annual data are derived by equally spreading the expected growth in demand over the period 2015-2025, it is also very possible that the demand expected by Eurogas in 2025 would be the result of growth that would take place only after 2020. In any case, we can conclude that except for the IEA’s 450 Scenario, all scenarios expect growth starting in 2020 at the latest. The IEA points out that growth would mainly be attributable to higher electricity demand, the expected closure of some inefficient coal plants and the need for additional capacity to accommodate variable power generation from renewables.91 Although it
is difficult to clearly single out the effect of ETS developments on gas demand from the scenarios, it is likely that a hardening of the ETS, leading to higher CO2 prices, would translate into higher gas demand.
Besides trends in power generation, the rising need for gas in transportation emerges as an additional engine for growth in gas demand in the 2020-2030 period. Finally, by examining the underlying assumptions of the scenarios, it is clear that evolutions in gas demand also depend on anticipated economic growth.92 Both the
IEA and the EIA assume in all their scenarios that GDP growth will pick up speed after 2020,93 which partly explains the acceleration in gas demand between 2020
and 2030.
4.2 EXPECTATIONS FOR GLOBAL GAS SUPPLIES WITH A FOCUS ON LNG
On the supply side, three widely shared expectations are that: a) Europe’s long-term import needs will increase due to a decline in domestic production, according to a time frame and scale that will depend on future demand growth patterns; b) substantial supply potential is available outside Europe; and c) Europe has adequate pipeline and LNG import capacity. The important question is how much Europe will have to pay to gain access to new supplies. Developments in the global LNG market may play a key role in this respect.
There are abundant gas resources worldwide that could feed the currently planned LNG projects, which would result in staggering total capacity additions of over
91 WEO 2013.
92 The underlying assumptions are made available on the websites of the various institutes that developed these scenarios. 93 +1.9%, up from +1.7% and +1.5%, respectively.
620 Bcm.94 However, it is widely expected that only a small share of these projects
will eventually see the light. Already, several Australian projects are facing cost overruns and delays,95 which led to the postponement of FIDs on new greenfield
projects. Canadian and East African projects may face similar challenges. Intensified competition towards the end of the decade would further complicate the outlook for new LNG projects.
Considering only LNG plants under construction, the largest capacity additions will originate from Australian projects (85 Bcm). Other projects that have taken FIDs are Sabine Pass and Cameron in the United States (with a total capacity of 48 Bcm)96
and Vladivostok and Yamal in Russia (with a total capacity of approximately 43 Bcm). Besides Sabine Pass and Cameron, four other US LNG projects received DOE authorisations for non-FTA exports. Among these, FIDs on Freeport and Cove Point (with a total capacity of 26 Bcm97) are expected very soon. Altogether, it is quite
plausible that 70-80 Bcm of US LNG will have entered the market by 2020.
Various trends could influence future LNG supply and pricing patterns. One crucial element is the growth in volumes of ‘flexible’ LNG, or LNG with destination flexibility. While most of today’s LNG supply is locked in firm commitments, there are still relatively large uncommitted volumes. Counting both uncommitted and divertible supplies, Qatar disposes of 34 Bcm/y of flexible LNG. Among projects under construction, the IEA expects that LNG with no firm contract will be 29 Bcm/y around 2018, rising to 58 Bcm/y if portfolio supply is taken into account.98
The bulk of new flexible LNG will originate from projects in the United States, which all offer FOB destination-free volumes. A substantial share of the capacity in American projects is owned by Asian buyers, which have probably earmarked gas for their own markets. However, more than 40% of that capacity is held by portfolio players, which will ship LNG to the destination that offers the best netback.
An important question in connection with scenarios for the European market is how much of the new supplies Asia will be able to absorb. Given that Europe enjoys redundant regasification capacity, surplus LNG could conveniently find its way to the European market in the event of oversupply of LNG to Asia.
94 CIEP analysis based on Clarkson, Woodmac, IGU, GIIGNL, and various project and company websites.
95 Including higher costs due to strict environmental regulations, the appreciation of the Australian dollar, labor scarcity, rising raw materials costs and difficulties in negotiating prices with Asian buyers.
96 Sabine Pass has a capacity of 30.6 Bcm, and Cameron has a capacity of 17.4 Bcm. 97 Freeport has a capacity of 18.3 Bcm, and Cove Point has a capacity of 7.9 Bcm.
The attention is indeed mainly focussed on prospects for LNG from the US, given its abovementioned destination flexibility and the brownfield nature of the projects. Under the current circumstances, LNG exporters are primarily interested in serving the Asian market, where sales margins are more attractive. The mere prospect of American LNG imports appears to have conferred bargaining power to Asia, where buyers have already obtained better terms without one drop of American LNG being exported. American LNG could, however, also find its way to Europe, to an extent that will largely depend on future demand in Asia, the volume and the pace of development of new US LNG, and the impact of these competitive supplies on prices in the region.
Prospective LNG producers outside the US also appear to be more open to alternative pricing mechanisms. For instance, Anadarko and Novatek have declared their willingness to consider adopting hybrid formulae with the inclusion of partial hub indexation for their sales from Mozambique and Yamal. In addition, various suppliers have signed Henry Hub-indexed contracts with Asian buyers.
4.3 SCENARIO 1: LOWER PRICES
Low gas demand in Europe
Global surplus of LNG
Russia fights market share erosion
Low-demand scenarios in Europe hinge primarily on a lack of growth in gas consumption in the power sector, inhibited by continuing competition from coal and renewable energy sources. In this scenario, GDP growth remains weak over the next ten years and the ETS continues to set low CO2 prices. On the supply side, a low-price scenario rests on a worldwide surplus of LNG in the next decade, due to a rapid development of new US LNG production on top of additional volumes from other parts of the world, namely Australia and possibly Canada, East Africa, Qatar and Russia.
In this scenario, the Asian market is unable to absorb all the new LNG volumes coming onstream. This is mainly the result of sluggish LNG demand growth in Asia, owing especially to: a) a weaker economic growth; b) fast decisions on nuclear restarts in Japan and South Korea; and c) a rapid development of shale gas resources in China. This situation leads to a decline in prices in Asia, due to intensified competition and new pricing regimes. Given the limited capacity flexibility of the Asian market, LNG surpluses are routed to other markets, including Europe.
Under these circumstances, additional LNG imports in Europe displace some pipeline supplies, meaning Russian hybrid-priced gas in the first place. In order to prevent
a further erosion of its market share, Russia accepts the introduction of full hub indexation in its long-term contracts and places additional gas in the European market. This entails a cessation of the current upward effect of Russian pricing on European hub prices. Combined with the surplus LNG on offer, this exerts a downward pressure on European gas prices.
A scenario in which prices are subject to some downward pressure is at least plausible. Yet a scenario in which prices stabilise at a much lower level than today (<$8/MMBtu) seems unsustainable in the long run. Gazprom’s ability to accept lower gas prices ultimately depends on the unit cost of new production in Russia, which probably cannot afford a much lower gas price for a prolonged period of time. Even for US LNG volumes, which are commonly regarded as the most competitive, the break-even price for sales to Europe is at least close to $9/MMBtu.99 Therefore, when
existing surpluses are exhausted and investments for new supplies are needed, the high unit cost of new production of Russian gas (and of a number of new LNG projects) – coupled with transportation costs – will require higher prices for suppliers to realise a margin.
4.4 SCENARIO 2: HIGHER PRICES
High gas demand in Europe
Growth in Asian demand absorbs new LNG supplies
Cost overruns and delay hit LNG projects
Demand in this scenario follows the high end of projections on gas demand in Europe (§4.1). Higher GDP growth, a success of gas in transportation, and particularly the implementation of strict environmental policies driving coal out of power generation are among the factors that lead to a strong growth in European demand. On the supply side, depletion caps at Groningen and a fast decline in other European gas production create strong demand for imports from outside Europe. Geopolitical tensions boost efforts to diversify the supply portfolio and seek larger LNG volumes. In the global market, the delays and cost overruns that are hitting LNG projects worldwide – compounded by mounting disagreements on pricing terms between project developers and gas consumers – lead to the cancellation or the postponement of many of the proposed greenfield LNG schemes. Growing demand for gas in Asia absorbs most of the new LNG production. The US LNG supply overhang leads to an easing of Asian LNG prices, but these continue to support the costs of new supplies from the region.
Higher LNG demand in Europe could lead to higher prices for additional LNG imports, which in turn would set the European market price. In this scenario, Europe could acquire new supplies by:
• Allowing its prices to rise to a point where external suppliers become interested in delivering gas. This is not dissimilar from the US market before the development of shale gas: rising prices in the US offered producers the prospect of very high margins, for which they were prepared to run the risk of committing new LNG projects without offtake security. Long-term contracts are not required: high market prices, offering substantial rent to producers, will be sufficient. Under these circumstances, security of supply is based on prices.
• Signing long-term supply deals with LNG producers. This leads to the question of whether external suppliers would be willing to consider pricing mechanisms other than oil indexation. In a sellers’ market, suppliers would have an edge in dictating price terms. While it could be argued that in a situation of high hub prices suppliers would also opt for hub indexation, the same producers could be negotiating traditional oil-linked contracts with Asian buyers. The possibility that Europe would opt for this avenue depends on the continued existence of large European resellers.
Many observers rule out the possibility that in a situation of soaring hub prices, oil indexation would be able to make a comeback in Northwest Europe.100 As a matter
of fact, the structure of the Northwest European market has radically changed in the last decade. In this market, end users have the choice of buying gas at hubs or from resellers, and the hub price has become a benchmark for the value of gas in the market. However, Europe will still largely depend on an oligopoly for its future gas supplies. Taking this into account, much will eventually depend on the marketing and sales strategies of non-European producers and LNG aggregators, as well as on which terms European buyers will accept entering into long-term contracts.
5 CONCLUSION
The concurrence in 2008-2009 of the economic and financial crisis and the marketing of large volumes of uncommitted Qatari LNG led to a situation of ample supply availability which greatly accelerated the transition towards market-based gas pricing in Northwest Europe. This transition was already underway in 2008 when CIEP first published a study on the subject. Over the past six years, pricing mechanisms and other provisions of long-term import contracts in Europe have undergone substantial changes. These developments have shaken the pillars of the structure that has governed gas imports into Europe for decades, and their impact on the market has yet to be fully appreciated.
Northwest Europe has been the frontrunner in these changes, which are now gradually spreading to other regions. Traded and physically delivered volumes have grown at Northwest European hubs. Among these, NBP and TTF present the highest levels of liquidity and have become benchmarks for the value of gas in Northwest European markets. In this part of Europe, the transition is now ‘accomplished’ inasmuch as the price of gas in long-term contracts is essentially at the same level as the price at the hub. Pressures to further renegotiate long-term contracts have recently eased as a result. The structure of the Northwest European market has evolved so fundamentally that a return to full oil indexation in long-term import contracts is generally regarded as highly unlikely.
However, the situation is somewhat fluid because a solid and enduring link to hub prices is still not embedded in all contracts with non-European suppliers. Notably, Gazprom agreed to reduce the price of gas in long-term contracts until it approximated the price at the hub, but its official position is still one that supports oil indexation in long-term contracts. The recent round of renegotiations and arbitrations actually brought additional complexity and diversity to the scene of long-term import contracts. Now that the price gap between long-term contracts and hub supplies has narrowed, it is possible that a new set of discussions will be opened, especially on volume flexibility. In fact, Russia is now receiving approximately the same price as Norway for its gas supplies but is still offering flexibility – which Statoil clawed back when it granted full hub indexation in its long-term contracts.
Evolutions in pricing mechanisms may also influence the position of gas in the European energy mix. Developments in recent years have certainly led to a weakening
of prices in Europe, but gas is still out of the market for power generation. The consideration that gas is still ‘too expensive’ for power generation despite substantial demand destruction since 2008 leads to the question of what drives hub price-setting dynamics in Northwest Europe.
While establishing why hub prices are at the level at which they are today remains very difficult, this study provides a discussion of the role of flexible supplies on hub price formation. Given the high concentration of supply sources to Europe, the positioning of suppliers at European hubs is certainly an important element. While the choice of European suppliers to actively trade at hubs greatly helped NBP and TTF prices to become robust benchmarks, the rationale of non-European participation in hub trade is more complex. Among other reasons, Russia is engaging in trading activities to acquire the capability to sell gas directly on the market in future, while probably being aware that direct sales to Europe may affect its long-term contract position and prices. On the other hand, Qatar is essentially using the European spot market as a fall-back option.
In describing the interplay between flexible supplies and hub price-setting dynamics in Northwest Europe, this study proposes that European production, as well as uncontracted and divertible LNG, are price-takers. A further assumption is that the price of Russian gas in long-term contracts is on average higher than the hub price, implying that buyers would purchase this volume only to cover residual demand. Being the marginal supply, Russian gas plays a fundamental price-setting role when residual demand is higher than the volume of Russian gas that the buyers are contractually obliged to purchase. On the other hand, when residual demand is lower than this amount, price-taking volumes collectively set the price, something which occurred in 2009 when large volumes of Qatari LNG started to flow to Europe.
Supply and demand indeed lie at the root of price formation. Considering general expectations about supply and demand in Europe, what can we expect in future? The study offers two descriptive, normative scenarios that discuss the factors that may lead to lower or higher prices in Europe.
A lower price scenario hinges on a global surplus of LNG, low gas demand in Europe (especially in the power sector) and Russia’s willingness to fight market share erosion. While a lower price scenario is plausible, it is difficult to conceive of a scenario in which European gas prices would fall below $8-9/MMBtu, given the expected high unit cost of new production. On the other hand, a higher price scenario rests mainly on continued high gas demand in Asia, growth in gas demand in Europe, and a