Southern Methodist University Southern Methodist University
SMU Scholar
SMU Scholar
Statistical Science Theses and Dissertations Statistical Science
2020
Statistical Modeling of High-throughput Sequencing Data and
Statistical Modeling of High-throughput Sequencing Data and
Spatially Resolved Transcriptomic Data
Spatially Resolved Transcriptomic Data
Shen Yin
Follow this and additional works at: https://scholar.smu.edu/hum_sci_statisticalscience_etds
Recommended Citation Recommended Citation
Yin, Shen, "Statistical Modeling of High-throughput Sequencing Data and Spatially Resolved Transcriptomic Data" (2020). Statistical Science Theses and Dissertations. 17.
https://scholar.smu.edu/hum_sci_statisticalscience_etds/17
This Dissertation is brought to you for free and open access by the Statistical Science at SMU Scholar. It has been accepted for inclusion in Statistical Science Theses and Dissertations by an authorized administrator of SMU Scholar. For more information, please visit http://digitalrepository.smu.edu.
STATISTICAL MODELING OF HIGH-THROUGHPUT SEQUENCING DATA AND SPATIALLY RESOLVED TRANSCRIPTOMIC DATA
Approved by:
Dr. Xinlei Wang
Professor in Department of Statistical Science, SMU
Dr. Guanghua Xiao
Professor in Department of Population and Data Sciences, UTSW
Dr. Lynne Stokes
Professor in Department of Statistical Science, SMU
Dr. Daniel F. Heitjan
Professor in Department of Statistical Science, SMU & Population and Data Sciences, UTSW
STATISTICAL MODELING OF HIGH-THROUGHPUT SEQUENCING DATA AND SPATIALLY RESOLVED TRANSCRIPTOMIC DATA
A Dissertation Presented to the Graduate Faculty of the Dedman College
Southern Methodist University in
Partial Fulfillment of the Requirements for the degree of
Doctor of Philosophy with a
Major in Biostatistics by
Shen Yin
B.A., Mathematics and Applied Mathematics, Beijing Institute of Technology M.S., Applied Statistics and Data Analytics, Southern Methodist University
Copyright (2020) Shen Yin
ACKNOWLEDGMENTS
I would like to express my special appreciation and thanks to my advisors Dr. Xinlei Wang and Dr. Guanghua Xiao. Their invaluable support during my Ph.D study is more than I could ever give them credit for here. They have shown me what a biostatistician should be. I wish to thank my dissertation committee members, Dr. Lynne Stokes and Dr. Daniel F. Heitjan. Without their insightful guidance and excellent teaching during my Ph.D study, I would not have completed this thesis. In addition, I would like to acknowledge my colleagues at the Quantitative Biomedical Research Center at UT Southwestern for their patient support and for all of the research opportunities I was given. Last but not least, I would like to thank my family and all of my friends, whose support and guidance are always with me.
Statistical Modeling of High-throughput Sequencing Data and Spatially Resolved Transcriptomic Data
Doctor of Philosophy degree conferred December 19, 2020 Dissertation completed December 8, 2020
Recent studies have shown that RNA sequencing (RNA-seq) can be used to measure mRNA of sufficient quality extracted from Formalin-Fixed Paraffin-Embedded (FFPE) tis-sues to provide whole-genome transcriptome analysis. However, little attention has been given to the normalization of FFPE RNA-seq data, a key step that adjusts for unwanted biological and technical effects that can bias the signal of interest. Existing methods, developed based on fresh frozen or similar-type samples, may cause suboptimal
perfor-mance. In Chapter 1, we propose a new normalization method, labeled MIXnorm, for
FFPE RNA-seq data. MIXnorm relies on a two-component mixture model, which models non-expressed genes by zero-inflated Poisson distributions and models expressed genes by truncated normal distributions. To obtain maximum likelihood estimates, we develop a nested EM algorithm, in which closed-form updates are available in each iteration. By eliminating the need for numerical optimization in the M-step, the algorithm is easy to implement and computationally efficient. We evaluate MIXnorm through simulations and cancer studies. MIXnorm makes a significant improvement over commonly used methods for RNA-seq expression data.
MIXnorm has been shown to outperform the normalization methods developed based on FF RNA-seq data, but at the cost of a complex mixture model and a high computa-tional burden. It is therefore important to adapt MIXnorm for simplicity and computacomputa-tional efficiency while maintaining superior performance. Furthermore, it is critical to develop
Advisors: Dr. Xinlei Wang, Dr. Guanghua Xiao
Yin, Shen B.A., Mathematics and Applied Mathematics, Beijing Institute of Technology
an integrated tool that performs commonly used normalization methods for both FF and
FFPE RNA-seq data. In Chapter 2, we develop a new normalization method for FFPE
RNA-seq data, named SMIXnorm, based on a simplified two-component mixture model compared to MIXnorm to facilitate computation. The maximum likelihood estimates of the model parameters are obtained by a nested Expectation-Maximization algorithm with a less complicated latent variable structure, and closed-form updates are available within each iteration. Real data applications and simulation studies show that SMIXnorm greatly reduces computing time compared to MIXnorm, without sacrificing the performance. More
importantly, we developed a web-based tool, RNA-seq Normalization (RSeqNorm
avail-able at http://lce.biohpc.swmed.edu/rseqnorm), that offers a simple workflow to compute normalized RNA-seq data for both FFPE and FF samples. It includes SMIXnorm and MIXnorm for FFPE RNA-seq data, together with five commonly used normalization meth-ods for FF RNA-seq data. Users can easily upload a raw RNA-seq count matrix and select one of the seven normalization methods to produce a downloadable normalized expression matrix for any downstream analysis.
Recently, spatial molecular profiling technologies have enabled a comprehensive cat-alog of molecular profiling data together with tissue imaging data with spatial locations and organizations. In the context of spatial profiling, the research interest lies in inves-tigating the association between gene expression levels and their spatial locations, i.e., identifying spatially expressed (SE) genes. However, gene expression data from spatial
molecular profiling are subject to severe zero-inflation issues. In Chapter3, we propose a
Bayesian Spatial HEAPing model (SHEAP), which aims to accurately recover major spa-tial patterns underlying the gene expression levels that are parspa-tially observed and subject to heaping at zero. An efficient Markov chain Monte Carlo (MCMC) algorithm is developed for Bayesian inference. We evaluate the proposed method through simulation studies and two real data applications. SHEAP shows significant improvement in detecting SE genes compared to existing methods.
TABLE OF CONTENTS
LIST OF FIGURES . . . x
LIST OF TABLES. . . xiv
CHAPTER 1. MIXnorm: Normalizing RNA-seq Data from Formalin-Fixed Paraffin-Embedded Samples. . . 1
1.1. Introduction . . . 1
1.2. An Exploratory Analysis . . . 4
1.3. The MIXnorm Method . . . 6
1.3.1. The statistical model for FFPE data. . . 6
1.3.2. Model fitting via an EM algorithm. . . 7
1.3.3. Review of nested EM algorithms . . . 9
1.3.4. Model fitting via a nested EM algorithm. . . 11
1.3.5. Normalizing gene expression and identifying expressed genes . . . 13
1.4. Results. . . 14
1.4.1. Simulation . . . 14
1.4.2. Data application. . . 15
1.5. Discussion . . . 22
2. SMIXnorm: Fast and Accurate RNA-seq Data Normalization for Formalin-Fixed Paraffin-Embedded Samples . . . 24
2.1. Introduction . . . 24
2.2. Materials and methods . . . 27
2.2.1. The SMIXnorm method . . . 27
2.2.2. RSeqNorm web portal . . . 33
2.3.1. Simulation . . . 35
2.3.2. Data application. . . 37
2.4. Discussions . . . 41
3. SHEAP: Detecting Spatially Expressed Genes via a Bayesian Spatial Heap-ing Model for Zero-Inflated Spatial Transcriptomics Data . . . 44
3.1. Introduction . . . 44
3.2. Methods. . . 48
3.2.1. A spatial heaping model for count data . . . 48
3.2.2. Prior specification . . . 50
3.2.3. Posterior computation and inference. . . 51
3.3. Results. . . 54 3.3.1. Simulation . . . 54 3.3.2. Data application. . . 56 3.4. Discussion . . . 58 APPENDIX A. APPENDIX of CHAPTER1 . . . 65
A.1. Approximating a discrete distribution by a continuous distribution . . . 65
A.2. Technical Details of the Nested EM Algorithm. . . 66
A.3. Performance Evaluation via Simulation . . . 69
A.3.1. Settings . . . 69
A.3.2. Results . . . 71
A.4. Additional Results for Data Applications . . . 80
B. APPENDIX of CHAPTER2 . . . 84
B.1. Nested EM algorithm for SMIXnorm . . . 84
C. APPENDIX of CHAPTER 3 . . . 89
C.1. MCMC algorithm . . . 89
LIST OF FIGURES
Figure Page
1.1 An exploratory analysis of RNA-seq data in Lesluyes et al. [29]. Panel
(a)/(b) shows the histogram of zero-count proportion among 41 FFPE/FF samples (represented by the horizontal axis) based on a total of 20,242 genes. Panel (c)/(d) shows empirical densities of log read counts for the 41 FFPE/FF samples. Each curve in (c)/(d) represents
the density for one sample across all the20,242 genes.. . . 5
1.2 Soft tissue sarcomas data example: the normalized FFPE vs. FF ex-pressions in the log scale from all 41 samples for all 67 genes in the CINSARC gene signature. The left panel shows scatterplots for MIXnorm, TMM and DESeq, and the right panel shows scatterplots for RPM, PS and the original data (without any normalization). Pear-son correlation coefficients are reported for each method in the legend.. . 17
1.3 ccRCC data example: normalized expressions levels of CA9 (Panel A), SLC6A3 (Panel B), UMOD (Panel C) and SLC12A1 (Panel D) from FFPE samples. . . 21
2.1 Summary of RSeqNormweb-portal process. . . 34
2.2 RSeqNorm upload file requirements. . . 35
2.3 Diagnostic plot returned by RSeqNormusing SMIXnorm. . . 36
2.4 Simulation study. Average computing time of SMIXnorm and MIXnorm vs. sample size . . . 38
2.5 Gene-wise correlations between normalized FFPE and FF expression for soft tissue sarcomas data on all20,242protein coding genes. The UQ method failed to normalize the data due to excess zero counts.. . . 40
2.6 Gene-wise correlations between normalized FFPE and RNAlater for ccRCC data on18,458protein coding genes.. . . 42
3.1 Spatially resolved expression profiles. (A) example of spatially expressed (SE) gene. (B) example of non-spatially expressed gene.. . . 46
3.2 The hierarchical structure of the SHEAP model. . . 52
3.3 ROC curves at the false discovery rates from0to1for Simulation I. (A) no
extra zeros. (B) low proportion of extra zeros. (C) median proportion
of extra zeros. (D) high proportion of extra zeros.. . . 61
3.4 ROC curves at the false discovery rates from 0to 1for Simulation II. (A)
low spatial correlations. (B) high spatial correlations. . . 62
3.5 Mouse olfactory bulb data. Spatial expression patterns for 9 SE genes
identified by SHEAP. Expression levels are in the natural log scale. These genes are known to have enriched expression in the mitral cell layer (MCL) but low expression or even no expression in the adjacent
granular cell layer (GCL).. . . 63
3.6 Breast cancer data. Spatial expression patterns for 14SE genes
identi-fied by SHEAP. Expression levels are in the natural log scale. These
14extracellular matrix-associated genes are cancer relevant and
char-acterized as spatially expressed genes in the original study [53].. . . 64
A.1 Simulation study I: the first three columns show box-plots for the 1st to 3rd
quartiles of 18, 458 gene-wise correlations between normalized and true expression levels based on 100 replicates for the five settings
I1 - I5 that vary the proportion of expressed genes φ from 0.59 to
0.99 by 0.1; the last column shows the box-plot of the 18,458
gene-wise Pearson correlations calculated from the combined data, which
contains100×32samples in each setting. The MLEφˆestimated from
the ccRCC data is 0.79, which is the value ofφin Setting I-3 that can
be treated as the reference setting. . . 75
A.2 Simulation study II: the first three columns show box-plots for the 1st to
3rd quartiles of 18,458 gene-wise correlations between normalized
and true expression based on 100 replicates for the three settings
II1 – II3; the last column shows the box-plot of the 18,458
gene-wise Pearson correlations calculated from the combined data, which
contains 100×32 samples in each setting. In II-1, the sample
spe-cific location parametersµis were increased to2times of their MLEs
obtained from the ccRCC data. In II-2, the sample specific scale
parameters σis were increased to 2 times of their MLEs. In II-3,
δis, which control the sample specific background noise for
A.3 Simulation study III: the first three columns show box-plots for the 1st
to 3rd quartiles of 18,458 gene-wise correlations between
normal-ized and true expression levels based on 100 replicates for the two
settings III1 – III2; the last column shows the box-plot of the 18,458
gene-wise Pearson correlations calculated from the combined data,
which contains100×32samples in each setting. In setting III-1, the
variability of gene-wise noise σg was increased from 1.5to 3for
ex-pressed genes. In setting III-2,πjs, the probabilities of extra zero for
non-expressed genes, were set to a half of their MLEs. . . 77
A.4 Simulation study IV: the first three columns show box-plots for the 1st
to 3rd quartiles of 18, 458 gene-wise correlations between normal-ized and true expression based on 100 replicates for the three
set-tings IV1 - IV3; the last column shows the box-plot of the 18,458
gene-wise Pearson correlations calculated from the combined data,
which contains 100 × 32 samples in each setting. In IV-1, a
trun-cated t-distribution was used to generate heavy-tailed data for ex-pressed genes.In IV-2, a gamma distribution was used to generate skewed data for expressed genes. In IV-3, the Poisson log-linear model (model 3.1 from [31]), with modification to better mimic
RNA-seq data from FFPE samples, was used. . . 78
A.5 Simulation study V: the first three columns show box-plots for the 1st to
3rd quartiles of 18,458 gene-wise correlations between normalized and true expression based on 100 replicates for three settings V1
– V3; the last column shows the box-plot of the 18,458 gene-wise
Pearson correlations calculated from the combined data, which
con-tains100×32samples in each setting. Two strategies are compared
when DE genes exist across two experimental conditions: separate normalization for each condition vs. pooled normalization for both
conditions. Each setting containsd%genes that are differentially
ex-pressed, wheredwas set to 5, 10 and 15, respectively. . . 79
A.6 Simulation study VI: average computing time of MIXnorm vs. sample size
I (left panel) and number of genesJ (right panel) . . . 79
A.7 An exploratory analysis of ccRCC RNA-seq data in Eikrem et al. (2016).
Panel (a) plots the empirical densities of log read counts for the 32
FFPE samples. Panel (b) plots the empirical densities of log read counts for the paired RNAlater samples. Each curve represents the
A.8 Q-Q plots using the expressed genes identified by MIXnorm for four ran-domly selected FFPE samples (NF10, NF31, TF32 and TF33) from ccRCC RNA-seq data. The raw reads were transformed into the log scale to calculate sample quantiles. Theoretical quantiles were cal-culated from the TN distributions with sample-specific location and
scale parameters estimated by MIXnorm.. . . 81
A.9 Results from bootstrap KL distributional tests for the 32 FFPE samples
from ccRCC RNA-seq data. Note that they-axis represents−log10(p-value).
The horizontal line is located at y = −log10(0.05). All p-values are
greater than0.05.. . . 82
B.1 Simulation study I. The 1st to 3rd quartiles of gene-wise Pearson
corre-lations for20,242genes between the normalized and true expression
LIST OF TABLES
Table Page
1.1 Data applications: the left and middle panels show gene-wise
correla-tions between normalized FFPE and FF expression for soft tissue sarcomas data; the right panel shows gene-wise correlations be-tween normalized FFPE and RNAlater expression for ccRCC data. The Upper-Quartile method (UQ) failed to work for soft tissue
sarco-mas data due to excess zeros. . . 16
1.2 ccRCC data example: summary of differential expression analysis based
on different normalization methods. The second column is the num-ber of DE genes identified from the FFPE data; the third column is the number of DE genes identified from the RNAlater data; the fourth column is the number of common genes between the two sets of DE genes; the last column is the number of common genes among the
two sets of top 20 DE genes from FFPE and RNAlater. . . 20
1.3 ccRCC data example: the 13 shared genes among the two sets of top 20
DE genes from FFPE and RNAlater, ordered by the absolute value
of the RNAlater log2 FC. . . 20
2.1 Correlations ρ between normalized FF and FFPE RAS pathway
activa-tion scores. p-values in the parenthesis are based on a two-sided
permutation test for the hypothesisH0 :ρ= 0.. . . 38
2.2 Gene-wise correlations between normalized FFPE and FF expression for
soft tissue sarcomas data on the CINSARC gene signature. The UQ
method failed to normalize the data due to excess zero counts.. . . 41
3.1 True positive (TP), false positive (FP) and area under the ROC curve
(AUC) results for Simulation I. Ten spatially expressed genes and ten non-spatially expressed genes are generated in each setting. Zero, low, median and high proportion of extra zeros correspond to
approx-imately45%,60%and75% of zeros within each gene. TP (FP) is the
3.2 True positive (TP) and false positive (FP) results for Simulation II. Ten spatially expressed genes and ten non-spatially expressed genes are
generated in each setting. l is set to 2.5- and 10-percentile of all
pair-wise Euclidean distances in the low and high spatial correlation
setting, respectively. . . 57
3.3 Mouse olfactory bulb data. Analysis of the 10 marker genes in mouse
olfactory bulb data. LL and UL are the lower and upper limits of
the 95% credible interval of l. p0 is the proportion of l = 0 from its
posterior samples after burn-in. . . 58
3.4 Breast cancer data. Analysis of the 14 extracellular matrix-associated
genes. LL and UL are the lower and upper limit of the 95% credible
interval ofl. p0 is the proportion of l = 0 from its posterior samples
after burn-in. . . 59
A.1 Simulation study I: the performance of MIXnorm in identifying expressed
genes, measured by the average proportion of genes detected as expressed (column 3) and the average AUC (column 4) in each of
the five settings I1 – I5. Genej is identified as expressed ifw(jt)>0.5
in the last iteration. . . 76
A.2 Data applications: the left and middle panels show gene-wise
correla-tions between normalized FFPE and FF expression for soft tissue sarcomas data; the right panel shows gene-wise correlations be-tween normalized FFPE and RNAlater expression for ccRCC data.
Genes with mean reads across all samples less than or equal to0.5
were excluded for normalization and the correlation calculation. The
filtered soft tissue sarcomas data contain19,408 genes and ccRCC
CHAPTER 1
MIXnorm: Normalizing RNA-seq Data from Formalin-Fixed Paraffin-Embedded Samples
1.1. Introduction
Human tissue biospecimens are of two primary types, fresh-frozen (FF) and formalin-fixed paraffin-embedded (FFPE) tissues. As fresh tissues deteriorate rapidly at room tem-perature, FF samples must be frozen instantly after collection and then stored in freezers. FF tissues are well suited for molecular analysis using gene expression measurements as freezing preserves RNA well. However, they are expensive to store and transport, and difficult to collect for large-scale studies. By contrast, FFPE samples can be stored at room temperature and kept for a long time. Due to the ease of handling and inex-pensive storage, numerous FFPE tissue samples have been deposited into tissue banks
and pathology laboratories around the world, and are readily available [42, 47, 48]. The
ubiquity of FFPE tissue specimens has made them an invaluable resource in biomedical research, with great potential for predictive and prognostic biomarker discovery.
However, the quality of RNA extracted from FFPE tissues is a concern due to chemical modifications and continued degradation over time. The process of using formalin to fix and paraffin embedding to preserve tissues for an extended period of time is designed to well preserve cellular proteins rather than preserving RNA. Consequently, assays using microarray or quantitative polymerase chain reaction (qPCR) often have limited repro-ducibility and sensitivity when measuring gene expression from such samples. In order to exploit the vast collection of FFPE samples, substantial effort has been devoted to
de-velopment and/or validation of advanced technologies that can reliably probe their gene expression levels. For high-throughput profiling, RNA sequencing (RNA-seq), which uses next-generation sequencing (NGS) to reveal the presence and quantity of RNA in a bio-logical sample, is in common use. Recent studies have shown that for a wide variety of human tumor tissues (e.g., bladder, colon, prostate and renal carcinoma), RNA-seq can be used to measure mRNA of sufficient quality extracted from FFPE tissues to provide
biologically relevant transcriptome analysis [19,20]. Meanwhile, recent FFPE RNA-Seq
solutions such as Illumina total RNA-Seq enable researchers to produce high-quality re-sults from degraded samples. As a result, a drastically increasing number of studies have
used RNA-seq on FFPE specimens [33,39].
A critical step when analyzing RNA-seq data is normalization. Normalization removes systematic biases that affect measured gene expression levels (e.g., variability in exper-imental conditions, sample collection and preparation, and machine parameters, etc.), while preserving the variation in gene expression that occurs because of biologically rel-evant changes in transcription. A number of normalization methods for RNA-seq data have been developed [11]. A common approach is to normalize the measured expression using (estimated) scaling factors. The most straightforward normalization method, Reads Per Million (RPM) [38], estimates the scaling factor by dividing the total read count of a
sample by 1,000,000. The normalized data are the read counts divided by the scaling
factors. The Upper-Quartile (UQ) [4] method estimates the scaling factor by the upper quartile of the read counts within each sample. DESeq [1] works under the assumption that only a small subset of genes are differentially expressed (DE). First, for each gene, the ratio of its read count over its geometric mean across all samples is calculated. Then the scaling factor is estimated by the median ratio within each sample. Thus, it is also re-ferred to as median normalization. Trimmed Mean of M-values (TMM) [49] is also based on the assumption that most of the genes are not DE, where one sample is chosen as the reference sample and the others as test samples. The log ratio of the read count be-tween each test sample and the reference is computed for each gene. Then for each test
sample, TMM estimates the scaling factor by the weighted mean of log ratios after exclu-sion of the genes with extreme average expresexclu-sion or with largest log ratios. PoissonSeq (PS) [31] models RNA-seq data by a Poisson log-linear model. The normalization is done implicitly by including the scaling factor as a term in the model.
Though a number of normalization methods are available for RNA-seq data, none has been specifically designed for FFPE samples, of which a prominent feature is sparsity (i.e., excessive zero or small counts), caused by RNA degradation in such samples. The quantile-based methods become problematic due to excess zeros that cause ranking ties. For DEseq, the geometric mean is only well defined for genes with at least one read count in every sample. The zero inflation is also a concern for methods that implicitly use scaling factors such as PS since they all rely on Poisson or Negative Binomial distributions for modeling count data.
To illustrate characteristics of RNA-seq data from FFPE samples, we begin by
pre-senting an exploratory analysis in Section1.2 using a real data example. In Section1.3,
we propose a novel normalization method, called MIXnorm, based on a two-component
mixture model for log read counts, to capture the sparsity as well as major mean and
variance structures underlying the data. Due to whole-genome sequencing, the number of parameters involved is often very large. We develop an efficient nested expectation– maximization (EM) algorithm to fit the proposed mixture model, where parameters are
updated via closed-form solutions iteratively. Section 1.4 briefly summarizes simulation
studies and expounds two real data applications to compare the performance of the pro-posed MIXnorm to five commonly used RNA-seq normalization methods, including UQ,
DESeq, RPM, PS and TMM. Section 1.5 concludes the paper with a brief discussion.
Technical details, performance evaluation via simulation, and additional analysis results
1.2. An Exploratory Analysis
As mentioned in the introduction, a striking feature of FFPE RNA-seq data is the spar-sity, which can be observed in multiple data sets from independent studies. An example is provided here using paired FF and FFPE samples from a published study, RNA sequenc-ing validation of the Complexity INdex in SARComas prognostic signature [29]. Prognosis of metastatic outcomes in soft tissue sarcomas is important because of its high recurring rate (up to 50% of recurrence). Complexity INdex in SARComas (CINSARC), a gene signature that consists of 67 genes, has been identified as a valuable prognostic factor in sarcomas. This signature was originally identified on FF samples assayed by the mi-croarray platform. The study goal of Lesluyes et al. [29] was to evaluate the prognostic performance of CINSARC on both FF and FFPE samples. Thus, the resulting data set
contains gene expression levels for 20,242 protein coding genes, measured by
whole-genome next generation sequencing on paired FF and FFPE samples from41patients.
We first transformed the raw read counts in this dataset into the natural logarithm
scale. In order to deal with zero counts, we define the log count L ≡ log(C+ 1), where
C is the raw count. Figure 1.1(a) shows that among a total of 20,242 genes, there is a
significant portion of genes with more than 50% zero counts in FFPE samples while (b) shows that over 65% genes, represented by the leftmost bar, do not have any zero count
in FF samples. Further, Figure 1.1(c) and (d) show that for each sample, regardless of
sample types, the commonly used Poisson or Negative Binomial distributions for count data are far from being adequate to capture the bimodal density of gene expression (with
one spike at zero). Two other interesting observations from Figure 1.1(c) and (d) are:
(1) the locations of the distributions of 41 FFPE samples vary much more than those of FF samples, indicating great heterogeneity in RNA degradation levels among the FFPE tissues; and (2) densities from different FF samples show highly similar variability while those from FFPE samples do not (the spread of the curves varies tremendously).
Figure 1.1: An exploratory analysis of RNA-seq data in Lesluyes et al. [29]. Panel (a)/(b) shows the histogram of zero-count proportion among 41 FFPE/FF samples (represented by the horizontal axis) based on a total of 20,242 genes. Panel (c)/(d) shows empirical densities of log read counts for the 41 FFPE/FF samples. Each curve in (c)/(d) represents
the density for one sample across all the20,242genes.
The above findings indicate that existing normalization methods for RNA-seq data, all developed based on FF or like samples, are ill-suited for FFPE samples as they cannot cope with the highly complex features of such data. We proceed to develop a robust yet powerful method, MIXnorm, based on a two-component mixture model to capture the distinct bimodality as well as major mean and variance structures underlying the data. The first component is to model non-expressed genes, whose read counts should be zero or relatively small due to non-specific binding. These genes include biologically zero-expression genes that may exist, or those with low expression but cannot be ex-pressed due to various experimental limitations (e.g., drop-outs), or those that should be expressed but cannot because of high-level mRNA degradation. For the non-expressed genes, we use a zero inflated Poisson (ZIP) distribution to capture the spike at zero for each sample, of which the Poisson mean reflects the background noise level. The second component is to model expressed genes, and we use a truncated normal (TN) distribution
for log gene read counts of each sample to approximate the roughly bell-shaped curve centered at the second mode.
1.3. The MIXnorm Method
1.3.1. The statistical model for FFPE data
Let Cij denote the raw count of gene j from sample i and Lij ≡ log(Cij + 1) is the
natural logarithm transformed count, for i = 1, . . . , I, j = 1, . . . , J. We define a latent
binary variable Dj: Dj = 0indicates gene j is non-expressed in this study, meaning that
observed non-zero counts of genej are due to background noise;Dj = 1indicates gene
j is expressed, with mean expression greater than 0. The following mixture model is
proposed for FFPE data:
Cij ∼ZIP(πj, δi), ifDj = 0, (1.1)
Lij ∼TN(µi, σ2i,0,+∞), ifDj = 1, (1.2)
Dj ∼Bernoulli(φ),
where 0 ≤ πj, φ ≤ 1, δi, σi > 0 for i = 1, ..., I, j = 1, ...J. Here, ZIP(πj, δi) stands for
a zero inflated Poisson distribution, with probability πj being zero and probability 1−πj
being from a Poisson distribution with mean δi; TN(µi, σ2i; 0,+∞) stands for a normal
distribution with mean µi and variance σi2, left truncated at zero as Lij > 0; and φ is
the proportion of expressed genes in the study. Figure 1.1(a) clearly shows the
zero-count proportion varies across different genes, and so πj is assumed to be gene-specific
instead of being constant. The δi reflects sample-specific background noise and should
be relatively small. Figure 1.1(c) shows that the location and spread of Lij both vary
a lot from sample to sample, meaning that the sample-specific mean µi and variance
support{0,log(1),log(2), ...}, but in (1.2), a continuous distribution is used to approximate
the discrete distribution ofLij.
LetΘ = (π,δ,µ,σ, φ)denote the collection of all the parameters in the mixture model,
where π = (π1, ..., πJ), δ = (δ1, ..., δI), µ = (µ1, ..., µI) and σ = (σ1, ..., σI). The
(incom-plete) likelihood function is
L(Θ|C) = J Y j=1 p(Cj|Θ) = J Y j=1 [p(Cj|Dj = 1,µ,σ)p(Dj = 1|φ) +p(Cj|Dj = 0, πj,δ)p(Dj = 0|φ)] = J Y j=1 [ I Y i=1 p(Cij|Dj = 1, µi, σi)·φ + I Y i=1 p(Cij|Dj = 0, πj, δi)·(1−φ)],
wherep(Cij|Dj = 0, πj, δi)is the probability mass function (PMF) ofCij of non-expressed
genes, i.e., the zero-inflated Poisson distribution in (1.1);p(Cij|Dj = 1, µi, σi)is the PMF
of Cij for expressed genes, which will be approximated by a probability density function
(PDF) withlog(Cij+ 1)following the TN distribution on[0,+∞)in (1.2). See AppendixA.1
for a detailed justification about the validity of using the PDF to approximate the PMF. 1.3.2. Model fitting via an EM algorithm
A common method for estimating parameters of a model with a latent variable structure is to employ an EM algorithm [9] to obtain their maximum likelihood estimates (MLEs).
`(Θ|C,D) = J X j=1 logp(Cj, Dj|Θ) = J X j=1 Dj · {log(φ) + log [p(Cj|Dj = 1,µ,σ)]} + J X j=1 (1−Dj)· {log(1−φ) + log [p(Cj|Dj = 0, πj,δ)]}. (1.3)
Let Θ(t) = (π(t),δ(t),µ(t),σ(t), φ(t)) be the parameter estimates at the tth iteration. The
distribution ofDgiven the observed dataC and the current parameter estimatesΘ(t) is
p(D|C,Θ(t)) = J Y j=1 p(Cj, Dj|Θ(t)) p(Cj|Θ(t)) = J Y j=1 wj(t) Dj 1−wj(t) 1−Dj , where wj(t) = φ (t)p(C j|Dj = 1,µ(t),σ(t)) φ(t)p(C j|Dj = 1,µ(t),σ(t)) + (1−φ(t))p(Cj|Dj = 0, π (t) j ,δ(t)) . (1.4)
Each iteration of an EM algorithm consists of two steps, the expectation (E) step and the maximization (M) step. The E step calculates the expected complete-data log
likeli-hood givenC andΘ(t), where the expectation is taken over the latent variablesD. Since
l(Θ|C,D)in (1.3) is linear inDj, andE(Dj|C,Θ(t)) = w (t) j , we have Q(Θ|Θ(t)) =ED|C,Θ(t)l(Θ|C,D) = J X j=1 (1−wj(t)) [log(1−φ) + logp(Cj|Dj = 0, πj,δ)] + J X j=1 w(jt)[log(φ) + logp(Cj|Dj = 1,µ,σ)]. (1.5)
In essence, the E step calculates the conditional expectation of D given C and Θ(t).
(1.5). Note that (1.5) can be maximized with respect to φ, (µ,σ) and (π,δ) separately.
The updated parameter estimates in the(t+ 1)th iteration are given by
φ(t+1) = PJ j=1w (t) j J , (µ(it+1), σ(it+1)) = arg max µi,σi J X j=1 logTN(Lij|µi, σi,0,∞) · w (t) j , i = 1, ..., I, (1.6) π(t+1),δ(t+1) =arg max π,δ J X j=1 I X i=1 h logZIP(Cij|πj, δi)· 1−wj(t)i, (1.7)
where the maximization in (1.7) has constraints πj ∈ [0,1] and δi > 0; TN(·|·) stands for
the pdf of the TN distribution, ZIP(·|·)stands for the pmf of the ZIP distribution, both with
distributional parameters specified after “|”. The update forφ(t+1)has a closed form. Other
parameters can be updated by a Newton-Raphson type method numerically within each
iterationt.
The pmfZIP(Cij|πj, δi)in (1.7) cannot be factored into functions ofπj andδi. Therefore,
the update of(π,δ)involves multi-dimensional optimization, which can be computationally
intensive whenI+J is large, as is typical for high-throughput profiling such as RNA-seq.
Another drawback of the above algorithm is numerical instability due to the use of the Newton-Raphson method for an approximate solution in the M step. Dempster et al. [9] proved that for an EM-type algorithm, the (incomplete) likelihood in every iteration never
decreases as t increases. Thus, the incomplete likelihood is typically used to monitor
the convergence of the algorithm. However, this monotone convergence property does not necessarily hold if the E or M step is not computed exactly. In such situations, the incomplete log-likelihood may fluctuate around a fixed point for a long time. Due to this instability, when applying the above EM algorithm to real data, we observed that it would not converge, especially when a small tolerance value is selected to terminate the iterative process.
1.3.3. Review of nested EM algorithms
van Dyk [61] described how nesting two or more EM algorithms could take advan-tage of closed form conditional expectations and lead to algorithms with both ease of implementation and computing efficiency (i.e., fast and stable convergence). Assume the
missing data can be split into two (or more) setsYmis 1 andYmis 2 such that the complete
data can be expressed byYcom= (Yobs,Ymis 1,Ymis 2), whereYmis 1andYmis 2can be
intro-duced under a data augmentation scheme to aid the computation. LetΘdenote the vector
of all parameters involved, and H is the parameter space. Define the nested conditional
expectation of log-likelihood by
˜
Q(Θ|Θ1,Θ2) =E{E[l(Θ |Yobs,Ymis 1,Ymis 2)|Yobs,Ymis 1,Θ1]|Yobs,Θ2}, (1.8)
where Θ1 and Θ2 denote different realizations of Θ, and Q˜(Θ|Θ1,Θ2) is a function on
H × H × H. The outer expectation in (1.8) is taken with respect toYmis 1 while the nested
inner expectation is taken with respect toYmis 2. According to van Dyk [61], thetth iteration
of a nested EM algorithm repeats the following cycleK times.
Cyclek fork = 1, ..., K:
E step: compute
˜
QΘ|Θ(t+kK−1),Θ(t)
=E{E[`(Θ|Ycom)|Yobs,Ymis 1,Θ(t+
k−1
K )]
|Yobs,Θ(t)}
M step: update the parameter estimates by
Θ(t+Kk) =arg max Θ ˜ Q Θ|Θ(t+kK−1),Θ(t) .
Upon completion of theKth cycle, set Θ(t+1) = Θ(t+KK). That is, runK cycles of the inner
EM algorithm for each iteration of the outer EM.
When the missing data structure is complex, direct calculation ofE`(Θ|Ycom)|Yobs,Θ(t)
is usually difficult. Moreover, we may not be able to directly sample fromp(Ymis 1,Ymis 2|Yobs,Θ),
and thus a Monte-Carlo EM algorithm is not feasible as well. A nested EM algorithm takes
advantages of subdividing the missing data so thatp(Ymis 1|Yobs,Θ)andp(Ymis 2|Yobs,Ymis 1,Θ)
are both known distributions or easy to sample directly. Theoretical properties of nested EM algorithms have been well studied. Theorem 1 in [61] guarantees that, like EM al-gorithms, nested EM algorithms enjoy the monotone convergence property, and so the
incomplete-data likelihoodp(Yobs|Θ)can be used to detect convergence.
1.3.4. Model fitting via a nested EM algorithm
Below we introduce additional latent variables so that a nested EM-type algorithm can be constructed to improve computational efficiency. Based on Lambert [28], a zero inflated Poisson distribution can be thought of as a mixture of two states, the perfect zero state and the Poisson state. Suppose we knew which zeros came from the perfect zero
state and which came from the Poisson state. That is, for a non-expressed gene j, we
define Zij = 1 when Cij is from the perfect zero state and Zij = 0 when Cij is from the
Poisson state, fori= 1, . . . I. Obviously,Zij|Dj = 0∼Bernoulli(πj). Further, we augment
the truncated normal data by (hypothesized) missing observations, which borrows ideas from Tanner and Wong [56] and McLachlan and Jones [37]. That is, the augmented data follow a normal distribution so that the posterior distributions of the parameters or their
functions are straightforward to calculate. For samplei, apart from the observedJgenes,
there areTiunobserved genes withDj = 1and their log countLij <0,j =J+1, ..., J+Ti,
such that Lij ∼ N(µi, σi), forj = 1, ..., J +Ti. Here, the number of observationsTi falling
in(−∞,0)is also latent. Note that we now have a quite complex latent variable structure.
realizations of the unobservable random variables Ti and Lij for j = J + 1, ..., J + Ti.
To iteratively update the parameter estimates, only the conditional expectations of the corresponding sufficient statistics are required.
A nested EM algorithm is invoked by treating Ycom= (C,D,Z,T,Lt)as the complete
data, where T = (T1, ..., TI), and Lt is an array with elements Lij for i = 1, ..., I and
j =J+ 1, ..., J+Ti. The complete-data log-likelihood is then given by
`(Θ|C,D,Z,T,Lt) = I X i=1 J X j=1 Dj[logφ+ logN(Lij|µi, σi) −log(Cij + 1)] + (1−Dj)[log(1−φ) +Zijlogπj+ (1−Zij) log(1−πj)] + (1−Dj)(1−Zij)(Cijlogδi−δi−logCij! ) + I X i=1 J+Ti X j=J+1 [logN(Lij|µi, σi)−log(Cij + 1)]. (1.9)
LetYobs =C be the observed data.Ymis 1denotesDandYmis 2denotes the rest of the
unobserved data (Z,T,Lt). Following the notation used in Dempster et al. [9], denote
Ymis 1(t) = E(Ymis 1|Yobs,Θ(t)). It is clear from (1.9) thatE(`(Θ|Ycom)|Yobs,Ymis 1,Θ(t+
k−1
K )) is
linear inYmis 1. Therefore, the outer E step can be simplified by computingYmis 1(t) only once
per iteration and then run K inner EM cycles with(Yobs,Y
(t)
mis 1)treated as observed data.
Specifically, the outer E step calculatesw(jt) =E(Dj|C,Θ(t)), the conditional expectation
of D. Then the inner EM treats (C,w(t))as observed data, where w(t) = (w(1t), ..., wJ(t)).
SinceZandLtare independent, we are essentially nesting two inner EM algorithms here.
The inner E step involvingZ can be simplified to calculate the conditional expectation of
Zij given(C,w(t),Θ(t+
k−1
K ))by noting that the complete-data log-likelihood (1.9) is linear in
Zij andPIi=1Zij is the complete-data sufficient statistic for πj. The inner E step involving
Lt and T calculates the expected values of the sufficient statistics si =
PJ+Ti
j=1 DjLij
observed data, w(t) and Θ(t+kK−1). For detailed steps of our nested EM algorithm, see
AppendixA.2.
Compared to (1.6) and (1.7), the nested EM algorithm greatly simplifies the process of
updating (π,δ,µ,σ)by providing closed-form formulas and so avoids the need for
high-dimension optimization as well as the issue of numerical instability.
Finally, we need to determine the number of cycles K in each EM iteration. Note that
the purpose of the inner EM cycles is not to reach convergence, but rather to move quickly towards the mode of the incomplete-data log-likelihood with a small computational cost. Because EM algorithms usually make a significant progress in the first few iterations, van
Dyk [61] suggested to fixKat some small value. We chooseK = 5in our implementation.
1.3.5. Normalizing gene expression and identifying expressed genes
Once the mixture model is fitted and the MLEΘˆ is obtained from the nested EM
algo-rithm, the normalized expressionNij of genej from sampleican be obtained by
Nij =E Dj|Cj,Θˆ × Lij − µˆi+ ψ−µˆi ˆ σi Φ −µˆi ˆ σi σˆi , whereEDj|Cj,Θˆ
is calculated by (1.4) from the last E step which estimates the
prob-ability of genej being expressed, and the term in the braces is the estimated expression
for an expressed gene after removing the sample-specific effect. Clearly, the normalized expression is in the log scale. It is easy to use MIXnorm for detecting expressed genes.
Genej is identified as expressed ifwj(t) > cw at convergence, wherecw ∈[0,1]is a cut-off
value. As shown in Table A.1 in Appendix A.3.2, the choice of cw seems not to have a
noticeable impact on the classification performance of MIXnorm. In fact, wj(t) in (1.4) is
determined by the ratio of p(Cj|Dj = 1,µ(t),σ(t)) and p(Cj|Dj = 0, π
(t)
j ,δ(t)), which are
likelihoods are usually separate well. Thus, it is not surprising for us to observe that in
our simulations, wj(t) was either close to zero or close to one when MIXnorm converges,
and so different threshold values in a quite wide range would not affect the detection per-formance much. We mention that MIXnorm is directly applicable to FF or like samples. This is because FF samples may be viewed as a reduced case of FFPE samples (i.e., little degradation in FF samples compared to severe and diverse degradation in FFPE samples). However, it is inappropriate to apply existing methods to FFPE data as they do not have the capacity to deal with the more complex data structure, as mentioned in the introduction.
1.4. Results
1.4.1. Simulation
Simulation studies were conducted to compare MIXnorm with five methods commonly used for normalizing RNA-seq data, including Upper Quartile (UQ), PoissonSeq (PS), DEseq, Reads Per Million (RPM) and trimmed mean of M values (TMM). Here, we used a data-generating model that is modified from the proposed mixture model, in order to better mimic real situations. In our six simulation studies, we examined the impact of the proportion of expressed genes on the normalization performance in study I, the impacts of the sample-specific effects in study II, the impacts of the gene-specific effects in study III, the sensitivity to violations of model assumptions in study IV, the performance of directly and separately applying MIXnorm when differential expressed (DE) genes exist across different conditions in study V, and the relationship between the sample size (number of genes) and computing time of MIXnorm in study VI. For details about the data-generating
models, process and simulation settings, see AppendixA.3.1. All the results are reported
existing methods in nearly all the settings and is more robust to changes of sample-specific or gene-sample-specific effects as well as violations of model assumptions. We also find that the computing time of MIXnorm has almost a perfect positive linear relationship with the sample size and number of genes, respectively. When DE genes exist, we recommend applying MIXnorm to normalize data from different groups separately instead of applying it to pooled data.
1.4.2. Data application
Soft tissue sarcomas data. The soft tissue sarcomas dataset was used for our
ex-ploratory analysis in Section1.2, which contains expression levels for20,242protein
cod-ing genes from paired FF and FFPE samples of 41 patients measured by RNA-seq. Note that the availability of paired FF samples would enable us to quantitatively assess and compare the performance of different RNA-seq normalization methods. Since the true (normalized) gene expression is unknown, it is generally difficult to compare the perfor-mance on real data. Nevertheless, such paired FF data, after normalization to remove technical effects, can be used as a surrogate of the truth. This is because FF tissues are known to maintain RNA very well (much lower degradation of RNA and no methylene crosslink between RNA and proteins) and thus are considered as a gold standard for most molecular assays [52]. To be specific, the gene-wise Pearson correlations between nor-malized FFPE and FF data (in the log scale) were computed and compared among the six different methods (MIXnorm, DEseq, RPM, TMM, PS and UQ). The correlations be-tween original FFPE and FF data (without using any normalization method, also in the log scale) were computed to provide a baseline. We used the same approach as described
in AppendixA.3.2to deal with genes that have zero standard deviations when computing
Pearson correlations.
Since the soft tissue sarcomas data were collected primarily for the analysis of the
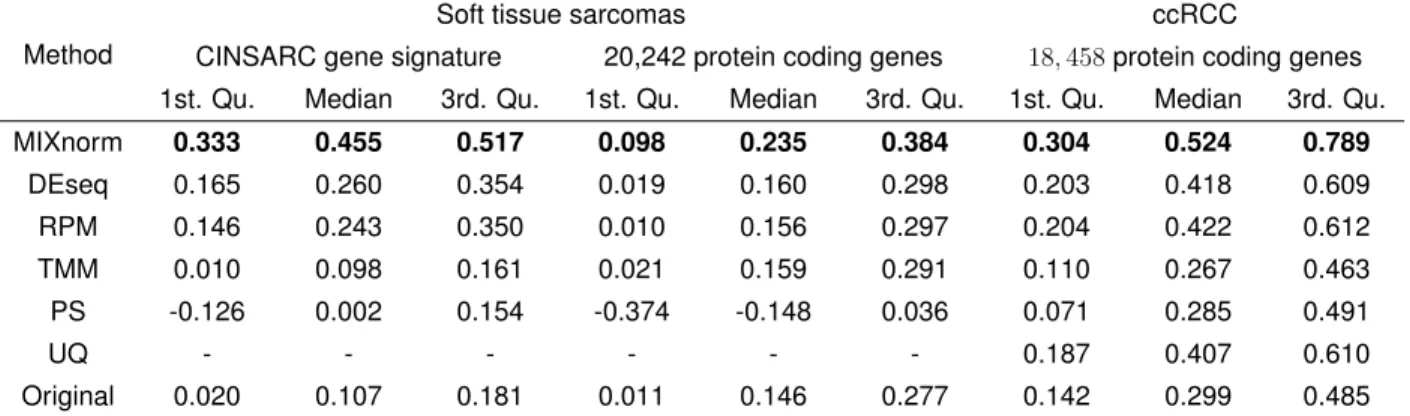
Table 1.1: Data applications: the left and middle panels show gene-wise correlations between normalized FFPE and FF expression for soft tissue sarcomas data; the right panel shows gene-wise correlations between normalized FFPE and RNAlater expression for ccRCC data. The Upper-Quartile method (UQ) failed to work for soft tissue sarcomas data due to excess zeros.
Method
Soft tissue sarcomas ccRCC
CINSARC gene signature 20,242 protein coding genes 18,458protein coding genes 1st. Qu. Median 3rd. Qu. 1st. Qu. Median 3rd. Qu. 1st. Qu. Median 3rd. Qu.
MIXnorm 0.333 0.455 0.517 0.098 0.235 0.384 0.304 0.524 0.789 DEseq 0.165 0.260 0.354 0.019 0.160 0.298 0.203 0.418 0.609 RPM 0.146 0.243 0.350 0.010 0.156 0.297 0.204 0.422 0.612 TMM 0.010 0.098 0.161 0.021 0.159 0.291 0.110 0.267 0.463 PS -0.126 0.002 0.154 -0.374 -0.148 0.036 0.071 0.285 0.491 UQ - - - 0.187 0.407 0.610 Original 0.020 0.107 0.181 0.011 0.146 0.277 0.142 0.299 0.485
as the 67genes in the gene signature. Table1.1 summarized gene-wise correlations for
the CINSARC gene signature in the left panel, and gene-wise correlations for all the genes in the middle panel, where genes in the CINSARC signature show considerably higher correlations than the population of the protein coding genes for the methods MIXnorm, DESeq, and RPM. Among all the methods, MIXnorm results in the highest quartiles. DEseq is the second best in this real data application, which is also one of the recom-mended normalization methods for high-throughput RNA sequencing data [11]. The most straightforward normalization method RPM gives better result compared to PoissonSeq and TMM for genes in the CINSARC signature. UQ failed to normalize the data. After re-moving genes with zero raw read counts across all samples, there are still several FFPE
samples with more than 75% zero counts, which makes the scaling factors of UQ equal
zero. Note that for DEseq, genes with at least one zero read count were removed before
calculating the scaling factors, which removed97%of genes in the FFPE RNA-seq data.
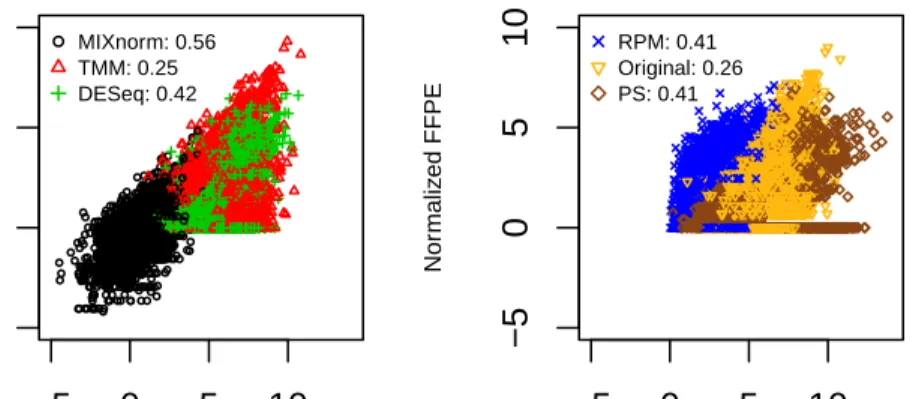
Figure1.2plots the normalized FFPE and FF expression levels in the log scale for all
67 genes in the CINSARC signature, where the left panel shows scatterplots for MIXnorm, TMM and DESeq, and the right panel shows scatterplots for RPM, PS and the original data. We observe that all these genes were identified as expressed genes by MIXnorm,
as one may expect. For all methods except MIXnorm, there are genes whose normalized FF expression is high but normalized FFPE expression is low or almost zero, resulting
in an obvious horizontal line at y = 0. This suggests that the existing methods were not
able to handle genes with zero or low expression well in FFPE samples. The Pearson correlation coefficients between normalized FF and FFPE expression levels reported in
Figure 1.2 also indicate that MIXnorm has the best overall performance for this gene
signature. −5 0 5 10 −5 0 5 10 Normalized FF Nor maliz ed FFPE ● ● ● ●●●● ● ● ● ●●● ● ●● ● ● ● ● ● ● ● ● ● ● ● ●●● ● ● ● ●● ● ● ●● ●● ●● ● ● ● ● ● ● ●●●●●●●●●● ● ● ● ● ● ● ● ● ● ● ●● ● ● ● ● ● ● ● ● ● ● ● ● ● ● ● ● ● ● ● ● ● ● ● ● ● ●● ● ● ● ●● ● ● ● ● ● ● ●● ● ● ● ● ● ● ● ● ● ● ● ● ● ● ● ●● ● ● ● ● ● ● ● ●● ● ● ● ● ● ● ● ● ●● ● ● ● ● ● ● ●● ● ● ● ● ● ● ● ● ● ● ● ● ●● ● ●● ● ● ● ● ●● ● ●● ● ● ● ● ● ● ● ● ● ● ● ● ● ● ● ● ● ● ● ● ● ● ● ● ● ●● ● ● ● ●● ● ● ● ● ● ● ● ● ● ● ● ● ● ● ● ● ●● ● ● ● ● ● ● ● ● ● ● ● ● ● ● ● ● ● ● ● ● ● ● ● ● ● ● ● ● ● ● ● ● ● ● ● ● ● ● ● ● ● ● ● ● ● ● ● ● ● ● ● ● ● ● ● ● ● ●● ● ● ● ● ● ● ● ● ● ● ● ● ● ● ● ● ●●● ● ● ● ● ● ● ● ● ● ●● ● ● ● ● ● ● ● ● ● ● ● ● ● ● ● ● ● ● ●● ● ● ● ● ● ● ● ● ● ● ● ● ● ● ● ● ● ● ● ● ● ● ● ● ● ● ● ● ● ● ● ● ● ● ● ● ● ● ● ● ● ● ●● ● ● ● ● ● ● ● ● ● ● ● ● ● ● ● ● ● ● ● ● ● ● ● ● ● ● ● ● ●● ● ● ● ● ●●● ●●● ● ● ● ● ● ● ● ● ● ● ● ● ● ● ● ● ● ● ● ● ●● ● ●● ●●● ● ● ● ● ● ●●● ●●● ● ● ● ● ● ● ● ● ● ● ●● ● ● ● ● ●● ● ● ● ● ● ● ● ● ● ● ● ●●●● ● ● ● ● ● ● ● ● ● ● ● ● ● ● ● ● ● ● ● ● ● ● ●● ● ● ● ● ● ● ● ●● ● ● ● ● ● ● ● ● ● ● ● ● ● ● ● ● ● ●● ● ● ● ● ● ● ● ● ● ● ● ● ● ● ● ● ● ● ● ● ● ● ● ●● ● ●● ● ●● ● ● ● ● ● ● ● ● ● ● ● ● ● ● ● ● ● ● ● ● ● ● ● ● ● ● ● ● ● ● ● ● ● ● ● ● ● ● ● ● ● ● ● ● ● ● ● ● ● ● ● ● ● ● ● ● ● ● ● ● ● ● ● ● ● ● ● ● ● ● ● ● ● ● ● ● ● ● ● ● ● ● ● ● ● ● ● ● ● ● ● ● ● ● ●● ●● ● ●● ● ● ● ● ● ● ● ● ● ● ● ● ● ● ● ● ● ● ● ● ● ● ●● ● ● ● ● ● ● ●● ● ● ● ● ● ● ● ● ● ●● ● ● ● ● ● ● ● ● ● ● ● ● ● ● ● ● ● ● ● ● ● ● ●● ● ● ● ● ● ● ● ● ● ● ● ● ● ● ● ● ● ● ● ● ● ● ● ● ● ● ● ●● ● ● ● ● ● ● ● ● ● ● ● ● ● ● ● ● ● ● ● ● ● ● ● ● ● ● ● ● ● ● ● ● ● ●● ● ● ● ● ● ● ● ● ● ● ● ● ● ● ●● ● ● ● ● ● ● ● ● ● ● ● ● ● ● ● ● ● ●● ● ● ● ● ● ● ● ●●● ● ● ● ● ● ● ●●● ● ● ● ● ● ● ● ● ● ● ● ● ● ● ● ● ● ●● ● ● ● ●●● ● ● ● ● ● ● ● ●● ● ● ● ● ● ● ●● ● ●● ● ●● ● ● ●● ● ●● ● ● ● ● ● ● ● ● ● ●●● ● ● ● ● ● ● ● ● ● ● ● ● ● ● ● ● ● ● ● ● ● ● ● ● ● ● ● ● ● ● ● ● ● ● ● ● ● ● ● ●● ● ● ● ● ●● ● ● ● ● ● ● ● ● ● ● ● ● ● ● ● ● ● ● ● ● ● ● ● ● ●● ● ● ● ●● ● ● ● ● ● ● ● ● ● ● ● ● ● ● ● ● ● ● ● ● ● ● ● ● ● ● ● ● ● ● ● ● ● ● ● ● ● ● ● ● ● ● ● ● ● ● ● ● ● ● ● ● ● ● ● ● ● ● ● ● ● ● ● ● ● ● ● ● ● ● ● ● ●●● ● ● ● ● ● ● ● ● ● ● ● ● ● ●● ● ● ● ● ● ● ● ● ● ● ● ● ● ● ● ● ● ● ● ● ● ● ● ●● ● ● ● ● ● ● ● ● ● ● ● ● ● ● ● ● ● ●● ●● ● ●● ● ● ● ● ●● ● ● ● ● ●● ● ● ● ● ● ● ● ● ● ● ● ● ● ● ● ● ● ● ● ● ●● ● ● ● ● ● ● ● ● ● ● ● ● ● ● ● ●● ● ●● ● ● ● ● ● ● ● ● ● ● ● ● ● ●● ● ●● ● ● ● ● ● ● ● ● ● ● ●● ●● ● ● ● ● ● ● ● ●● ● ● ● ● ● ● ● ● ● ● ● ● ● ● ● ● ● ● ● ● ● ● ● ● ● ● ● ● ● ● ● ● ● ● ● ● ● ● ● ●● ● ●●●● ● ● ● ● ● ● ● ● ● ● ● ● ● ● ● ● ● ● ● ● ● ● ● ● ● ● ● ● ● ● ●● ● ● ●● ● ● ● ● ● ● ● ● ● ● ● ● ● ● ● ● ● ● ● ● ● ● ● ● ● ● ● ● ● ● ● ● ● ● ●● ● ● ● ● ● ● ●● ● ● ● ● ●● ● ● ● ● ●●● ● ●● ● ● ● ● ● ● ●● ● ● ● ● ● ● ● ● ● ● ● ● ● ● ● ● ● ● ● ● ● ● ● ●●● ● ● ● ● ● ● ● ● ● ● ● ● ● ● ● ● ● ● ● ● ● ● ● ●● ● ● ● ● ● ● ● ● ● ● ●● ● ● ● ● ●● ● ●●● ● ● ●●●●● ● ● ● ● ● ● ● ●● ● ● ● ●● ● ● ●● ● ● ● ●●●● ● ● ● ● ● ● ● ● ● ● ● ● ● ● ● ● ● ●● ● ●● ● ● ● ● ●● ● ● ●● ● ● ● ● ● ● ● ● ● ● ● ● ● ●● ● ● ● ● ● ● ● ● ● ● ● ●● ● ● ● ● ● ●● ● ● ● ● ● ● ● ● ● ● ● ● ● ● ● ● ● ● ● ● ● ● ●● ● ● ● ● ● ● ● ● ● ● ● ● ● ● ● ● ● ● ● ● ● ● ● ● ● ● ● ● ● ● ● ● ● ● ● ● ● ●● ● ● ● ● ● ● ● ● ● ● ● ● ● ● ● ● ● ● ● ● ● ● ● ● ● ● ● ● ● ● ● ● ● ● ● ● ● ● ● ● ● ● ● ● ● ● ●● ●●● ● ● ● ● ● ● ● ● ● ● ● ● ● ● ● ● ● ● ● ● ● ● ● ● ● ● ● ● ● ● ● ● ● ● ● ● ● ● ● ● ● ● ● ● ● ● ● ● ● ● ● ● ● ● ● ● ● ● ● ● ● ● ●● ● ●● ● ● ● ● ● ● ● ● ● ● ● ● ● ● ● ● ● ● ● ● ● ● ●●● ● ● ● ● ● ●● ●●●●●● ● ● ● ● ●● ● ● ● ● ● ● ●●●● ● ● ● ● ● ● ● ● ● ● ● ●● ● ● ● ● ● ● ● ● ●●● ● ● ● ● ● ● ● ● ● ● ● ● ●● ● ● ● ●● ● ●● ● ● ● ● ● ● ● ● ● ● ● ● ● ● ●● ● ● ● ● ● ● ● ● ● ● ● ● ● ● ● ● ● ● ● ● ● ● ● ●● ● ● ● ● ● ● ● ● ● ● ● ● ● ● ● ● ● ● ● ● ● ● ● ● ● ● ● ● ● ● ● ● ● ● ● ● ● ● ● ● ●● ●●●● ● ● ● ● ● ● ●●● ● ● ● ●●●● ● ● ● ● ● ● ● ● ● ● ● ● ● ● ● ● ● ● ● ● ● ● ● ● ● ● ● ● ● ● ● ● ● ● ● ● ● ● ● ● ● ● ● ● ● ● ● ● ●● ● ● ● ● ● ● ● ●● ● ● ● ● ● ●● ● ● ● ● ● ● ● ● ● ● ● ● ● ● ● ● ● ● ● ● ● ● ● ● ● ● ● ● ● ● ● ● ● ● ● ● ● ● ● ● ● ● ● ● ● ● ● ● ● ● ● ● ● ● ● ● ● ● ● ● ● ● ● ● ● ● ● ●● ● ● ● ● ● ● ● ● ● ● ● ● ● ● ● ● ● ● ● ● ● ● ● ● ● ● ● ● ● ● ● ● ● ● ● ● ● ● ● ● ● ● ●● ● ● ● ● ● ● ● ● ● ● ● ● ●● ● ● ● ● ● ● ● ● ● ● ● ● ● ● ● ● ● ● ● ● ● ● ● ● ● ● ● ● ● ●● ● ●● ● ● ● ● ● ● ●● ● ● ● ● ● ● ● ● ● ● ● ● ● ● ● ● ● ● ● ● ● ● ● ●●●●● ●● ● ● ● ● ● ● ● ● ● ● ● ● ● ● ● ● ● ● ● ● ● ● ●● ● ● ● ● ● ● ● ● ● ● ● ● ● ● ● ● ● ● ● ● ● ● ● ● ●● ● ●● ● ● ●● ● ● ● ●● ● ● ● ● ● ● ● ● ● ●● ● ● ● ●● ● ● ● ● ● ● ● ● ● ● ● ● ● ● ● ● ● ● ● ● ● ●● ● ● ● ● ● ● ● ● ● ●● ●●●● ● ● ● ● ● ● ● ● ● ● ● ● ● ● ● ● ● ● ● ● ●● ● ● ● ● ● ● ● ● ● ● ● ● ● ● ●●● ● ● ● ● ● ● ● ● ● ● ● ● ● ● ● ● ● ● ● ● ● ● ●● ● ● ● ● ● ● ● ●● ● ●● ● ● ● ● ● ● ● ●● ● ● ● ● ● ● ● ● ● ● ● ● ● ● ● ● ●● ● ● ● ● ● ● ● ● ● ● ● ● ● ● ● ● ● ●● ● ● ● ● ● ● ● ●● ● ● ● ● ● ● ● ● ● ● ● ● ● ● ● ● ● ● ● ● ● ● ● ● ● ● ● ● ● ● ● ● ● ● ● ● ● ● ● ● ●●●● ● ● ● ● ● ● ● ● ● ● ● ● ● ● ● ● ● ● ● ● ● ● ● ● ● ● ● ● ● ● ● ● ● ●● ● ● ● ● ● ● ● ● ● ● ● ● ● ● ● ● ● ●● ● ● ● ● ●● ● ● ● ● ● ● ● ● ● ● ● ● ● ● ● ● ● ● ● ● ● ● ● ● ● ● ● ● ● ● ●● ● ● ● ● ● ●●● ● ● ● ● ● ● ● ● ● ● ● ● ● ● ● ● ● ● ● ● ● ● ● ● ● ● ● ● ● ● ● ● ● ● ● ●● ● ● ● ● ● ● ●●● ● ● ● ●● ● ● ● ● ● ● ● ● ● ● ● ● ● ● ●● ● ● ● ● ● ● ● ● ● ● ● ● ● ● ● ● ● ● ● ● ● ● ● ● ● ● ● ● ● ● ● ● ● ● ● ● ● ● ● ● ● ● ● ● ● ● ● ● ● ● ● ● ● ● ● ● ● ● ● ● ● ● ● ● ● ● ● ● ● ● ● ● ● ● ● ● MIXnorm: 0.56 TMM: 0.25 DESeq: 0.42 −5 0 5 10 −5 0 5 10 Normalized FF Nor maliz ed FFPE RPM: 0.41 Original: 0.26 PS: 0.41
Figure 1.2: Soft tissue sarcomas data example: the normalized FFPE vs. FF expressions
in the log scale from all 41 samples for all67genes in the CINSARC gene signature. The
left panel shows scatterplots for MIXnorm, TMM and DESeq, and the right panel shows scatterplots for RPM, PS and the original data (without any normalization). Pearson cor-relation coefficients are reported for each method in the legend.
Clear cell renal cell carcinoma (ccRCC) data. Our second application uses the
ccRCC dataset from Eikrem et al. [13], of which RNA-seq data from FFPE samples were
used to simulate synthetic data in Section 1.4.1. ccRCC is the most common subtype
of renal cell carcinoma, and is resistant to conventional chemotherapy and radiotherapy. Therefore, it is only curable by early surgical tumor removal when a surgery is able to eradicate the disease. Reversal of cancer gene expression is predictive of therapeutic potential. Much effort has been made to develop molecular signatures of disease progres-sion for ccRCC. Among many, Eikrem et al. [13] aimed to validate RNA-seq outcomes
from FFPE biopsies with paired RNAlater stored samples for ccRCC patients. The data
include16adult patients from Haukeland University Hospital. Four core biopsies were
ob-tained from each patient, including two with ccRCC and two from adjacent normal tissues. The two pairs of ccRCC and normal tissues were then stored in FFPE and RNAlater, re-spectively. The RNA-seq data obtained from these tissues contain genes annotated by Ensembl. We converted the Ensembl ID to the HGNC symbol by Biomart and kept the
protein coding genes only. The processed dataset contains18,458 protein coding genes
and32paired FFPE and RNAlater samples.
The proposed MIXnorm model in Section 1.3.1 is quite general, we believe. In
prac-tice, however, model assumptions (mainly, zero inflation and truncated normality) may not roughly hold. Thus, before applying MIXnorm to RNA-seq data, we recommend that users conduct an explanatory analysis as we did for the soft tissue sarcomas data
us-ing log transformed read counts (i.e., Figures1.1), and look for clear bimodality with the
first spike occurring at zero and approximately Gaussian curves around the second mode for most samples. The empirical densities of log read counts for the 32 paired FFPE
and RNAlater samples, shown in Figure A.7 of Appendix A.4, suggest the suitability of
the proposed MIXnorm for the ccRCC data. We also suggest conducting a confirmatory analysis after applying MIXnorm, by visually examining Q-Q plots or conducting distri-butional tests, to check whether the assumption of truncated normality is adequate for
expressed genes in most of the samples. Both Q-Q plots (FigureA.8) and p-values from
Kullback-Leibler tests (Figure A.9) suggest that there was no gross departure from the
assumed TN distributions for ccRCC FFPE data. For detail, see AppendixA.4.
RNAlater is an aqueous, non-toxic tissue storage reagent that rapidly permeates tis-sues to stabilize and protect cellular RNA in unfrozen specimens. It is considered to be comparable to the fresh frozen procedure. Therefore, the normalized RNAlater data
were used as a surrogate of the gold standard in this application. The18,458 gene-wise
computed to evaluate the performance. As suggested in Section 1.4.1, we performed MIXnorm separately on the tumor and normal tissues. The gene-wise correlations were
then calculated from all 32 paired samples. The quartiles and median of the
correla-tions are summarized in the right panel of Table1.1. Compared to the original data, the
MIXnorm, DEseq, RPM and UQ normalized data improve the gene-wise Pearson corre-lations. Clearly, MIXnorm performs the best among all methods. DEseq, RPM and UQ have similar quartiles in this application. We note that the ccRCC FFPE data have bet-ter quality compared to the soft tissue sarcomas FFPE data. In fact, DEseq only needs
to remove 32% of genes that have zero raw read counts. UQ needs to remove 5% of
genes with zero raw read counts across all samples. Obviously, the performance of the quantile-based methods heavily depends on the data quality. Further, in real applications with FFPE samples, none of the existing normalization methods is robust while MIXnorm seems to be superior. After all, only MIXnorm is specifically designed for FFPE RNA-seq data.
As requested by one of the reviewers, we provide additional results in Table A.2 of
AppendixA.4to investigate the impact of removing genes with low expression on the
per-formance of different normalization methods. We find that MIXnorm gives similar results regardless of removal of such genes or not, and maintains its top performance.
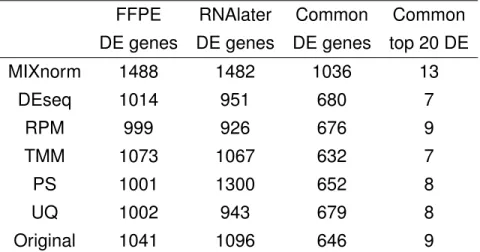
This paired design allows us to conduct differential expression analysis between ccRCC and normal conditions using both FFPE and RNAlater samples, and to access the valid-ity of using FFPE samples for such analysis. We identified differentially expressed (DE) genes (Benjamini-Hochberg adjusted p value < 0.05 from paired t-tests and absolute log2 fold change > 2) from each of the two tissue sources based on the different normalization
methods and report results in Table1.2. We find that MIXnorm gives the highest number
of common DE genes from the two sources. Furthermore, among the two sets of top 20 DE genes identified from RNAlater and FFPE samples, MIXnorm gives the highest
sum-marizes the FFPE and RNAlater log2 fold changes (FCs) of 13 shared genes identified by MIXnorm, of which Spearman correlation is 0.88.
Table 1.2: ccRCC data example: summary of differential expression analysis based on different normalization methods. The second column is the number of DE genes identified from the FFPE data; the third column is the number of DE genes identified from the RNAlater data; the fourth column is the number of common genes between the two sets of DE genes; the last column is the number of common genes among the two sets of top 20 DE genes from FFPE and RNAlater.
FFPE RNAlater Common Common
DE genes DE genes DE genes top 20 DE
MIXnorm 1488 1482 1036 13 DEseq 1014 951 680 7 RPM 999 926 676 9 TMM 1073 1067 632 7 PS 1001 1300 652 8 UQ 1002 943 679 8 Original 1041 1096 646 9
Table 1.3: ccRCC data example: the 13 shared genes among the two sets of top 20 DE genes from FFPE and RNAlater, ordered by the absolute value of the RNAlater log2 FC.
CA9 SLC6A3 NDUFA4L2 UMOD GP2 CLCNKA CDCA2 TNFAIP6 SLC4A11 KNG1 SLC12A1 AQP2 NELL1 RNAlater log2 FC 8.04 7.22 6.39 -6.15 -5.51 -5.28 5.23 5.17 -5.08 -5.02 -4.95 -4.92 -4.77
FFPE log2 FC 5.66 6.31 4.89 -5.62 -4.96 -5.69 5.05 5.45 -5.22 -5.03 -4.89 -4.89 -5.02
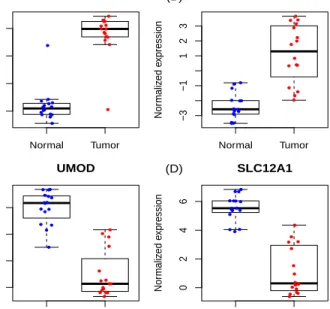
Table 1.3confirms strong over-expression of SLC6A3 and CA9 and under-expression
of UMOD and SLC12A1 in ccRCC tissues, previously identified by
immunohistochem-istry studies [13,51,65]. The normalized expression levels of the four genes from FFPE
samples are plotted in Figure 1.3, which clearly show the up- and down-regulation of
these genes. It is interesting to note that the most up-regulated gene SLC6A3 identified by FFPE data is associated with the process of producing dopamine transporter (DAT). The importance of expression changes of DAT has been widely studied in Parkinson’s
syndrome and attention-deficit/hyperactivity disorder (ADHD) [40, 51]. Recently,
Normal Tumor −4 −2 0 2 CA9 Nor maliz ed e xpression (A) ● ● ● ● ● ● ● ● ● ● ● ● ● ● ● ● ● ● ● ●● ● ● ● ● ● ● ● ● ● ● ● Normal Tumor −3 −1 1 2 3 SLC6A3 Nor maliz ed e xpression (B) ● ● ● ● ● ● ● ● ● ● ● ● ● ● ● ● ● ● ● ●● ● ● ● ● ● ● ● ● ● ● ● Normal Tumor 0 2 4 6 UMOD Nor maliz ed e xpression (C) ● ● ● ● ● ● ● ● ● ● ● ● ● ● ● ● ● ● ● ● ● ● ● ● ● ● ● ● ● ● ● ● Normal Tumor 0 2 4 6 SLC12A1 Nor maliz ed e xpression (D) ● ● ● ● ● ● ● ● ● ● ● ● ● ● ● ● ● ● ● ● ● ● ● ● ● ● ● ● ● ● ● ●
Figure 1.3: ccRCC data example: normalized expressions levels of CA9 (Panel A),
SLC6A3 (Panel B), UMOD (Panel C) and SLC12A1 (Panel D) from FFPE samples.
database and identified the DAT SLC6A3 as a specific biomarker for ccRCC. Our applica-tion demonstrates that SLC6A3 expression measured from FFPE samples may also serve as a highly specific biomarker for ccRCC. Tostain et al. [57] presented a comprehensive study on the Carbonic anhydrase 9 (CA9) as a marker for diagnosis, prognosis and treat-ment in ccRCC. It has been shown that CA9 mRNA expression measured by reverse transcription polymerase chain reaction (RT-PCR) and CA9 antigen detected by ELISA are promising molecular markers for diagnosis and prognosis of ccRCC [57]. Our analy-sis further suggests that CA9 expression measured from FFPE RNA-seq may also serve as a molecular marker for ccRCC. It is worth noting that among the common top 20 DE genes, all normalization methods except MIXnorm failed to identify SLC12A1. SLC12A1 is a protein coding gene that encodes kidney specific sodium-potassium-chloride cotrans-porter and is known to be associated with Bartter Syndrome and Antenatal Bartter Syn-drome. Schrödter et al. [51] found that SLC12A1 expression was decreased in FF ccRCC tissues. Our analysis finds that after MIXnorm normalization, FFPE tissues are also able to detect down-regulation of SLC12A1.
1.5. Discussion
In recent years, many studies have been conducted to evaluate the feasibility of us-ing FFPE specimens with RNA-seq, the dominant high-throughput technology in gene expression profiling. These studies have collectively provided overwhelming evidence of reliable expression profiles obtained from FFPE specimens. However, none of the exist-ing methods was developed for normalizexist-ing FFPE RNA-Seq data, a critical step in data analysis. Motivated by real data from FFPE tissues, we developed a two-component mix-ture model, which intends to capmix-ture major characteristics of the FFPE RNA-seq data accurately. Due to the resulting complex likelihood function, direct maximization can be unrealistic and time-consuming. By designing a nested EM-type algorithm that is easy to implement and computationally efficient, we greatly reduced the difficulty of finding the MLE.
We have shown that MIXnorm maintains top performance across various simulation settings and in two real data applications, compared to five existing RNA-seq normaliza-tion methods. The advantage of MIXnorm becomes more significant when the propornormaliza-tion of expressed genes becomes small. This may be due to the fact that MIXnorm is able to identify expressed genes from non-expressed genes accurately, and then models the two groups separately by ZIP and TN distributions. Besides the improvement in performance, MIXnorm has two other merits: (i) it handles genes with high-proportion zeros rigorously while existing methods typically require removal of such genes beforehand; (ii) it can out-put a parameter that represents the proportion of expressed genes, which can serve as an overall quality score for an RNA-seq experiment using FFPE tissues.
In MIXnorm, we employed zero-inflated Poisson (ZIP) instead of zero-inflated Negative Binomial (ZINB) distributions to model non-expressed genes. This is mainly because after sorting out expressed genes, over-dispersion would not be a major issue. Also, NB and Poisson models often give similar parameter estimates, and NB fitting leads to
![Figure 1.1: An exploratory analysis of RNA-seq data in Lesluyes et al. [29]. Panel (a)/(b) shows the histogram of zero-count proportion among 41 FFPE/FF samples (represented by the horizontal axis) based on a total of 20,242 genes](https://thumb-us.123doks.com/thumbv2/123dok_us/11070211.2993531/22.918.277.635.107.470/figure-exploratory-analysis-lesluyes-histogram-proportion-represented-horizontal.webp)